Gold rebounded. Has it reached its peak?Gold has finally experienced its first pullback, falling from a high of 4058 to a low of around 3944, a drop of over 100 points. This marks the first significant pullback since the recent surge in gold prices. The main reason for the sharp pullback in gold prices is the strong dollar rally following the ceasefire agreement between Israel and Hamas, which allowed investors to take profits. Gold prices continued to fall from their highs, ultimately breaking below the 4000 mark, forming a short-term double top.
Affected by the sharp drop, the price of gold has effectively fallen below the 5-day moving average support, and the short-term moving average support function has become ineffective. After Friday's opening, gold prices traded between the 5-day and 10-day moving averages, entering a transitional consolidation range within the short-term moving average. The 5-day moving average has now turned upward, and the 10-day moving average has crossed the 20-day moving average, indicating a flat trend.
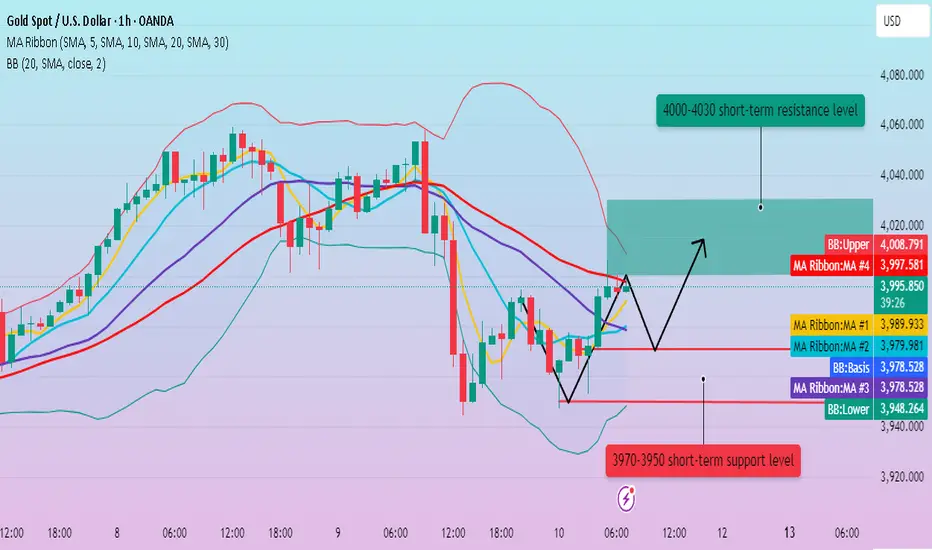
The price has currently rebounded near the lower Bollinger Band, and will remain within the upper middle band in the short term.
Short-term support levels: 3970, 3950.
Short-term resistance levels: 4000, 4015, 4030.
Trading strategy:
Short around 4005, stop loss at 4015, profit range 3960-3940.
Long around 3940, stop loss at 3930, profit range 4000-4010.
Goldprediction
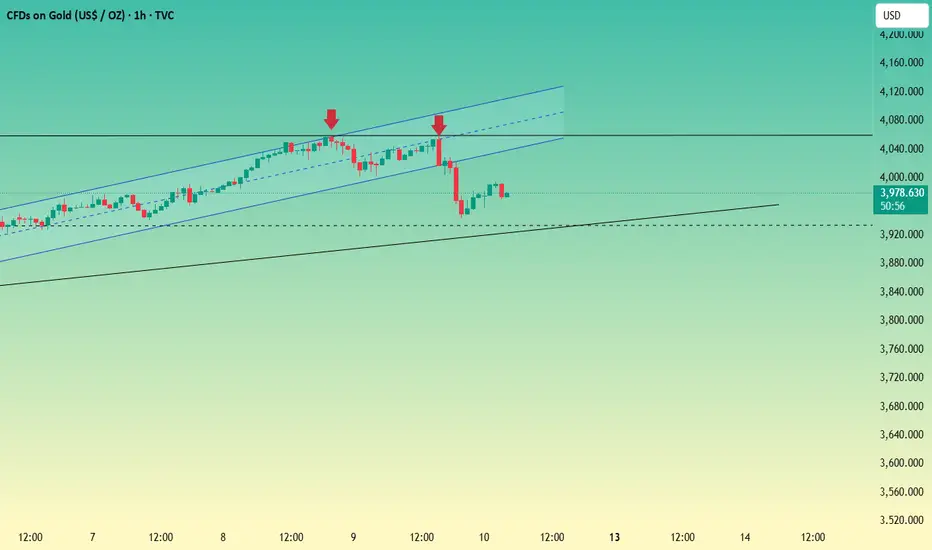
XAU/USD) – Bullish Channel Continuation with Key Support at $3,9The price is moving within an ascending parallel channel, showing an overall bullish trend.
Currently, gold is trading near $3,996, close to the 70 EMA ($3,991).
A support zone is marked around $3,919–$3,950, which has held price action several times.
🔹 Key Levels
Support zone: $3,919 – $3,950
Immediate resistance: Around $4,000 (psychological level + EMA area)
Target point: $4,065
Loss point (Stop-loss): Below $3,919
🔸 Technical Outlook
Trend Direction:
The upward channel and higher highs indicate continuation of the bullish trend unless price closes below $3,919.
Short-term Movement Expectation:
Price might retest the support zone ($3,950–$3,920).
If support holds, an upward bounce toward $4,065 is likely.
If it breaks below $3,919 with volume, price may fall toward $3,870–$3,850 (lower channel line).
EMA Behavior:
The 70 EMA is currently acting as dynamic support; staying above it keeps the bullish momentum intact.
🎯 Trading Plan Suggestion (Technical Only)
Buy zone: $3,940–$3,960
Take profit: $4,060–$4,070
Stop loss: Below $3,915

Prices fluctuated wildly. Downward pressure persists.On Thursday, the market experienced significant price fluctuations, correcting around 4041.5 before rapidly rising, reaching a high of 4058.2. However, the market reversed during the US trading session. Influenced by news of a ceasefire in the Middle East, prices plummeted below the 4000 mark, reaching a low of 3943.3 before consolidating and closing at 3976.9.
This converging pattern indicates that short-term downward pressure persists.
Short-term Trading Focus:
1. Focus on the 4000 mark. If the price rebounds near this level, consider shorting.
2. After breaking through 4000, consider a final short position at 4020.
Profit targets are 3980-3960. Further declines could target 3945-3920.
A long strategy can start with a small long position around 3945, with a profit range of 3980-4000.

XAU/USD Intraday Plan | Support & Resistance to WatchYesterday, we noted the need for a confirmed break above 4046 to sustain bullish momentum.
However, gold failed to hold above the level, leading to a sharp pullback into lower support zones.
Price is now trading below 4000 and under the 50MA, showing short-term bearish pressure.
A clean break above 4000/MA50 could reignite bullish momentum toward 4020 → 4046 → 4,064. Failure to reclaim 4000 risks a deeper retracement toward 3937 (Secondary Support Zone) and 3909–3881 (Deeper Support Zone) where the MA200 may provide dynamic support.
📌 Key levels to watch:
Resistance:
4000
4020
4046
4064
Support:
3970
3,937
3,909
3,881
🔎 Fundamental Focus | Fri, Oct 10
Today’s key data includes Prelim UoM Consumer Sentiment and Inflation Expectations, alongside multiple FOMC speeches (Daly, Goolsbee, and Musalem) — all of which could provide fresh policy clues and volatility for gold.
⚠️ Note: The US government shutdown continues to impact economic data releases, causing uncertainty around timing, revisions, and overall market reliability.

Gold 1H – Price Reaction Ahead of U.S. CPI DataXAUUSD – Intraday Trading Plan | by Ryan_TitanTrader
________________________________________
📈 Market Context
Gold prices remain steady around $3,975, as traders await the U.S. CPI data release later today — a key event that could shape expectations for the Fed’s next rate move.
If inflation cools, the dovish sentiment may boost gold’s safe-haven appeal; however, a hotter CPI print could trigger renewed dollar strength and short-term pressure on XAUUSD.
Market volatility is expected to spike near the release, so liquidity grabs and false breaks are likely before the true direction forms.
________________________________________
🔎 Technical Analysis (H1 / SMC Style)
• The recent Change of Character (ChoCH) confirms short-term bearish control after breaking the bullish structure near 4017.
• FVG Sell Zone (4015–4017) aligns with premium imbalance and prior liquidity — ideal for short setups if price retests that zone.
• BOS to the downside was confirmed at 3960, showing sellers in control.
• The discount zone 3908–3910 is a strong demand area where buyers may step in after liquidity sweep below 3910.
________________________________________
🟢 Buy Zone: 3908–3910
SL: 3900
TP targets: 3920 → 3940 → 3960+
🔴 Sell Zone: 4015–4017
SL: 4022
TP targets: 4000 → 3985 → 3970
________________________________________
⚠️ Risk Management Tips
• Wait for M15 ChoCH / BOS confirmation before entering either side.
• Use partial position sizing around CPI release — volatility may cause large wicks.
• Watch for liquidity hunts near 3980–3990 before CPI, then confirm structure direction.
________________________________________
✅ Summary
Gold is consolidating below key resistance while awaiting U.S. inflation data.
Smart money may engineer a liquidity sweep toward 4015–4017 (FVG) before resuming the bearish leg into 3910.
However, if CPI comes in softer than expected, buyers may defend 3908–3910, sparking a recovery back toward 3980+.
🔔 Stay alert around CPI release hours — expect manipulative price action and confirm structure breaks before committing to directional trades.

XAUUSD: Recovery after the correctionOANDA:XAUUSD After printing a new high at 4059 and retesting the prior high in yesterday’s session, gold came under clear selling pressure. A short-term downtrend has formed. For today’s session, the priority is to look for sell entry when price pulls back into the resistance zone. You can read my previous analysis here:
Today’s balance level: 3950 . If 3950 breaks to the downside, price may continue lower toward before a recovery develops.
📉 Analysis
The short-term structure has shifted to lower high/lower low (LH/LL) intraday , consistent with a tactical correction.
The zone is also a Margin Zone , containing significant CME liquidity and a cluster of Long-call contracts from prior sessions.
Key resistance:
Strong resistance:
Strong support:
📊 Trading Plan
Buy the dip:
Wait to buy at with confirmation.
Targets: first 3950, then .
Stop: below the M5 low of the signal candle. Move to BE at +1R.
Sell at resistance:
Watch reactions at .
If a clear rejection appears (rejection/engulfing), consider a sell entry for the next corrective with target is .
Stop: above the corresponding resistance, manage flexibly.
Please like and comment below to support our traders. Your reactions motivate us to produce more analysis in the future 🙏✨
Victor Dan @ ZuperView

Gold fell sharply. Will there be a strong rebound?Affected by the situation in the Middle East, the market has experienced a deep price correction. This correction is primarily due to news headlines; coupled with gold's recent upward trajectory, reaching new highs, most traders are taking profits.
After hitting a low near 3945, the price has experienced a slight rebound.
The 1-hour chart shows that the MA5 and 10 moving averages show signs of crossing upward, while the MA20 and 30 moving averages turn downward, but the trend is relatively smooth; after the price pulls back and touches the lower track of the Bollinger band, although it rebounds slightly, it is still trading in the middle and lower tracks.
In the short term, pay attention to the 3990 resistance level. After breaking through, the price may rebound sharply and reach above the 4000 mark. Quaid recommends a light long position between 3940 and 3950, with a profit range of 3980 to 4000.
If the upward resistance level cannot be broken for a long time, the price will likely correct again, accumulating momentum and waiting for new catalysts to guide the market's new trend.

Has gold’s expected sharp drop signaled a market top?Gold’s movement yesterday was nothing short of thrilling—it broke down and plummeted from high levels, ultimately failing to hold above the critical 4,000 mark.
On the 1-hour chart, the moving averages have started to turn downward. From the 1-hour candlesticks, it’s clear that upward momentum has weakened significantly, and a double-top pattern has already taken shape on this timeframe. In the short term, gold is under pressure below 4,000, so any rally to higher levels presents an opportunity to enter short positions.
The current rhythm of gold is also crucial. If it doesn’t see a sharp pullback during the Asian session and instead maintains strength into the European session, continuing its slow, bullish upward crawl, gold may adjust by "trading time for space." In this case, it could extend its upward move, then surge strongly amid news-driven catalysts to complete a market washout. Therefore, whether gold shows strength or weakness today will be a key determinant.
Anyway, since gold has begun to fall from its highs, it's best to continue shorting in the short term. If the market continues to weaken, we can't rule out a short-term peak in gold.
Resistance Level:3995,4001,4015
Resistance Level:3944,3930,3910
Trading Suggestions:
① Short gold yesterday after it started falling from 4058 and rebounded to 618, or around 4015.
② Short gold around the top-bottom reversal point of 4000.
Short positions entered yesterday with me at 3977 can continue to be held. If the market rises to 4000, increase your position and continue shorting gold.
For specific trading decisions, please follow my real-time updates. I update my trading ideas and strategies daily. If you don't have a plan or strategy for gold trading and are struggling to achieve consistent and stable profits, you can refer to and follow my updates as a reference and guide to help you avoid mistakes.
Gold sees regular profit taking, direction unchanged
News:
Gold futures weakened during U.S. trading on Thursday (October 9th). This followed Wednesday's record high, prompting short-term futures traders to take profits. The ongoing U.S. government shutdown and other geopolitical uncertainties are keeping safe-haven demand for precious metals steady, which will provide short-term support for both precious metals.
Global stock markets saw mixed overnight performance, but overall strength was evident. After hitting record highs overnight, U.S. stock indices are expected to remain stable upon the New York market open.
Specifically:
Technically, December gold futures bulls have a significant overall near-term technical advantage. Bulls' next upside price objective is closing futures prices above key resistance at $4,100.00.
Bears' next near-term downside price objective is pushing futures prices below key technical support at $3,850.00.
First resistance is seen at the all-time high of $4,080.00, followed by $4,100.00. First support is seen at the overnight low of $4,020.20, followed by $4,000.00.
Strategy:
Long Position3960-3950,SL:3940,Target:4000,4030

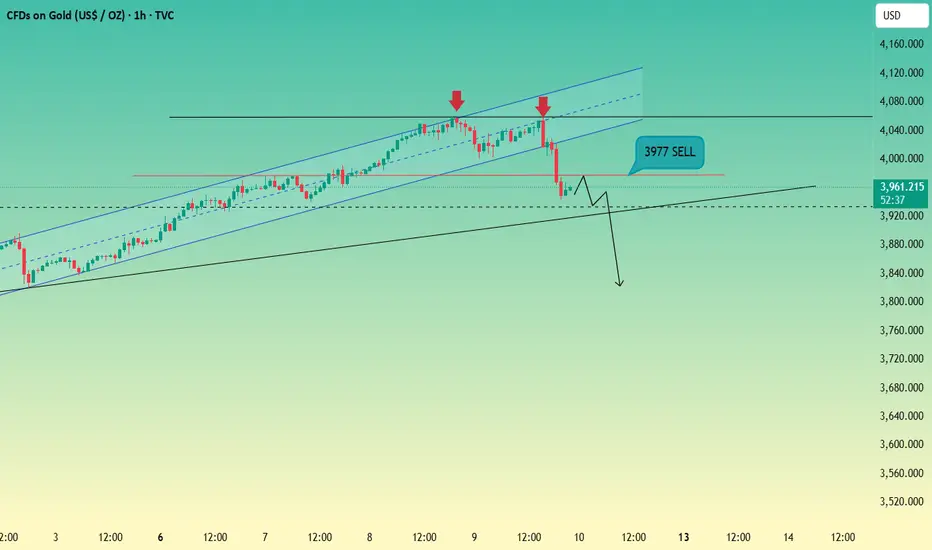
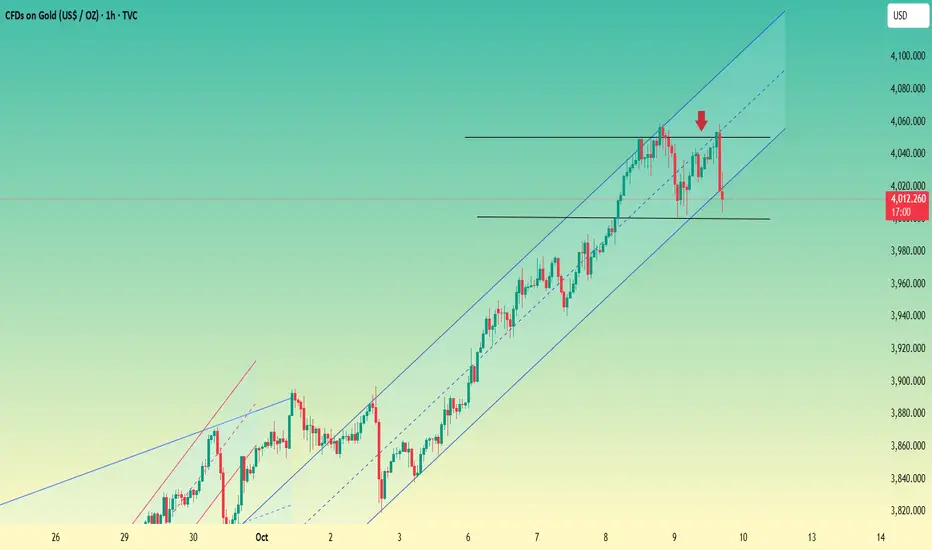
Gold enters the adjustment phase, rebound and then shortGold has broken below its rising trend line, entering a correction phase. After breaking below 4000 points, it has experienced a waterfall-like decline, forming a double top.
Our short positions entered below 4050 have all yielded good returns, in line with our recent short-selling expectations. The main reason for tonight's sharp drop is profit-taking at high levels, coupled with the easing of Middle East relations. Since gold has fallen below 4000 points, a continued downward correction to test 3900 is highly likely in the short term.
Operation strategy: Continue to enter short positions at 3977 (the position of the previous rising top and bottom conversion), target 3944.
Resistance levels: 3977, 3986, 4000
Support levels: 3944, 3930, 3900
For specific trading decisions, please follow my real-time updates. I update my trading ideas and strategies daily. If you don’t have a plan or idea about gold trading and cannot achieve sustained and stable profits, you can refer to and follow my updated content as a reference and guidance to help you avoid mistakes.

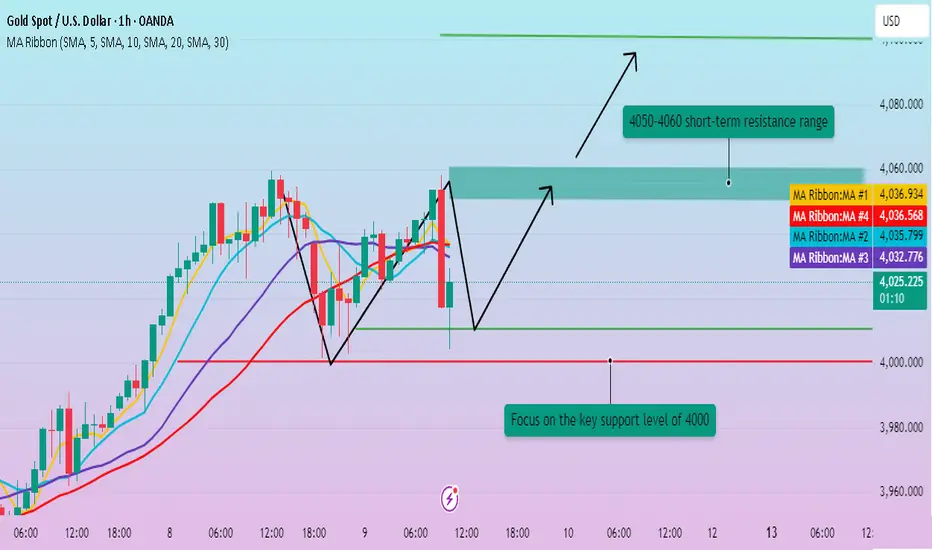
Gold’s Pullbacks Reveal Bearish Strength — 3960 in Sight!After gold retreated from around 4060, it encountered resistance and fell back frequently during the rebound. Although gold still maintained an overall bullish trend, the bullish momentum has obviously weakened, and the short-term gold market has entered a high-level fluctuation stage. Currently, the highest level of gold has reached around 4060. According to the current structure and rebound momentum, if gold cannot effectively break through the recent high of 4060, then gold is likely to form a secondary high point during the oscillation process and form an M-shaped double top structure with the recent high point.
Therefore, although gold is in an overall bullish trend, we still cannot ignore the considerable risk of a pullback in the short term before it effectively breaks through the high of 4060. At present, gold is testing the 4000 mark under the pressure of technical patterns. If the 4000 mark cannot withstand the test, gold may continue to retreat to the area around 3960.
Therefore, in short-term trading, we can still consider waiting for gold to rebound to the 4030-4040 area and try to short gold, first aiming at the retracement target area: 3990-3980; followed by 3960-3950!

XAUUSD 15m – EW Short SetupHi fellow traders,
On the 15m XAUUSD chart, I am applying Elliott Wave principles to outline a short setup. Price has completed wave (v) and is now retesting the Fibonacci cluster between the 0.618 and 0.88 retracement levels, which aligns with a potential reversal zone.
I am entering at the current price, with a Stop Loss at 4059.16, serving as the invalidation level. My Take Profit levels are set at 3991.32 (TP1), 3985.71 (TP2), and 3965.74 (TP3), targeting the projected completion of the next corrective leg.
If price moves above the invalidation level, this wave count is no longer valid.
Good luck and trade safe!

Gold is experiencing a pullback. Trend Analysis.Spot gold fluctuated and weakened in early Asian trading on Thursday, falling nearly 1% to near the $4,000 mark, hitting a low of $4,001.33. However, it quickly rebounded above $4,020, buoyed by buying. On Wednesday, gold prices not only broke through $4,000 for the first time, but also hit a new all-time high of $4,059.07, driving silver prices to a record closing high.
However, just as the rally was in full swing, a sudden turn in the Middle East geopolitical situation—a ceasefire agreement between Hamas and Israel—quickly cooled market risk aversion, leading to a pullback in gold prices on Thursday. This warrants investor caution. Investors should monitor further news on the Middle East situation and shifts in risk aversion, wary of the possibility that this factor could prompt more long-term profit-taking, triggering a deeper correction in gold prices. They should also be mindful of any dip-buying support.
After Wednesday's rally, gold reached a high near 4059. It reached a high during the consecutive Asian and European sessions, then retreated slightly in the US session, reaching a low near 4000, consistent with the previously analyzed strategy of buying on dips to key levels.
In the short term, maintain a bullish long position, with 4000 as a defensive level. Focus on the previous high of 4060. If it doesn't break, take short-term profits. If it does, the market could potentially head towards 4100 or even higher.
In addition, keep an eye on Thursday, which could be a turning point this week, potentially leading to a sweeping decline.
Overall, the short-term operation strategy for gold is to focus on the 4050-4060 resistance, and the short-term support below is 4000-3990.
Strategy:
Go long near 4010, with a stop-loss at 4000. Profit range: 4650-4060.
The adjustment has begun, seize the opportunityGold has remained in overbought territory for the past month. After four consecutive days of strong gains, investors have taken profits, and gold's safe-haven appeal has waned. US President Trump stated that a resolution to the Middle East conflict is "very close." Previously, Israeli and Hamas officials expressed cautious optimism about ongoing negotiations in Egypt, believing that the two-year Gaza conflict could end.
From a technical perspective, the RSI indicator has been in the overbought range. As mentioned before, the recent rise in gold was driven by news. When geopolitical tensions ease, gold will definitely adjust. Today's trend is in line with our expectations. At this stage, we only need to focus on the 4000 point support. If it falls below this position, the next support will be at 3977-3980.
Those who followed me in entering short positions below 4050 today have already taken profits on some of their positions near 4020, and will gradually take profits on the remaining positions near 4000.
For specific trading decisions, please follow my real-time updates. I will update my trading ideas and strategies daily. If you don’t have a plan or idea about gold trading and cannot achieve sustained and stable profits, you can refer to and follow my updated content as a reference and guidance to help you avoid mistakes.
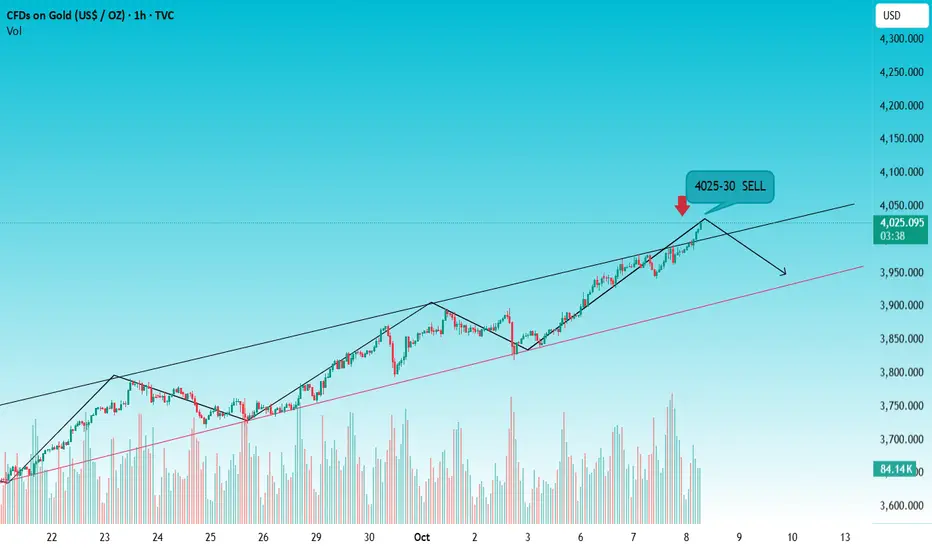
Enter the market with a short position and wait for a pullbackYesterday, as expected, the price fell from around 3977 to 3940, resulting in significant profits on both short positions. We subsequently suggested going long near 3920. Unfortunately, we didn't reach our expected entry point.
Gold has broken through 4000 points as expected by the market. The current high is 4025, which has reached what we call the resistance area. Be prepared to enter a short position here. Don’t worry about whether it is a bullish trend or a decline. The only thing that matters is making money in the end.
It is worth noting that gold and the US dollar have shown a rare trend of simultaneous strengthening recently. The rise in gold is mainly driven by short-term news, but from the perspective of historical linkage, the strong pattern of the US dollar as the pricing currency of gold is sustainable. If the US dollar continues to rise in the future, it will inevitably significantly suppress the upward space of gold, which further supports our current decision to arrange short positions.
For specific trading decisions, please follow my live updates. I will update my trading ideas and strategies daily. If you don’t have a plan or idea about gold trading and cannot achieve sustained and stable profits, you can refer to and follow my updated content as a reference and guidance to help you avoid mistakes.
The short-term adjustment of gold is for a better rise
News:
During the Asia-Europe session on Wednesday, spot gold hit a bottom and rebounded. Affected by the ceasefire agreement signed by Hamas in Gaza, it fell nearly 1% during the session, and then rebounded sharply. It is currently down 0.07%, and its price is stable above the historical high of US$4,000 per ounce.
Gold smells a familiar smell of sweeping here, which is in line with our expectations. According to the signal strategy given yesterday, if the price reaches 4020-4025, enter the long position and you can make a profit now.
Specifically:
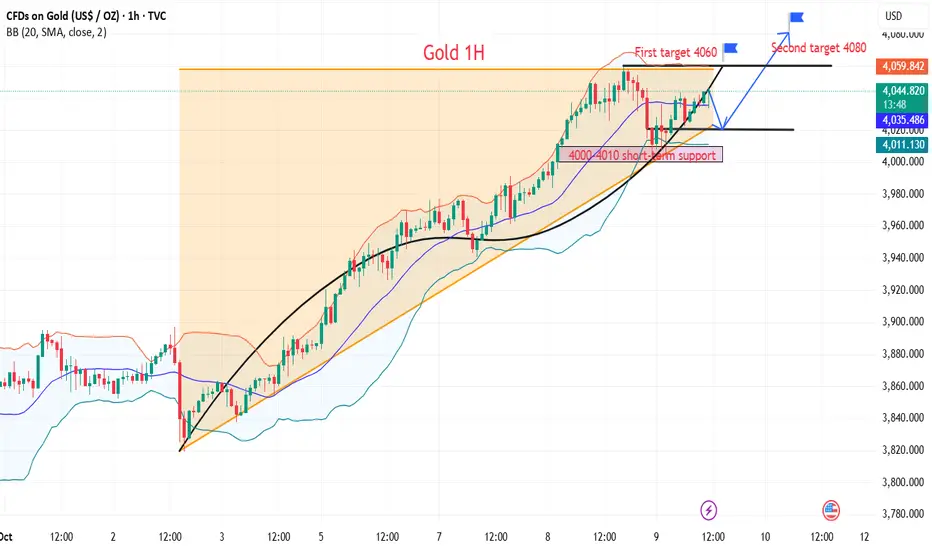
The bullish momentum has not been broken. The upper double-line support on the hourly chart, along with the channel line, serves as a defensive dividing line.
This rally, which began at 3280 in August, accelerated in September and doubled in October, with a nearly $780 surge, setting a new record and reshaping market perception.
The two closest waves, one at 3720 and the other at 3820, sought support for further gains.
The upper double-line support on the hourly chart is currently between 4000 and 4010, tentatively serving as the dividing line for any shifts in momentum. Holding the upper double-line support level will ensure the overall bullish momentum remains unchanged, and any short-term pullbacks and accelerations are intended to facilitate a stronger rally.
Strategy:
Long Position4020-4030,SL:4010,Target:4060,4080
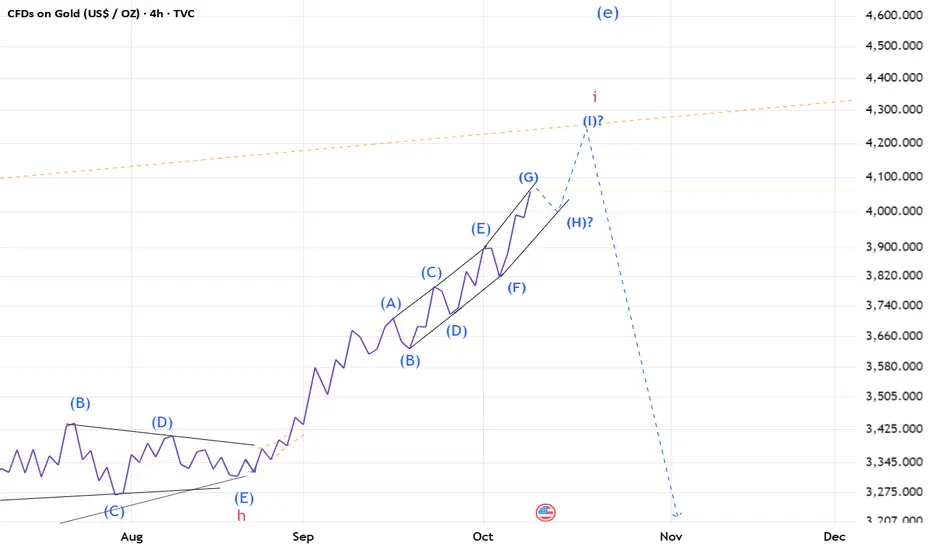
Gold(based on NEo wave)gold is at the end of bull run and its time to sell it on high prices.
after this waves finished I think 2700$ will touch in 2 years later.
Bullish Retracement Setup on Gold (XAU/USD)a bullish retracement setup on Gold (XAU/USD) in the 30-minute timeframe. After a downward correction, price has bounced from a minor support zone and is now showing signs of recovery toward the previous resistance area (target zone). The setup features a defined entry zone, stop-loss below the support, and target at the resistance level—indicating a favorable risk-to-reward ratio for a long (buy) position.

Gold XAUUSD Breakout Setup | VWAP and Market Structure Explained📊 Gold (XAUUSD) Analysis
Gold remains in a bullish trend overall 💪. On the 30-minute timeframe, price is approaching a key level of resistance near the previous swing high.
📈 The VWAP bands show price pressing up toward the first deviation, suggesting momentum remains strong — but this is also where we often see short-term reactions.
💡 Trade idea:
If price can break above the previous high and the first VWAP deviation, then a retrace and retest of that level could offer a potential long opportunity for continuation 🏹.
However, if this setup fails to materialize and price rejects from the current zone, we abandon the long idea and wait for clearer confirmation.
⚠️ Disclaimer: This content is for educational purposes only and not financial advice.

Continued adjustments. Follow the trend.Gold started a steady rise right after the Asian market opened on Wednesday, reaching a high of around 4058.
In the recent market, the bulls have become completely numb to the repeated record highs. In the early stage, the market thought that the integer level of 4000 might form a certain suppression and achieve a callback effect; the fact is that this integer level has no resistance, which also makes the market refresh our cognition. On Wednesday, the U.S. market was trading sideways at a high level. After retreating to around 4026 in the European market, it continued to rise, and the upper pressure position continued to rise.
The moving average system is intact. After a pullback near 4000 in the early Asian session, it continued to rise.
The 4-hour chart shows that the market is in a period of consolidation and correction at a high level, with prices temporarily under pressure near 4050. Currently, the short-term moving average continues to show signs of slight downward divergence, suggesting a consolidation and correction in the short term. The 1-hour chart shows that after a period of narrow range fluctuations, the technical pattern is gradually adjusting. There may be some room for a short-term rebound, but the momentum will be relatively small.
Trading Strategy:
Go long on a pullback to around 4025, with a stop loss at 4015 and a profit range of 4050-4060.

Gold 1H – Watch for Liquidity Hunt Before Fed Minutes💎 XAUUSD – Intraday Trading Plan | by Ryan_TitanTrader
📈 Market Context
Gold continues to shine past the $4,000 mark, driven by persistent safe-haven demand amid U.S. government shutdown risks and growing expectations for multiple Fed rate cuts this year.
The upcoming Fed minutes will be a pivotal catalyst—if the tone leans dovish, gold could accelerate. But any hawkish surprises may provoke a short squeeze or shakeout.
🔎 Technical Analysis (H1 / SMC Style)
• Structure around 4070–4068 marks a premium liquidity zone, likely a sweep or reversal point.
• The lower band 3987–3989 serves as a discount zone / support base from which buyers may re-enter.
• Watch for clean Breaks of Structure (BOS) or Change of Character (ChoCH) on lower timeframes as confirmation.
• Always expect potential liquidity sweeps before major news reactions.
🟢 Buy Zone: 3987–3989
SL: 3980
TP targets: 4000 → 4015 → 4025 → 4040+
🔴 Sell Zone: 4068–4070
SL: 4077
TP targets: 4060 → 4045 → 4030 → 4015
⚠️ Risk Management Tips
• Let the price show intent (reject / sweep / BOS) before jumping in.
• On Fed minutes release, volatility may spike—use partial sizing and tighter trailing stops.
• Avoid trading right at the release; look for reactions and structural confirmation.
✅ Summary
Gold remains bullish structurally, but intraday plays hinge on how markets interpret the Fed minutes. Expect a liquidity sweep around 4068 before potential shorting, and a resilient support zone around 3987–3989 for re-entries aligned with the bigger bullish structure.
🔔 Stay alert for live updates and structure breaks around the Fed minutes to fine-tune entries.

XAU/USD Intraday Plan | Support & Resistance to WatchYesterday, we noted that gold was extended and due for a retracement.
Price failed to hold above 4046 and sharply pulled back, testing the upper edge of the First Reaction Zone, which also aligns with the MA50, now acting as dynamic support.
For bullish momentum to continue toward 4064 and 4080, price needs to reclaim and hold above 4046.
Failure to do so could trigger another retest of the reaction zone and potentially a deeper pullback toward the lower support levels before buyers step back in.
📌 Key levels to watch:
Resistance:
4046
4064
4080
Support:
4020
4000
3970
3937
3909
🔎Fundamental Focus | October 9, 2025
Today’s spotlight is on Fed Chair Powell’s speech, which is expected to set the tone for the day. Markets will be watching closely for any hints on rate-cut timing or comments addressing economic risks amid the ongoing U.S. government shutdown.
Additional Fed officials — Bowman and Barr — are also scheduled to speak throughout the day, which could add layers of volatility if their remarks differ in tone from Powell’s.
With U.S. data releases still limited by the shutdown, today’s Fed communications will be the key market driver.
