XAUUSD Intraday Plan|Will Buyers Defend the Reaction Zone?Gold once again failed to reclaim the 4232 resistance yesterday.
Price tested the level but reversed sharply as sellers stepped in. We now have another test of the Reaction Zone, and price is also trending below the MA50, with the MA200 likely to be tested next.
The 4232 resistance remains the key level buyers must reclaim to attempt another push higher.
On the downside, if the MA200 and the First Reaction Zone fail to hold, watch the Support Zone. If selling pressure continues, the HTF Support Zone becomes the next area where buyers may show a stronger reaction.
📌Key levels to watch:
Resistance:
4232
4274
4322
Support:
4185
4141
4102
4049
4014
3966
🔎Fundamental focus:
High-impact news on the calendar today — expect volatility. Manage risk accordingly.
Goldprediction

Gold Breakout Confirmed — New Cycle Targets Ahead(ATH Possible)Today, I analyze Gold( OANDA:XAUUSD ) on the 4-hour timeframe, building on the previous idea shared. The scenario remains unchanged.
In this analysis, I take a cyclical approach to gold on the 4-hour chart. It appears that gold is completing three similar cycles. For the third cycle to be completed, gold needs to increase.
Another point is that gold previously formed a bull trap when it tested the Resistance zone/Support zone($4,186– $4,133), but now it has successfully confirmed a breakout above that zone. This suggests that the bull trap is no longer a concern, and gold is likely resuming its uptrend.
Additionally, gold could form a bullish channel, but we currently have only one confirmed top and are waiting for a second top to validate the channel.
Moreover, today we’ll see the release of two important U.S. economic indicators, which can significantly impact gold’s movement, especially if the actual figures deviate significantly from expectations:
ADP Non-Farm Employment Change
ISM Services PMI
Considering all of the above, we can set an initial target of around $4,267 for gold. If the cycle completes fully, gold might even reach a Potential Reversal Zone(PRZ) and possibly set a new All-Time High(ATH).
Finally, geopolitical tensions, like those between the U.S. and Venezuela, often lead to higher gold prices since gold is considered a safe haven.
First Target: $4,267
Second Target: Potential Reversal Zone(PRZ)
Stop Loss(SL): $4,147
💡 Please respect each other's opinions and express agreement or disagreement politely.
📌 Gold Analyze (XAUUSD), 4-hour time frame.
🛑 Always set a Stop Loss(SL) for every position you open.
✅ This is just my idea; I’d love to see your thoughts too!
🔥 If you find it helpful, please BOOST this post and share it with your friends.

XAUUSD SELLThe price is rejecting a major resistance level at 4,245.229 and the liquidity grabbed
* Wave Count: The market appears to have topped out at Wave 5 (or corrective Wave C) and is beginning a reversal.
TVC:GOLD

GOLD BULLISH STRUCTURE : M15 Buy Setup Greetings 👋
Gold On M15 Setup Has Bullish The Reason Of Buying Thats Liquidity Has Been Sweeped And Have A Demand Zone To Buy Gold With Confidence And The Target 🎯 is Buy Side Liquidity We Are Trade On Liquidity Hold With Breakeven

Gold price analysis December 4Gold is currently hovering near the small trendline, where the market is about to enter a directional phase. If the selling pressure is strong enough to break this trendline, the price could continue to slide down to the larger trendline below. Conversely, if the sellers fail to break through, this will be the support for the buyers to bounce back and head towards the important resistance zone of 4290.
Today, the trendlines will play a key role in confirming the direction of the market. Note: when the price breaks 4290, the market will no longer be suitable to set up new BUY orders until a stronger support zone appears around 4115.
Recommended trading strategy:
BUY at the small trendline: around 4195
BUY Trigger: when a clear price rejection signal appears at the support zone 4115
Target: 4290
Risk management:
If the price breaks the small trendline and closes the candle below 4190 → close all BUY orders.
The trend will turn sharply down when the price closes below 4115.

Gold price analysis December 3Gold continues to maintain the strength of the uptrend
Buyers continued to successfully defend the 4170 support zone, creating a bullish reaction of more than 50 points and bringing another winning trading strategy. The main trend in the market is still up, so the priority of the BUY strategy in today's session is still maintained.
The price is expected to move towards the 429x resistance zone, opening up the opportunity to form a new uptrend towards the historical peak (ATH). As long as the confluence support zone with the trendline around 4115 continues to hold, the upward prospect of gold will still be preserved.
📌 Trading Strategy
Hold BUY: 4195 – 4170
BUY Trigger: Look for a price rejection signal around 4115
Target: 4290
⚠️ Risk Management
The uptrend will be threatened if the price closes below 4115 and forms a downtrend structure.
Sell Scalp can be considered when 4170 is broken, target 4115.

Gold plans in Asian and European trading sessions1️⃣ Trend Lines
• Descending Trend Line (Key Dynamic Resistance)
Price has touched this trend line several times but has not broken through, confirming that selling pressure remains dominant.
This is a crucial area: if a breakout does not occur, the price could potentially reverse sharply lower.
• Long-Term Ascending Trend Line
This is the main bullish structure in the market.
A larger decline will likely break through this trend line before the price reacts.
2️⃣ Resistance (Red Zone Above)
This is the intersection of:
✓ Descending Trend Line
✓ Nearest Local Peak (High)
This is the best sell zone under current market conditions.
Only if the price is able to close the candle with a strong breakout can a bullish reversal be confirmed.
3️⃣ Support (Green zone below)
This zone has been a recurring price reaction area, serving as important short-term support.
If the price breaks through this support zone, the downtrend will likely continue towards the long-term uptrend line.
📈 BUY GOLD: 4167 – 4165
Stop Loss: 4155
Take Profit: 100 – 300 – 500 pips
📉 SELL GOLD: 4264 – 4266
Stop Loss: 4276
Take Profit: 100 – 300 – 500 pips

Prices are pulling back; look for buying opportunities.The current market trend is largely in line with expectations, and market sentiment remains bullish, mainly due to market expectations of a Federal Reserve rate cut. The need for technical adjustments in the short term remains, while fundamental factors may continue to fuel bullish sentiment. Therefore, the overall bullish trend remains unchanged for the time being, just not very strong.
The 4-hour chart shows the Bollinger Bands narrowing, and the moving average system is relatively flat. Influenced by the ADP data, the price rose slightly to around 4241, above the middle Bollinger Band, before pulling back. The 5, 10, and 20-day moving averages are currently converging near the middle Bollinger Band, offering little short-term reference value. Meanwhile, the 30-day moving average at 4200 remains a crucial support level.
The overall trading range is currently between 4250 and 4190. Although there have been significant downward pullbacks, they have been short-lived, indicating a lack of strong continuation of the bearish trend.
For trading, continue to focus on the resistance level of 4250-4260 in the short term. Failure to break through this level could present opportunities to short in this area. On the downside, pay attention to the support level at 4200. Without news to support the continuation of the downtrend, short-term long positions can be taken within the 4250-4200 range.
I will adjust my strategies flexibly based on market fluctuations and update the channel accordingly.

XAUUSD (15m) Analysis — Support/Resistance Setup📊 XAUUSD (15m) Analysis — Support/Resistance Setup
1️⃣ Support Zone (Pink Area)
The pink zone marks a strong demand area where buyers stepped in earlier.
You can see a sharp bounce from this level, confirming active buyers.
As long as price stays above this support, the structure remains bullish.
2️⃣ Resistance Zone (Green Area)
This is the key supply zone where price was rejected multiple times.
Sellers are waiting here, and this is the level gold must break above to show real bullish continuation.
3️⃣ Current Price Action
Price is slowly pushing upward after forming a higher low above support.
EMAs are starting to tighten and curl upward — early signs of momentum shifting.
This suggests building strength, but major confirmation only comes above resistance.
4️⃣ Setup Logic
Bullish Setup:
If price continues upward and breaks above the green resistance, buyers may push toward the next higher levels.
Break + retest of resistance = strong continuation signal.
Bearish Setup:
If price fails to break above resistance and falls back, watch for a return to the support zone.
A breakdown below support would open the door for a deeper bearish move.
5️⃣ Summary
Above support → bullish bias
Below support → bearish continuation
Breakout above resistance → bullish move opens
Rejection from resistance → back to support

GOLD 4H CHART ROUTE MAP UPDATE & TRADING PLAN FOR THE WEEKHey Everyone,
Please see our 4h chart remaining levels and targets for the coming week with one updated Goldturn.
We are now seeing price play between two weighted levels with a gap above at 4224 and a gap below at 4124. We will need to see ema5 cross and lock on either weighted level to determine the next range.
We will see levels tested side by side until one of the weighted levels break and lock to confirm direction for the next range.
We will keep the above in mind when taking buys from dips. Our updated levels and weighted levels will allow us to track the movement down and then catch bounces up.
We will continue to buy dips using our support levels taking 20 to 40 pips. As stated before each of our level structures give 20 to 40 pip bounces, which is enough for a nice entry and exit. If you back test the levels we shared every week for the past 24 months, you can see how effectively they were used to trade with or against short/mid term swings and trends.
The swing range give bigger bounces then our weighted levels that's the difference between weighted levels and swing ranges.
BULLISH TARGET
4224
EMA5 CROSS AND LOCK ABOVE 4224 WILL OPEN THE FOLLOWING BULLISH TARGET
4328
EMA5 CROSS AND LOCK ABOVE 4328 WILL OPEN THE FOLLOWING BULLISH TARGET
4422
EMA5 CROSS AND LOCK ABOVE 4422 WILL OPEN THE FOLLOWING BULLISH TARGET
4494
BEARISH TARGETS
4124
EMA5 CROSS AND LOCK BELOW 4124 WILL OPEN THE FOLLOWING BEARISH TARGET
4042
EMA5 CROSS AND LOCK BELOW 4042 WILL OPEN THE SWING RANGE
3964
3873
As always, we will keep you all updated with regular updates throughout the week and how we manage the active ideas and setups. Thank you all for your likes, comments and follows, we really appreciate it!
Mr Gold
GoldViewFX

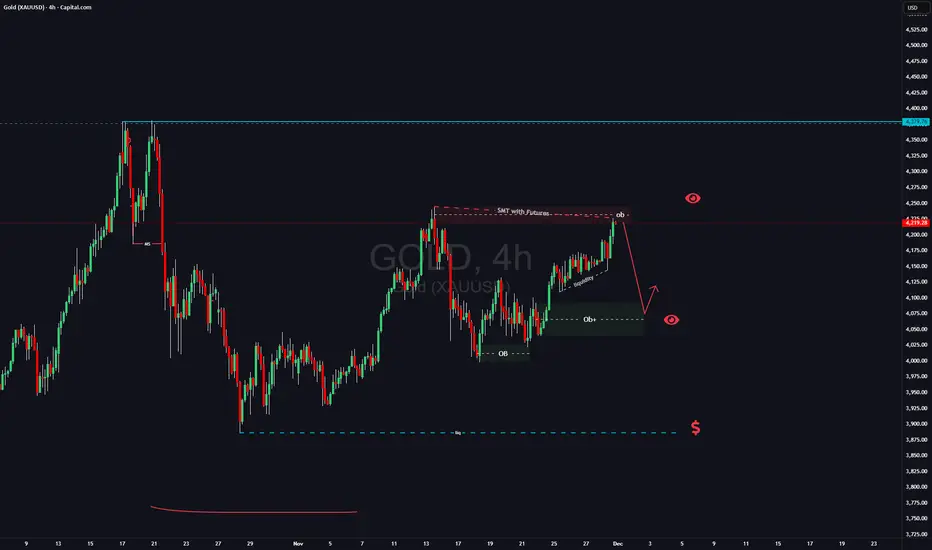
GOLD SETUP: The Liquidity Grab That Could Change Your Month!There is intresting situation on Gold right now:
1) There is SMT with futures(on futures price went higher than previous high from November 13th
2) Have a lot of liqudiity down below which usually means that this liqudiity will be taken
3) strong uptrend on LTF
taking in consideration these factors and that it will be beginign of the month on Monday i will be looking for manipulation at market opening. If i see trend shift on LTF i will be looking for short position till 4110 area (4h OB) , if this wont happen i simply gonna skiip trading GOLD this week.
When price action is not clean and when its hard to see clear picture better to avoid such trade and just watch.
Like and follow if you like my analysis
XAUUSD Intraday Plan|Bulls vs. 4232 — Break or Reject?Gold dropped into the Reaction Zone as outlined in yesterday’s analysis and bounced back, currently trading around 4206. Price is sitting between the two moving averages and still below the 4232 resistance, waiting for a fresh catalyst.
For buyers to take price higher, we need a clean break above 4232, which would open the path toward 4274, and if momentum is strong, a possible move toward 4322.
If we see another failed attempt at 4232, price is likely to revisit the Reaction Zone.
If this zone gives way, watch the Support Zone and the HTF Support Zone, where buyers are likely to step back in.
📌Key levels to watch:
Resistance:
4232
4274
4322
Support:
4185
4141
4102
4049
4014
3966
🔎Fundamental focus:
Today brings several high-mid-tier U.S. data releases - all of which may add short bursts of volatility. With major events still ahead later in the week, markets may stay reactive and sensitive to headlines.

The expectation of interest rate cuts remains the core support.#XAUUSD TVC:GOLD OANDA:XAUUSD
✅ From the daily chart, gold prices are still above the MA5 and MA10. A prudent approach is to wait for a pullback to buy, or continue to use a buy-low-sell-high strategy until key resistance is broken. With the moving averages rising, the first support level to watch today is 4205-4195. If the price finds support and stabilizes in this area and strengthens again, the first resistance level to watch is the 4260-4270 area. This level represents both the previous high and a key level determining whether gold can hold above the 4300 mark.
✅ It is worth noting that if the price breaks below the support range of 4205-4195, it may retest the 4160-4140 area. It is particularly important to note that repeated testing of the same support level often signals weakness, and a cautious approach is necessary.

Bonus Gold long Week 01 DecemberVery simple Gold long for week 01 December.
Trade based on Fibonacci levels on the 4 hour chart.
i have added 2 TP first for 750 pips and full TP for over 1000 pips/
With these trades it is recommended to just use small lot size and be prepared to hold in drawdown .
not to be considered financial advice its just a bit of fun with technicals
let me know if you want to see more of these along with the weekly chart

Gold 1H – 4262 Sweep Drop or 4188 Hold the Floor?🟡 XAUUSD – Intraday Smart Money Plan | by Ryan_TitanTrader (03/12)
📈 Market Context
Gold is trading into policy-driven liquidity engineering as former White House adviser Kevin Hassett gains renewed spotlight after public commentary from former U.S. President Donald Trump referencing potential Federal Reserve leadership influence. Expect sharp liquidity sweeps both sides before institutions commit.
Technically, H1 price coils between premium and discount extremes, and the next leg unlocks only after MSS (CHoCH) + BOS + displacement validation.
🔎 Technical Framework – Smart Money Structure (1H)
Current phase = liquidity-rich compression at H1 extremes
Liquidity zones & key triggers
• 🔴 SELL GOLD 4265 – 4267 | SL 4275
Institutional idea: sweep above premium → bearish MSS + valid BOS down → FVG/OB retest → delivery into discount.
• 🟢 BUY GOLD 4186 – 4184 | SL 4176
Institutional idea: sweep below discount → bullish MSS + BOS up → FVG/OB retest → demand expansion.
• 🟡 Equilibrium / Chop: no trading unless structure proves intent.
Expected sequence = Sweep → MSS/CHoCH → BOS → Displacement → Retest → Expansion
🎯 Execution Rules (unchanged methodology, matching your zones)
🔴 SELL GOLD 4265 – 4267 | SL 4275
Rules:
✔ Price taps 4266 zone → bearish MSS/CHoCH (M5–M15)
✔ Confirm clean bearish BOS down with displacement
✔ Enter on FVG fill or OB retest after displacement
Targets:
1. 4245 – 4240
2. 4225 – 4215
3. 4186 – 4184
🟢 BUY GOLD 4186 – 4184 | SL 4176
Rules:
✔ Price sweeps 4185 → bullish MSS/CHoCH + BOS up
✔ Confirm displacement away from discount
✔ Enter on wick rejection + FVG fill or OB retest confirmation
Targets:
1. 4215
2. 4240
3. 4265+
⚠️ Risk Notes
• Both sweeps = traps until BOS + displacement proves intent.
• No averaging inside compression.
• SL = structure invalidation only.
• Reduce lot size during volatility spikes from headline risk.
📍 Summary
Two institutional routes today:
• 4266 sweep → bearish MSS/BOS → retest → delivery into 4185
or
• 4185 sweep → bullish MSS/BOS → retest → expansion into new 4266+
Trade the structure. Let price narrate intent. Patience = edge.
📌 Follow @Ryan_TitanTrader for daily Smart Money breakdowns.

Consider buying at a low point before the data is released.On Monday, gold prices rebounded after hitting a low of around 4163 in the US session, and have since reached a high of around 4228, approaching the previous high of 4235.
Although currently undergoing a minor pullback in the short term, the overall trend remains bullish, and there is a possibility of further upward breakout after a period of consolidation. The current support level will remain around the psychological level of 4200, and there is a possibility that this level will be broken.
However, given the current overall situation, a continuous decline is relatively unlikely. In a sustained uptrend, Monday's pullback serves as a significant indicator of bullish correction. Key support remains around 4190, a level crucial for future price movements.
If the price continues to consolidate above 4200 in the European session, a long position could be considered. Key resistance remains around Monday's high of 4235; a break above this level could lead to further gains.
In the short term, it's advisable to patiently wait for a pullback before going long. Consider buying around 4190-4195, with a target of 4230-4150 and a stop-loss at 4180. This trading strategy will remain unchanged until the US data release. I will also update the channel with information based on market movements.

XAUUSD(GOLD) HIGH PROBABILITY LONG SETUP SOON!!!🚨 XAUUSD HIGH PROBABILITY BUY SETUP 🚨
* Here We Can See Clearly The Next Potential Moves For GOLD Coming Hours/Days.
* Keep Your Eyes Close On Your Trading Positions.
* Happy PIP Hunting Traders.
FXKILLA.

XAUUSD | Price Sees Bounce to ReboundGold (XAU/USD) rebounded well overnight from the $4,155-$4,150 support level. This upward movement benefits gold bulls.
However, traders are advised to exercise caution and wait for confirmation of a breakout of key levels.
✅ Bullish Scenario
- Key Hurdles: It is recommended to wait for price acceptance above the strong $4,245-$4,250 barrier before taking further bullish positions.
✅ Upside Target: Once $4,250 is broken, gold could:
- Surpass the weekly high around $4,264-$4,265.
- Break through the $4,277-$4,278 resistance.
- Aim to reclaim the $4,300 round number.
✅ Bearish Scenario
- Initial Support (Buying Opportunity): Weakness below the $4,200 round figure may continue to attract buyers and is expected to find decent support ahead of the $4,150 level.
- Critical Point (Pivot): The $4,150 level should act as a key pivotal point.
- Strong Selling Trigger: A break below $4,150 could drag Gold prices towards the $4,100 round figure.
- Key Confluence Support: Continued selling will test the confluence support at $4,075 – $4,073.
Note: $4,075 – $4,073 consists of the 200-period EMA on the 4-hour chart and a long-term uptrend line.

GOLD ANALYSIS What’s Moving the Market Today? December 03, 2025OANDA:XAUUSD GOLD ANALYSIS What’s Moving the Market Today? (December 03, 2025)
Welcome back to Trade with DECRYPTERS, where we decode smart-money footprints into clean, actionable buy & sell zones.
Keep it simple. Trust the levels. Follow the plan.
📰 Market Overview
Gold continues its steady climb after reacting perfectly from Smart Money Buy Orders earlier this week. With price now rotating toward upper liquidity pockets, bulls remain firmly in control despite mild USD stabilization.
The U.S. Dollar Index has cooled after its post-election volatility, but ongoing geopolitical pressure and aggressive central-bank accumulation continue to support gold’s macro-bullish structure.
With key U.S. data (ADP, ISM Services, PCE) lined up this week and the FOMC approaching on December 9–10, markets are moving cautiously. Gold remains well-positioned inside a clean premium–discount rotation, respecting SMC structure consistently.
🔍 Key Fundamentals Driving Today’s Move
📈 88% probability of a December rate cut → lower yield competition boosts gold
💵 USD stabilizing but not strengthening → limits downside pressure
🌍 Global geopolitical tensions remain elevated → strong safe-haven premium
🏦 Central banks remain net buyers (634t YTD) → long-term structural demand
📊 Core PCE at 2.9% → keeps the Fed dovish-leaning but cautious
Gold’s strength continues to be driven by a clean mix of macro uncertainty, structural demand, and institutional order-flow behavior.
📆 Key Events to Watch
🔸 ADP Employment Data — Today at 01:15 UK Time
Weak ADP → bullish continuation toward sell zones
Strong ADP → liquidity sweep downward into buy areas
🔸 ISM Services PMI — Later Today
Contraction → strengthens rate-cut expectations
Expansion → stronger USD → intraday dip
🔸 PCE Inflation — December 5
The Fed’s preferred gauge
Soft PCE → pushes gold toward 4300+
Hot PCE → deeper retracement
🔸 FOMC Decision — December 9–10
Market expects 25 bp cut.
Hawkish → tests deeper discount zones
Dovish → breaks into new highs
🔸 Geopolitical Landscape
Any escalation = instant safe-haven spike
Calm USD strength = controlled pullback
🟩 GOLD TECHNICAL LEVELS
Gold continues to respect the rising structure, reacting precisely from discount zones and moving toward your institutional premium blocks. The impulsive bullish leg now positions price directly beneath the next major Smart Money Sell Area.
🟩 📌 SMART MONEY BUY ORDERS: 4147 – 4167
This is your primary institutional demand block, holding nearly $19 million in buy-side liquidity.
Expect:
✔️ First-tap reactions
✔️ Accumulation behavior
✔️ Discount long setups inside the broader bullish channel
A clean breakdown below 4147 opens liquidity toward 4108 → 4075.
🔺 📌 SMART MONEY SELL AREA: 4264 – 4284
This remains your high-probability distribution block, stacked with $29 million in sell-side orders.
Expect:
✔️ Manipulation wicks into premium
✔️ Stop-run behavior
✔️ Swing reversal setups
A break & hold above 4284 = continuation toward 4310 → 4325.
📌 Conclusion
Gold continues to rotate smoothly between institutional premium and discount zones, maintaining a strong bullish structure as long as 4147–4167 holds firm. With ADP data set to inject volatility, expect liquidity-driven movements rather than trend shifts. Stay patient, let the levels do the work, and execute only where smart money is active.
🙌 Support the Analysis
If this breakdown adds clarity to your trading, support with a like & comment it motivates deeper daily analysis.
Share your charts. Engage with the community.
Let’s grow together.
Best Regards,
M. MOIZ KHATTAK | Founder — TRADE WITH DECRYPTERS

XAUUSD: The upward trend remains intact; wait for entryGold remains in an overall uptrend, but bullish momentum is clearly weakening, making today a crucial session.
Whether prices can continue moving higher will largely depend on whether gold can hold the current pullback. If support holds, the next leg up is likely to be even stronger. If not, the market will likely slip into a choppy, range-bound pattern.
Over the past two weeks, markets have been heavily pricing in a Fed rate-cut narrative, and much of that expectation is now largely priced in.
At the same time, the nomination of a new Federal Reserve Chair has returned to the center of market attention. Regardless of who is selected, the candidate is widely expected to be dovish, or they would not have been nominated in the first place.
A dovish chair would inherently support rate cuts—a bullish factor for gold.
Therefore, even if gold experiences short-term pullbacks or weakening momentum, the broader bullish trend remains unchanged.
For today, the key price levels to watch are $4,180 and $4,200.
If price reaches these zones, they may offer actionable trading opportunities.

Gold Bullish Continuation or Pullback MoveXAU/USD is maintaining a strong bullish structure after recovering from the major demand zone area and pushing through multiple resistance levels. Price action shows a clean transition from accumulation to expansion, supported by an upside channel, indicating consistent buyer control.
After the liquidity sweep below the range, the market formed a rounded base and began creating higher highs along the curve line. Even though the curve line was briefly broken, buyers quickly regained momentum, driving price back into the buyer zone near 4,250. This zone remains a critical decision area; holding above it may trigger a continuation toward the upper supply zone and the immediate bullish target around 4,360.
If price rejects from the buyer zone, a corrective pullback toward 4,180–4,140 is possible before another attempt upward. However, as long as the higher-timeframe demand zone remains protected, the main bias stays bullish. Market structure, channel formation, and prior liquidity sweeps all support the likelihood of further upside continuation.

Gold H1 – Will 4278–4280 Trigger a Drop Into 4170 Today?🟡 XAUUSD – Intraday Smart Money Plan | by Ryan_TitanTrader (01/12)
📈 Market Context
Gold continues its impressive rally as markets price in a potential rate cut by the Federal Reserve (Fed) in December. Spot gold recently surged past $4,230/oz — hitting a multi-week high — as the US Dollar Index (DXY) weakened.
The backdrop is increasingly dovish: fading USD strength, soft U.S. macro data, and dovish comments from Fed officials have fueled speculative buying in gold.
Technically, gold remains elevated, hovering inside a rising channel — similar to what’s shown on your chart. Price compression following strong displacement suggests a consolidation before the next institutional move.
🔎 Technical Framework – Smart Money Structure (H1)
Current state = Accumulation / Distribution within rising channel
Liquidity zones & key triggers
• Premium liquidity zone (sell-opportunity): ~ 4278–4280 (near upper channel resistance) — aligns with your SELL zone.
• Discount liquidity zone (buy-origin / re-entry zone): ~ 4172–4170 (near lower channel support / trendline) — aligns with your BUY zone.
• Equilibrium / chop zone: mid-channel / recent consolidation zone — avoid trading blindly here unless structure breaks.
Expected Smart Money sequence
Sweep → CHoCH/MSS → BOS → Displacement → Retest (FVG/OB) → Expansion
Given the macro tailwinds (weak USD, rate-cut odds), gold remains primed for a directional move once structure confirms.
🎯 Trade Plans for Today
🔴 SELL GOLD 4278 – 4280 | SL 4288
• Thesis: A liquidity sweep at channel top / premium zone followed by engineered bearish displacement — capturing liquidity before a reversal.
• Entry rules (must wait for confirmation):
• Price touches 4280 zone
• Bearish CHoCH / MSS + BOS down on M5–M15
• Entry ideally on FVG fill or after order-block retest post-BOS
• Targets:
1. 4245 – 4240 area (first reaction)
2. 4225 – 4215 (mid-channel retest)
3. 4175 – 4172 (lower channel + buy zone)
🟢 BUY GOLD 4172 – 4170 | SL 4162
• Thesis: Discount-origin tap near lower channel support / trendline — smart money likely to accumulate for next leg up, especially amid dovish Fed sentiment.
• Entry rules (must wait for confirmation):
• Price dips into 4170 zone
• Bullish CHoCH / MSS + BOS up on M5–M15
• Strong bullish wick + FVG fill or OB retest confirmation
• Targets:
1. 4225 – 4230 (first reaction / mid-channel)
2. 4255 – 4265 (upper mid-channel)
3. 4278 – 4280+ (premium liquidity retest)
⚠️ Risk Management & Notes
• Avoid trading inside the mid-channel chop zone without structural confirmation — no “blind” entries.
• Do not treat sweeps (top or bottom) as trend entries — these are often traps.
• Use tight SL (structure invalidation), avoid averaging in consolidation.
• Given potential volatility from macro headlines or a USD bounce, consider reducing lot size.
Summary
Gold is currently riding macro tailwinds — weak USD + Fed rate-cut odds — but from a technical perspective, it’s compressed inside a rising channel. The day’s price action may be a classic Smart Money liquidity hunt: either a sweep at 4278–4280 leading to a sharp drop toward 4170, or a retracement to 4170 that sets up a fresh bull leg.
Only trade after structural confirmation (CHoCH / BOS + retest) — avoid “trend-hop” entries.
📍 Follow @Ryan_TitanTrader for daily Smart Money updates.

Gold 1H – Can 4265 Breakout or Trap Into 4185?🟡 XAUUSD – Intraday Smart Money Plan | by Ryan_TitanTrader (02/12)
📈 Market Context
Gold continues its impressive rally as markets price in a potential rate cut by the Federal Reserve in December. Spot gold recently surged — reflecting multi-week highs — as the US Dollar Index (DXY) weakened. The backdrop is increasingly dovish: fading USD strength and rate-cut odds have kept gold bid.
From a technical perspective, price sits compressed at the channel top, signaling liquidity plays before the next institutional leg. Macro tone from Powell’s opening remarks on ForexFactory adds volatility fuel.
🔎 Technical Framework – Smart Money Structure (H1)
Current state = Accumulation / Distribution within rising channel
Liquidity zones & key triggers
• Premium liquidity zone (sell-opportunity): ~4265–4267 (upper-edge pool of liquidity)
• Discount liquidity zone (buy-origin / re-entry zone): ~4186–4184 (demand liquidity near prior displacement base)
• Equilibrium / chop zone: mid-channel compression → no blind trading unless structure validates direction
Expected Smart Money sequence
Sweep → CHoCH/MSS → BOS → Displacement → FVG/OB Retest → Expansion
Gold remains primed for a directional move only after structure confirms intent.
🎯 Trade Plans for Today
🔴 SELL GOLD 4265 – 4267 | SL 4275
• Thesis: Liquidity sweep above equal highs at premium edge, followed by engineered bearish BOS confirming institutional selling intent.
• Entry rules (must wait for confirmation):
✔ Price pokes 4266 zone → bearish CHoCH/MSS + BOS down (M5–M15)
✔ Entry on FVG fill or OB retest after BOS validation
• Targets:
1. 4245 – 4240 (first reaction)
2. 4225 – 4215 (channel EQ retest)
3. 4186 – 4184 (full delivery into discount)
🟢 BUY GOLD 4186 – 4184 | SL 4176
• Thesis: Discount liquidity tap at institutional base, buy absorption after sweep + bullish BOS signaling new intraday demand.
• Entry rules (must wait for confirmation):
✔ Price sweeps 4185 → bullish CHoCH/MSS + BOS up (M5–M15)
✔ Entry on rejection wick + FVG fill or OB retest confirmation
• Targets:
4. 4215
5. 4240
6. 4265+
⚠️ Risk Management & Notes
• Avoid trading inside mid-range without CHoCH/BOS validation — sweeps are traps until proven by MSS + BOS.
• Use SL for structure invalidation only — no averaging in compression.
• Reduce lot size during Powell’s delivery window; macro impulses can run both sides of liquidity fast.
📍 Summary
Gold is coiling at highs for liquidity. Either Powell triggers a 4266 sweep → bearish BOS → delivery, or price hunts 4185 discount → bullish BOS → continuation.
Trade the structure, not the narrative — wait for CHoCH & BOS + retest to unlock expansion.
📌 Follow @Ryan_TitanTrader for daily Smart Money updates.
