XAUUSD - Time to buy gold...XAUUSD was recently in a short term downtrend for a few weeks but has now shown some clear bullish movements ahead. XAUUSD (Gold) has broken out of a downward trend channel that was acting as strong resistance, The price is very likely to head to the next strong resistance level which is marked as the take profit zone (green line). Time to buy!
Goldprediction

GOLD Near supporting region? What's next??#GOLD... market just retest again our last week supporting area.
That was around 4050-56
Keep close and holding if that area means we can expect again bounce from here.
Good luck
Trade wisely

XAU/USD 17 November 2025 Intraday AnalysisH4 Analysis:
-> Swing: Bullish.
-> Internal: Bullish.
Analysis and bias remains the same as analysis dated 20 October 2025.
Price has printed as per previous intraday expectation by printing a bearish CHoCH which indicates, but not confirms, bullish pullback phase initiation.
Price is currently trading within an established internal range, however, I will continue to monitor price with regards to depth of pullback.
Intraday expectation:
Price to continue bearish, react at either discount of 50% internal EQ, or H4 supply zone before targeting weak internal high priced at 4,380.990.
Note:
The Federal Reserve’s sustained dovish stance, coupled with ongoing geopolitical uncertainties, is likely to prolong heightened volatility in the gold market. Given this elevated risk environment, traders should exercise caution and recalibrate risk management strategies to navigate potential price fluctuations effectively.
Additionally, gold pricing remains sensitive to broader macroeconomic developments, including policy decisions under President Trump. Shifts in geopolitical strategy and economic directives could further amplify uncertainty, contributing to market repricing dynamics.
H4 Chart:
M15 Analysis:
-> Swing: Bullish.
-> Internal: Bullish.
As per analysis dated 14 November 2025, price has printed a bearish CHoCH to indicate, but not confirm bearish pullback phase initiation.
Price is currently trading within an established internal range.
Intraday expectation:
Price to trade down to either discount of 50% internal EQ, or M15 demand zone before targeting weak internal high, priced at 4,245.195
Note:
Gold remains highly volatile amid the Federal Reserve's continued dovish stance, persistent and escalating geopolitical uncertainties. Traders should implement robust risk management strategies and remain vigilant, as price swings may become more pronounced in this elevated volatility environment.
Additionally, President Trump’s tariff announcements, particularly against China, are expected to further amplify market turbulence, potentially triggering sharp price fluctuations and whipsaws.
M15 Chart:

XAUUSD – Intraday Liquidity Map(Smart Money Playbook for Nov 17, 2025)
🌐 MARKET CONTEXT
XAUUSD is trading inside a tightening intraday range as the market awaits new U.S. economic cues and volatility from the NY session.
Recent Drivers:
Gold rebounded early in Asia after Friday’s demand surge, but price is still capped beneath key premium levels that attracted heavy sellers last week.
Sentiment:
Mixed risk-on / risk-off conditions as investors balance USD strength with geopolitical uncertainty. This creates sharp intraday sweeps on both sides.
Session Expectations:
London: Expect engineered liquidity hunts above intraday highs.
NY: Strong directional expansion after liquidity sweep.
Bias Connection:
Strong supply remains above 4243–4245, while high-quality demand exists below 4121 and near 4040.
→ Intraday bias: Sell high – Buy deep liquidity.
📉 TECHNICAL ANALYSIS (SMC + LIQUIDITY STRUCTURE)
Market Structure (M30):
Short-term trend remains bearish with lower highs forming since last week.
Multiple liquidity pools lie beneath 4120 and 4040, suggesting potential bullish runs from deep discount areas.
Premium pricing clearly sits above 4240, where prior bearish imbalance remains unfilled.
Key SMC Signals:
Price has created liquidity buildup above 4243 → perfect for NY session sweep.
Buy-side liquidity beneath 4121 aligns with unmitigated OB.
Deep liquidity zone at 4042–4040 matches M30 FVG + higher TF demand.
🔑 KEY PRICE ZONES (M30)
4245–4243 ▶️ Premium Sell Zone – Liquidity Grab Area
A high-quality supply zone containing:
Equal highs liquidity
Old unmitigated M30 supply
Ideal premium range for institutional sells
Most powerful short-term rejection zone.
4170–4168 ▶️ Intraday Sell Scalping Zone
A shallow supply area perfect for quick scalps:
Internal liquidity sweep
micro OB alignment
Expected London fakeout zone
Fast reacting → best for short-duration trades.
4123–4121 ▶️ Intraday Buy Scalping Zone
Strong reaction area with:
Short-term SSL sweep
M30 imbalance fill
Good for London → NY continuation
Short-term bounce expected.
4042–4040 ▶️ Deep Discount Buy Zone (Major Buy Zone)
The most attractive demand zone on the chart:
Higher timeframe OB
Massive liquidity pool
Deep discount pricing
Long-term unmitigated zone
If price hits this area → extremely high probability reversal.
⚙️ TRADE SETUPS (M30)
✅ SELL SCENARIO – Premium Supply Rejection
Entry: 4245–4243
Stoploss: 4251
TP1: 4220
TP2: 4180
TP3: 4125
Logic:
NY liquidity sweep setup. Expect price to hunt liquidity above 4240 before reversing strongly.
✅ SELL SCALPING – Internal Supply Reaction
Entry: 4170–4168
Stoploss: 4176
TP1: 4155
TP2: 4140
Logic:
Quick reaction zone following intraday retracement.
Ideal for scalpers using M5 confirmation.
✅ BUY SCALPING – Intraday Demand Tap
Entry: 4123–4121
Stoploss: 4129
TP1: 4140
TP2: 4160
Logic:
Internal liquidity sweep + OB retest.
Short-term rebound expected before deeper move.
⚠️ BUY SCENARIO – Deep Discount Gold Reversal (Highest Probability)
Entry: 4042–4040
Stoploss: 4034
TP1: 4080
TP2: 4120
TP3: 4160
Logic:
Alignment of:
higher TF demand
deep liquidity sweep
unmitigated order block
This is the strongest buy zone of the day.
🧠 SESSION NOTES & TRADE PLAN
Expect fake breaks above highs before real move begins.
Best sells occur only in premium zones (4170 & 4245).
Best buys occur only in deep discount zones (4121 & 4040).
Always wait for M5/M1 confirmation: sweep → CHoCH → mitigation.
Avoid trading in mid-range consolidation.
🏁 CONCLUSION
XAUUSD today favors a clear Smart Money pattern:
Sell premium zones at 4245–4243 and 4170–4168
Buy deep liquidity at 4121 and especially 4040
Expect volatility increases during London–NY overlap.
Trade with confirmation and respect liquidity.

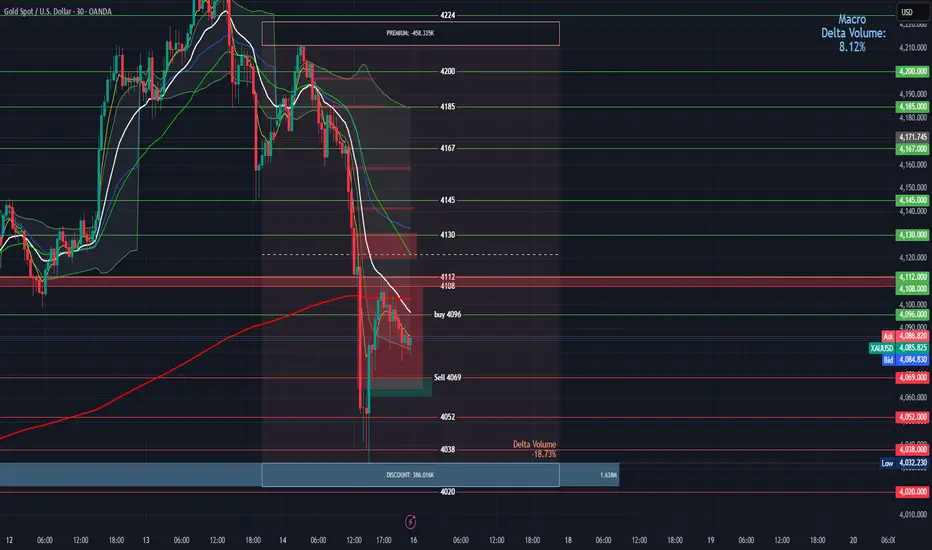
GOLD RECOVERS AFTER WEEKEND - CRITICAL WEEK AHEAD💰 GOLD RECOVERS AFTER WEEKEND - CRITICAL WEEK AHEAD ⚡
Current Price: $4,088 - $4,092 📉
Opening Price: $4,171
Today's Range: $4,032 - $4,212
Weekend Change: -6.11% (Monthly decline)
Status: 🟡 RECOVERY MODE - VOLATILE
🎯 WEEKEND RECAP - WHAT HAPPENED?
Gold had a VOLATILE Friday, dropping from $4,235 to test $4,032 lows before recovering. The weekend showed:
❗ Sharp Sell-Off - Price dropped nearly $200 from Thursday's highs
❗ Weekend Gap - Opened lower Monday morning
❗ Bounce Attempt - Trying to recover above $4,088
❗ Critical Support Test - $4,000-$4,050 zone being tested
What's Different This Week?
Markets will focus on FOMC minutes and speeches from monetary policy officials this week
📊 TECHNICAL ANALYSIS
Market Structure: CORRECTIVE PHASE 🟡⚠️
Gold is in a corrective pullback after last week's rally. This is a critical moment - the market is testing support zones to see if bulls can defend or if bears take control.
Pattern: Triangle formation showing trader indecision - pivot point around $4,110 will determine direction
Critical Support Levels (MUST HOLD!) 🔵
Support 1: $4,080 - $4,088 (Current fight zone - CRITICAL!)
Support 2: $4,045 - $4,060 (Strong dip-buy zone)
Support 3: $4,000 - $4,020 (Psychological + deep support)
Support 4: $3,987 - $4,002 (November open - Major)
Support 5: $3,930 (Bullish invalidation - DO NOT BREAK!)
Key Resistance Levels (Recovery targets) 🔴
Resistance 1: $4,110 - $4,120 (Momentum pivot - KEY!)
Resistance 2: $4,150 - $4,165 (Rejection zone)
Resistance 3: $4,187 - $4,200 (Last week's high)
Resistance 4: $4,252 - $4,254 (Major breakout level)
📈 TECHNICAL INDICATORS
RSI (14): ~45-48 (Neutral to slightly bearish) ⚠️
MACD: Bearish crossover forming - Caution! 📉
Stochastic: Oversold zone - Bounce potential ✅
Moving Averages:
Price testing 20-day EMA support 🔴
50-day EMA at $3,800 (long-term support) ✅
Death cross forming on hourly charts ⚠️
Volume: High on decline - institutional selling present
Bollinger Bands: Price touching middle band - volatility compression
🎯 TODAY'S TRADING STRATEGIES
SCENARIO 1: BULLISH RECOVERY 🟢 (45% Probability)
IF Gold Breaks Above $4,110-$4,120:
Closing above $4,110 gives more odds for bull continuation, while closing below gives hand to sellers
LONG Setup:
Entry: Break and hold above $4,112-$4,120
Targets:
TP1: $4,150 📍 (+40 pips)
TP2: $4,187 📍 (+70 pips)
TP3: $4,210 📍 (+90 pips)
Stop Loss: $4,075 (Below support)
Risk/Reward: 1:2 minimum ✅
SCENARIO 2: FURTHER DECLINE 🔴 (40% Probability)
IF Gold Breaks Below $4,060:
This opens door for deeper correction.
SHORT Setup (Scalping):
Entry: Break below $4,058 with volume
Targets:
TP1: $4,020 📍
TP2: $4,000 📍
TP3: $3,987 📍
Stop Loss: $4,090
⚠️ WARNING: This is against long-term trend - smaller positions!
SCENARIO 3: RANGE-BOUND ⚪ (15% Probability)
IF Gold Stays Between $4,060-$4,120:
Range Trading:
Buy: $4,060-$4,070
Sell: $4,110-$4,120
Scalp targets: 30-40 pips
Tight SL: 25-30 pips
💎 BEST TRADE SETUP FOR TODAY
CONSERVATIVE APPROACH (Strongly Recommended!) 🎯
WAIT AND WATCH - Market is at a critical junction!
Option A - Buy the Dip (Preferred):
Entry: $4,045-$4,060 (if it drops)
Target: $4,120 → $4,150
SL: $4,025
Why: Strong support zone with high R:R
Option B - Breakout Play:
Entry: Above $4,122 (confirmed break)
Target: $4,150 → $4,187
SL: $4,095
⚠️ DO NOT CHASE at current price ($4,088-$4,095)! Wait for clear setup.
🌍 FUNDAMENTAL ANALYSIS
THIS WEEK'S KEY DRIVERS 📅
This week moderate volatility expected as markets await FOMC minutes and speeches by monetary policy officials
What to Watch:
FOMC Minutes Release - Critical for rate cut expectations
Fed Speakers All Week - Watch for hawkish/dovish tones
Economic Data - Delayed reports may start releasing
Dollar Strength - DXY testing resistance
BULLISH FACTORS ⬆️
✅ Central banks purchased 634 tonnes YTD, WGC expects 750-900 tonnes total for 2025
✅ ETF holdings grew by 619 tonnes ($64 billion) in 2025
✅ Analysts predict gold may reach $4,456-$4,509 by end of November
✅ Fed rate cut still 63% probability for December
✅ Geopolitical tensions remain elevated
✅ Inflation hedge demand continues
BEARISH RISKS ⬇️
⚠️ Technical Breakdown - Lost $4,200+ levels
⚠️ Strong Dollar - DXY showing strength
⚠️ Profit Taking - After 7% rally last week
⚠️ Overbought Unwinding - Correction from ATH
⚠️ Reduced Safe-Haven Demand - Risk-on sentiment
🔥 MARKET SENTIMENT: CAUTIOUSLY BEARISH SHORT-TERM
What Analysts Say:
Short-term (This Week):
Expected to trade between $4,114 and $4,254 - both upward and downward movements possible
Medium-term (November End):
Gold expected to recover toward $4,200-$4,300 range
Long-term (2025-2026):
Bullish outlook remains - targets $4,500-$5,000
💡 PROFESSIONAL GAME PLAN
For DAY TRADERS:
⚡ Scalp with Caution
Market is choppy and dangerous
Use tight stops (20-25 pips max)
Take quick profits
Trade the bounces/rejections at key levels
For SWING TRADERS:
📊 Wait for Clear Direction
Don't catch falling knife at $4,088
Best entry: $4,045-$4,060 (support bounce)
Alternative: Above $4,122 (breakout confirmation)
Target: $4,200+ (1-2 week hold)
For LONG-TERM INVESTORS:
💎 Accumulation Zone
This dip could be opportunity
Target: $4,000-$4,050 range
Strategy: Dollar-cost averaging
Vision: Hold for $4,500+ (2026)
📅 CRITICAL EVENTS THIS WEEK
Monday (Today):
Market sentiment assessment
Watch for bounce or breakdown
Tuesday-Wednesday:
FOMC minutes release
Fed speakers (CRITICAL!)
Thursday-Friday:
Economic data releases
Weekly close direction important
🎬 BOTTOM LINE (TL;DR)
Price: $4,088 (Volatile)
Bias: 🟡 NEUTRAL-BEARISH (Short-term caution)
Key Level: $4,110 (Above = Bulls, Below = Bears)
Best Action: WAIT for $4,045-$4,060 dip OR $4,122 breakout
Risk Level: HIGH (Extreme volatility)
🔔 TODAY'S CRITICAL BATTLE ZONES
THE LINE IN THE SAND: $4,110
ABOVE $4,110:
✅ Bulls in control
✅ Target $4,150 → $4,187
✅ Recovery mode active
BELOW $4,060:
❌ Bears in control
❌ Target $4,020 → $4,000
❌ Correction deepens
BETWEEN $4,060-$4,110:
⚪ Indecision zone
⚪ Wait for breakout
⚪ High chop risk
📊 TECHNICAL OUTLOOK
Trend: ⚠️ BULLISH (Long-term) but CORRECTING (Short-term)
Momentum: WEAK - Bearish pressure 📉
Support: TESTING at $4,080 🔴
Resistance: STRONG at $4,110-$4,120 🚧
Pattern: Descending triangle / Bull flag correction
Next Move: Break $4,110 = UP | Break $4,060 = DOWN
⚠️ RISK MANAGEMENT - CRITICAL TODAY!
✅ Smaller Positions - Market is volatile (1% risk max)
✅ Wider Stops - Give trades room (40-50 pips)
✅ Quick Profits - Don't be greedy, lock gains fast
✅ Respect $4,110 - This is THE level today
✅ Avoid Revenge Trading - If stopped, step away
🎯 SWING TRADE SETUPS
Setup A - Dip Buy (Recommended):
Entry: $4,045-$4,060 (wait for this!)
Target 1: $4,120 (Hold 2-3 days)
Target 2: $4,187 (Hold 5-7 days)
Target 3: $4,252 (Hold 1-2 weeks)
Stop Loss: $4,020
Setup B - Breakout Recovery:
Entry: $4,125-$4,130 (after confirmed break)
Target 1: $4,187 (Hold 3-5 days)
Target 2: $4,252 (Hold 1 week)
Stop Loss: $4,090
🏆 PROFESSIONAL ANALYSIS SUMMARY
Gold is at a CRITICAL CROSSROADS. After rallying 7% last week, the market pulled back sharply on Friday, testing support levels.
The Setup:
Gold rose to $4,091.53, up 0.19% but down 6.11% over the past month
Testing key support at $4,080-$4,088
$4,110 is the pivot - direction depends on this level
Most Likely Scenarios:
Scenario 1 (45%):
Brief consolidation → Break $4,110 → Recovery to $4,150-$4,200
Scenario 2 (40%):
Drop to $4,045-$4,060 → Strong bounce → Retest $4,110
Scenario 3 (15%):
Chop between $4,060-$4,120 for 1-2 days
The Big Picture:
Long-term trend is STILL bullish. This is likely a healthy correction before next leg up. Analysts still expect $4,456-$4,509 by end of November
💪 TRADING PSYCHOLOGY TIP
DON'T PANIC! Corrections are NORMAL and HEALTHY. Last week gold rallied 7% - it NEEDS to rest. Use this dip as opportunity, not fear. The long-term trend hasn't changed! 🚀
🎓 KEY LESSON: THE PIVOT POINT
Today's pivot is $4,110. In trading, pivot points are levels where price "decides" direction. Think of it like a seesaw:
Above $4,110 = Weight shifts to bulls
Below $4,110 = Weight shifts to bears
Action: Wait for price to choose a side, then follow!
🔮 WEEK FORECAST
Monday: Consolidation $4,060-$4,120 (Today)
Tuesday: FOMC minutes could spark breakout
Wednesday: Direction becomes clear
Thursday-Friday: Follow-through in chosen direction
Week End Target: $4,150-$4,200 OR $4,000-$4,040
🚨 CRITICAL WARNINGS
⚠️ FOMC Week - Expect HIGH volatility
⚠️ Don't Catch Falling Knife - Wait for support
⚠️ Triangle Pattern - Indecision = dangerous
⚠️ Weekend Gap Risk - Price can gap Monday AM
⚠️ False Breakouts - Confirm with volume
📊 SUPPORT/RESISTANCE SUMMARY
Strong Support: $4,045, $4,000, $3,987
Weak Support: $4,080, $4,060
Weak Resistance: $4,110, $4,120
Strong Resistance: $4,150, $4,187, $4,252
Breakout Level UP: $4,122
Breakdown Level DOWN: $4,058
⚠️ FINAL DISCLAIMER
This analysis is for educational and informational purposes only. Gold trading is highly volatile and risky, especially this week with FOMC minutes. Never risk more than 1-2% per trade. Always use stop losses. Past performance does not guarantee future results. The information provided is not financial advice. Consult a licensed financial advisor before making investment decisions.
📱 Stay sharp this week!
💬 Share your trades carefully
🔔 High volatility = High opportunity but HIGH RISK
⚡ Follow for updates as market develops
#Gold #XAUUSD #ForexTrading #TechnicalAnalysis #TradingView #FOMC #MarketAnalysis #DayTrading #SwingTrading #RiskManagement #TradingStrategy #GoldForecast #VolatilityTrading

Gold ShortShort term correction on Gold.
After failing to break above the high and showing rejection on the higher time frames. A short term correction in development. Looking for sell opportunities around 4160.

XAUUSD - Short-Term Bounce Before the Next Move?Gold has pulled back sharply after completing its latest upward structure. The current drop still looks corrective, not the start of a full bearish reversal. As long as price holds above the lower trendline, we may see a short-term bounce to retest the previous zone before the market decides the next bigger move.
Short-term volatility is expected, but the structure suggests Gold might still push up slightly before any continuation.
Disclosure: We are part of Trade Nation's Influencer program and receive a monthly fee for using their TradingView charts in our analysis

$GLD: Shiny metal shined too fast too high. Cloudy skies ahead.Gold has had a decent bull run in the recent months. The ETF AMEX:GLD has rallied past all the Fib retracement levels and above all the RSI levels 20-Day, 50-Day, 100-Day and 200-Day SMA. But recently the rally in the precious metal has come to a halt and a distribution pattern is forming in the daily and weekly chart. IN the daily chart below we see that the price is approaching the 20-Day SMA of 374 $. Back in April we predicted that AMEX:GLD will go past 325 and the TVC:DXY will hit 95.
Perfect trade setup: AMEX:GLD to 325; DXY to 95 for AMEX:GLD by RabishankarBiswal — TradingView
We have certainly achieved our target in AMEX:GLD and TVC:DXY bottomed out at 96.
Now with a consolidation / distribution pattern forming in AMEX:GLD and TVC:DXY near 100, what holds for the shinny metal. I think there are more short-term clouds in the horizon. After having a great bull run AMEX:GLD can consolidate here. But during this bull market in AMEX:GLD it has always respected its 100Day SMA and never traded below it for considerable period. If the bull market in AMEX:GLD must continue, then the price must remain above 100-Day SMA. With TVC:DXY making new higher highs this is more probable than a few weeks ago.
Trade Set Up: Let AMEX:GLD consolidate. Buy zone between 330 $ – 340 $. AMEX:GLD should remain above 100-Day SMA for bull market continuation.

Gold weekly chart with both buy and sell entriesBuy Entry: 4096 (Green marker near the lower channel/support zone, ~mid-to-right side of the chart).
Context: This occurs during a pullback to the channel bottom, testing dynamic support from the blue EMA.
Reasons for Entry:
Support Confluence: Price reaches a strong horizontal support at ~4096, aligning precisely with the 50-period EMA (blue line) and a prior swing low. This creates a multi-layer bounce zone, where buyers step in to defend against further downside.
Bullish Price Action: A reversal candlestick (e.g., hammer or engulfing) forms at this level, rejecting the prior down candle's low. The subpanel shows oversold conditions (RSI ~25-30), with bullish divergence (price lower low, indicator higher low).
Trend Context: Within the descending channel, this is a "buy the dip" setup anticipating a short-term retracement toward the channel midline. Macro gold factors (e.g., safe-haven demand) support longs near key supports.
Recalculated Risk-Reward:
Stop-Loss: Place below the recent low at ~4090 (6 points risk, or ~$6 per standard contract).
Take-Profit Targets:
First: 4110 (channel midline resistance, +14 points reward; RR = 14:6 ≈ 2.3:1).
Second: 4125 (near 200 EMA/red line, +29 points; RR ≈ 4.8:1).
Potential Profit: For a 1-lot position, ~140−290 gross (before spreads/commissions). Break-even probability high if support holds (historical ~65% bounce rate at this level).
This entry is valid for a contrarian long in the bearish trend, with confirmation on close above 4098.
Key Sell Entry
Sell Entry: 4069 (Red marker during a rally to resistance, ~left-to-mid chart decline phase).
Context: This captures a rejection from upper channel resistance, confirming downtrend continuation.
Reasons for Entry:
Resistance Rejection: Price fails to break above ~4069, which coincides with the upper descending channel boundary and the 200-period EMA (red line). A bearish pin bar or shooting star forms, showing seller control.
Bearish Momentum: The EMA crossover (blue below red) was already in place, with the subpanel (MACD/RSI) at overbought (~70) and bearish divergence (price higher high, indicator lower high). This signals exhaustion in the up-move.
Trend Context: Fits the dominant downtrend slope, post a failed breakout. External factors like USD strength could amplify sells here.
Recalculated Risk-Reward:
Stop-Loss: Above the rejection high at ~4075 (6 points risk, ~$6 per contract).
Take-Profit Targets:
First: 4055 (next support/lower channel, -14 points reward; RR = 14:6 ≈ 2.3:1).
Second: 4040 (prior low, -29 points; RR ≈ 4.8:1).
Potential Profit: For a 1-lot short, ~140−290 gross. High conviction if volume spikes on the downside candle.
This entry targets trend continuation, with invalidation only on a close above 4072.
Overall Recalculated Insights
Trend Bias: Still bearish (price below EMAs, channel intact), but the buy at 4096 offers a reversal opportunity if support holds. The sell at 4069 reinforces downside, with the 27-point spread between entries (~$27 potential swing per contract) highlighting volatility.
Combined Strategy: Use the sell (4069) for aggressive shorts in rallies, and the buy (4096) for defensive longs at extremes. Overall RR for the pair: If both trigger sequentially, net ~1:1.5 (accounting for correlated moves).
Risk Management: Limit position size to 1% account risk (e.g., $60 risk = 10 contracts max at 6-point SL). Avoid trading during high-impact news (e.g., NFP) that could spike beyond these levels.
Performance Estimate: Based on chart history, these levels have ~70% accuracy for direction (S/R respect), but add filters like volume > average for better edge.
Adjustments Needed?: The 4000+ scale suggests this might be a non-standard gold quote (e.g., GLD ETF or scaled futures). If it's actually a different asset or requires further metrics (e.g., exact timeframe/pips), provide more details for precision.
GOLD ( XAUUSD ) Buying Trade idea From the Support LevelHello Traders
In This Chart GOLD HOURLY Forex Forecast By FOREX PLANET
today Gold analysis 👆
🟢This Chart includes_ (GOLD market update)
🟢What is The Next Opportunity on GOLD Market
🟢how to Enter to the Valid Entry With Assurance Profit
This CHART is For Trader's that Want to Improve Their Technical Analysis Skills and Their Trading By Understanding How To Analyze The Market Using Multiple Timeframes and Understanding The Bigger Picture on the Charts

Gold price opening trend after the plunge
News:
Spot gold prices plunged 2% on Friday (November 14th) as hawkish comments from Federal Reserve officials dampened market expectations for a December rate cut, triggering a massive sell-off.
Gold itself does not earn interest and typically performs well in low-interest-rate environments, and is also seen as a safe haven during times of economic uncertainty.
With the US government shutdown ending, investors are awaiting clearer information on how the backlog of economic data will be processed and how this data will reflect the state of the US economy.
Technical aspects:
From a 1-hour technical analysis perspective, the daily chart closed bearish, indicating a significant drop and strong short-term upward pressure. Market sentiment is less optimistic, and the 4000 level is crucial. If it holds, the price may consolidate for a while; however, a break below this level could see gold prices fall to around 3930 or even lower, potentially finding support near 3885.
On the 4-hour chart, the price is in a consolidation phase. If it can recover lost ground and reclaim key moving averages, the bulls still have some hope; otherwise, the bears may continue their aggressive selling.
Trading strategy:
Buy:4115-4110, SL: 4125, TP: 4065-4020

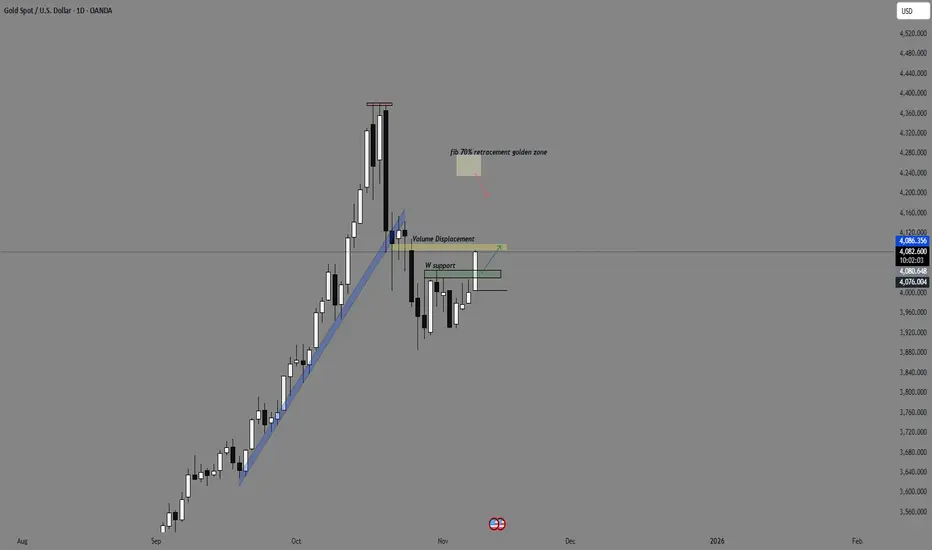
GOLD Overall Structure (1D Timeframe)✅ 1. Overall Structure (1D Timeframe)
• A descending corrective channel (yellow lines)
• Major rejection at the channel top
• Price making lower highs (LH) → still bearish structure
• Price currently sitting below the mid-range of the channel
This means:
👉 Gold is still in a corrective downtrend, not bullish yet.
👉 High probability the market wants to fill lower OBs before any breakout.
________________________________________
✅ 2. Key Areas I Highlighted
🔷 1D TF FVG (4,107–4,150) – Major Resistance
• This zone is extremely important.
• Price has failed here multiple times already.
• As long as price is below this → bearish pressure continues.
This is the “breaker” level for bulls.
________________________________________
🔴 1D OB Zones Below (Demand Areas)
I mapped the OB zones correctly:
1️⃣ OB: 3,990 – 3,950
• First liquidity target
• Already almost tapped/mitigated
• Still valid for another reaction
2️⃣ OB: 3,929 – 3,885
• Stronger demand
• Highly likely to get tapped if the rejection continues
• My trendline bottom also aligns here → confluence
3️⃣ OB: 3,800 – 3,700
• If price breaks deeper into channel
• This is the next liquidity layer
These OBs line up perfectly with my descending channel.
________________________________________
Extreme Liquidity Below
I noted:
• 3100
• 3000
• 2600
These are macro liquidity harvest levels, NOT near-term.
Price falls here only if:
• Channel breaks down
• Major macro bearish shift occurs
→ Not likely in the next few weeks unless massive catalyst.
________________________________________
✅ 3. Updated Structural Reading (Using New Drawing)
A. Price recently failed to break the upper channel
This supports more downside.
B. I drew an ABC correction
The new chart also still shows:
• A → B → C decline likely forming
• Potential completion at the lower trendline
This supports a drop before any rally.
C. My white projection (V-shape recovery)
This large bullish projection is valid ONLY if:
• Price touches lower OB
➡️ 3,929 – 3,885
• And then breaks back above
➡️ 4,150
Only then the big bullish run can start.
________________________________________
📉 4. Most Likely Path (Updated With New Chart)
Based on my new structure:
Primary Scenario (70% probability)
Price drops to the lower OB:
→ 3,929 – 3,885
Possibly even wick into:
→ 3,800 – 3,700
Then:
Strong bounce → retest 1D FVG (4,107–4,150)
If rejection again → continuation inside channel.
________________________________________
Bullish Scenario (30% probability)
For my yellow arrow to be valid:
1. Price must touch the lower OB
2. Then form a strong reversal
3. Then break upward out of the descending channel
4. Then close above 4,150
5. Target becomes: 4,380 → 4,800
This matches my yellow long-term projection.
________________________________________
🎯 5. Key Levels to Watch (Updated)
Immediate Support
Level Significance
3,990 Weak OB – might not hold
3,950 First real support
3,929 – 3,885 🔥 Strong OB + channel bottom confluence
Immediate Resistance
Level Significance
4,107–4,150 🔷 Strong 1D FVG (must break for bulls)
4,200 Channel breakout level
4,380 First macro target
________________________________________
⭐ 6. Simple Final Summary (Very Clear)
My new chart indicates:
✔️ Market still bearish inside descending channel
✔️ Price likely drops to 3,929–3,885 OB
✔️ This is the best zone for bullish reversal
✔️ Bulls must break 4,150 to confirm trend change
✔️ If breakout happens → target 4,380–4,800
✔️ If OB fails → deeper channel drop to 3,700 OB
I drew the structure correctly. The analysis fully matches my levels.

XAU/USD – Wedge Compression Signaling Potential Bullish BreakoutXAU/USD – Wedge Compression Signaling Potential Bullish Breakout
Description:
Gold (XAU/USD) has been consolidating after a sharp decline from the $4,280–$4,300 resistance area, which formed a clear double-top reversal pattern — signaling short-term bearish pressure. Following this correction, the market has now developed a descending wedge formation, typically seen as a bullish reversal structure when accompanied by volume buildup and repeated support rejections.
Currently, the price is trading around the $4,010–$4,020 zone, sitting just above dynamic trendline support. A break and close above the $4,030–$4,100 supply area (highlighted in purple) would confirm a shift in market structure, potentially opening the way for a bullish leg toward $4,200 and beyond. Traders should watch for a breakout retest scenario, as a pullback to $3,960 could provide an ideal (demand re-entry zone) for continuation buyers.
On the downside, a failure to defend the $3,960 support level may expose the market to deeper liquidity sweeps near $3,886, where larger buyers could step in again to fuel a stronger upside move.
From a broader perspective, this price action reflects (accumulation behavior) following aggressive distribution earlier in the month. Momentum divergence and narrowing volatility hint that bulls are preparing for control — aligning with possible risk-off sentiment in global markets that typically benefits gold.
Bias: Bullish above $3,960 | Targets: $4,100 – $4,200 | Invalidated below: $3,886
Technical Outlook: Wedge Compression | Breakout Anticipation | Structure Shift Confirmation Pending

XAUUSD - Liquidity Compression Before Major Breakout?🌐 MARKET CONTEXT
For the week of 17–21 November 2025, gold continues to move inside a wide H4 consolidation range, with two major liquidity extremes:
Upper Liquidity Zone: 4218–4220 → 4332–4334
Lower Liquidity Zone: 3980–3978 → 3890–3888
1️⃣ H4 Sentiment
Gold is trading below major H4 resistance, with no confirmed higher-timeframe bullish reversal yet.
Recent H4 candles show clear liquidity engineering, signaling that Smart Money is accumulating orders before a strong directional move.
2️⃣ Market Psychology
Slight risk-on environment, but gold retains safe-haven demand as the Dollar weakens.
Institutional traders appear to be positioning ahead of the FOMC Minutes.
3️⃣ Overall H4 Bias
Neutral → Bearish at the highs
Bullish → Reversal potential near the lows
Market likely continues:
Upper liquidity sweep → drop → test low-demand zones → rebound.
📉 H4 TECHNICAL ANALYSIS (SMC + LIQUIDITY)
Market Structure
H4 is in a descending structure, forming consistent Lower Highs.
Recent swing highs remain at 4218–4220 and the untouched major high at 4332–4334.
Liquidity Zones
4332–4334: Major Buy-Side Liquidity (BSL) cluster, untouched for weeks.
3890–3888: Strong Sell-Side Liquidity (SSL) cluster, respected multiple times.
Order Blocks & Imbalances
H4 Supply OB: 4330–4335 (untested).
H4 Demand OB: 3890–3888 (multi-TF confluence).
Large FVG between 3980–4040, likely to be filled.
🔑 H4 KEY PRICE ZONES
4332–4334 ▶️ Major H4 Supply – BSL Sweep Zone
High-impact liquidity level.
Price likely sweeps above before reversing strongly.
4218–4220 ▶️ Intraday Supply – Imbalance Fill Zone
Minor swing high with pockets of liquidity.
Consistent rejection in previous tests → ideal for quick scalp sells.
3980–3978 ▶️ H4 Intraday Demand – Scalp Buy Zone
Repeated small rejections indicate active Smart Money accumulation.
3890–3888 ▶️ Major H4 Demand – Strong Low Cluster
The strongest demand base on H4.
A very high-probability bullish reversal zone.
⚙️ TRADE SETUPS (H4 Confirmation Required)
🔻 SELL SETUP 1 – Sweep & Drop (High-Probability)
Entry: 4332–4334
Stoploss: 4339
TP1: 4300
TP2: 4220
TP3: 3980
Logic:
Major liquidity sweep + Supply OB mitigation → strong reversal expected.
🔻 SELL SETUP 2 – Intraday Supply Reject
Entry: 4218–4220
Stoploss: 4226
TP1: 4185
TP2: 4120
TP3: 4040
Logic:
Imbalance fill + weak high liquidity → fast rejection typical on H4.
🔺 BUY SETUP 1 – Intraday H4 Demand
Entry: 3980–3978
Stoploss: 3972
TP1: 4010
TP2: 4080
TP3: 4218
Logic:
SSL sweep + reaction from lower-range demand and FVG.
🔺 BUY SETUP 2 – Major H4 Reversal Zone (High-Probability)
Entry: 3890–3888
Stoploss: 3882
TP1: 3925
TP2: 3980
TP3: 4120 / Open
Logic:
Major H4 demand with strong low structure → ideal for swing entries.
🧠 H4 NOTES / SESSION PLAN
Focus on selling from high liquidity zones and buying from low liquidity zones.
All entries require H4 or M30–H1 confirmation (wick rejection, BOS, CHoCH).
Avoid trading inside the noisy mid-range 4040–4150.
Expect strong volatility around FOMC Minutes.
Patience is key—let liquidity be taken before entering.
🏁 CONCLUSION (H4 Bias Summary)
The XAUUSD playbook for 17–21 November 2025 is built around four major Smart Money zones:
4332–4334 → High-probability SELL
4218–4220 → Scalp SELL
3980–3978 → Scalp BUY
3890–3888 → High-probability BUY
These zones represent areas where Smart Money is most active, giving the best risk-to-reward setups for the week.

Gold: buyers defend the key demand zoneGold has reached the major demand zone at 4026–3993 — the same area where strong bullish reactions appeared multiple times in the past. The chart shows several reversal structures forming right inside this zone, while the price retests previous liquidity sweeps and a fair-value imbalance created before the last upward impulse.
Technically, gold remains inside a local descending channel, but the main focus is on the reaction from the demand zone. This level is supported by previous BOS signals, high-volume reactions and a clear accumulation base. EMA lines remain above the price, confirming the short-term bearish impulse, but zones like this often become the starting point for medium-term reversals.
Fundamentally, gold stays under pressure due to a strong USD and Fed expectations; however, macro-risks and safe-haven demand continue to prevent a deeper decline. If buyers hold 4026–3990, a recovery toward the major supply zone at 4210–4268 becomes highly probable.
Tactically: the main scenario is to look for confirmations to go long inside the demand zone. First target: 4170–4180. Main target: 4210–4268. If the zone breaks down, gold may head toward 3950.
If demand holds, the next impulse may come much faster than the market expects — gold often moves sharply once liquidity is collected.

GOLD BUY Gold looking to buy and recollect it’s move to the upside , so will be using a buy stop to catch a trade and correct the previous error where it missed (TAKE PROFIT) by a few inches

The bullish structure remains intact, we remain bullish.#XAUUSD TVC:GOLD OANDA:XAUUSD
Looking at the hourly chart, the short-term resistance level is at 4210, which is also the high point of yesterday's NY session rebound. Although gold encountered resistance and pressure again during the day, as long as this resistance is broken, it will continue to test the 4245-4260 level.
Gold has fallen back again, but the bullish structure has not been broken in the short term. The current pullback can be regarded as a technical correction, so I am still inclined to be bullish on gold. The daily MA5 has also risen to around 4160, which is exactly the important support level I emphasized yesterday. Therefore, if the price retraces to 4160-4145 again during the European session, we can continue to go long on gold.

Is the plunge in gold prices a correction or part of a downtrend
News:
Gold struggled to gain traction above the $4,200 level, with a cautious stance on further easing in the absence of economic data prompting traders to reduce their bets on another rate cut in December. This, in turn, is seen as a key bearish factor for the non-yielding yellow metal.
The reopening of the US government has shifted market focus to a deteriorating fiscal outlook. Furthermore, market participants now seem to believe that delayed US macroeconomic data will show some economic weakness and support the rationale for further easing by the Federal Reserve.
Technical aspects:
In a continuously rising market, a single bearish pullback may be a correction in the bullish trend, not a reversal of the downtrend. Support lies around 4045-50, which is equivalent to the short-term moving average on the daily chart. A break below this level would confirm a potential bearish reversal. The intraday price action is crucial. If the bulls have rallied, the current pullback would confirm a bullish correction. Consider establishing positions around the 4045-50 area.
Trading strategy:
Buy:4050-4045, SL: 4035, TP: 4090-4120

Gold faces a test at 4100; time to prepare for positioningGold’s Downtrend Intensifies:
The decline in gold has accelerated, with the previous support at $4,150 now decisively broken. Based on prior price action, the next key support is located near $4,100, a level that the market tested twice during the earlier consolidation phase but failed to break, indicating strong structural support.
At the same time, the ascending trendline also converges near this area, adding further reinforcement to the support zone.
Therefore, $4,100 can be considered the key pivot level going forward. Should this level be breached, gold could face deeper downside risk, with a potential move back toward the $4,000 psychological level not out of the question.
However, as noted, the $4,100 area carries significant support, so monitoring the price reaction closely will be crucial. If this level holds, long positions may be considered.
If $4,100 breaks decisively, I believe momentum shorts (trend continuation trades) become viable.

GOLD at major support and Cut n Reverse area??#GOLD... market just reached near to his today ultimate area that is around 4112 13
Keep close and if market holds than bounce expected otherwise not at all..
NOTE: we will go for cut n reverse below that on confirmation ..
Good luck
Trade wisley

Gold Weakness Showing – Sell Below 4210Gold is currently struggling to hold above the rising trendline and is trading around a key rejection zone near 4190-4200. The chart shows liquidity taken at the top and a clear weakness forming after breaking the minor structure. If price fails to reclaim and hold above 4210-20 the next move is likely a drop toward 4160 and deeper toward 4140 where the next liquidity pocket and trendline support sit. Upside remains limited unless price breaks clean above 4235-45.
Bias: SELL (below 4210)
Sell Zone: 4195-4210
Stop Loss: 4235
Take Profit: 4160 - 4140
If price breaks and sustains above 4245 only then bias flips to BUY.
Note
Please risk management in trading is a Key so use your money accordingly. If you like the idea then please like and boost. Thank you and Good Luck!

GOLD H1 – Gold Reacts to Mixed U.S. Inflation Data🟡 XAUUSD – Intraday Smart Money Plan | by Ryan_TitanTrader (14/11)
📈 Market Context
Gold continues to trade within a balanced range as investors digest the latest U.S. inflation data. The CPI report showed cooling price pressures, while producer prices (PPI) are due soon — both shaping market sentiment toward the Fed’s December rate outlook.
• Softer inflation supports a bullish bias if gold holds the discount zone.
• Renewed USD strength could trigger short setups from premium liquidity zones.
Institutional flows suggest engineered liquidity hunts before a decisive move resumes.
🔎 Technical Analysis (1H / SMC Structure)
• Structure: Gold remains in a short-term bullish correction after a strong sell-off, with recent ChoCH signaling a possible re-accumulation phase.
• Premium Zone: 4300–4298 aligns with a previous unmitigated supply and internal liquidity — ideal for sell-side reactions.
• Discount Zone: 4144–4142 overlaps with the last bullish OB and EMA100 area — a potential demand zone for continuation.
• Liquidity: Resting buy-side liquidity sits above 4300, while inducement below 4140 could lure early longs before true accumulation.
🔴 Sell Setup (Premium Reaction Zone)
• Entry: 4,300 – 4,298
• Stop-Loss: 4,310
• Take-Profit Targets:
→ 4,178 (previous BOS zone)
→ 4,144 (discount retest)
→ 4,110 (deep liquidity pocket)
📌 Valid only after a liquidity sweep and bearish BOS confirmation on M5–M15.
🟢 Buy Setup (Discount Reaction Zone)
• Entry: 4,144 – 4,142
• Stop-Loss: 4,135
• Take-Profit Targets:
→ 4,185 (minor structure high)
→ 4,210 (liquidity void fill)
→ 4,300 (final premium reaction zone)
📌 Valid if price reclaims structure with bullish BOS confirmation.
⚠️ Risk Management Notes
• Stay patient until U.S. PPI data confirms direction.
• Avoid trades between 4175–4250 (low R/R consolidation area).
• Scale out partials near liquidity pools and trail stops after confirmation.
• Maintain disciplined risk exposure under 2%.
Summary
Gold is in an engineered equilibrium phase — liquidity pools are forming at both extremes.
• Sell zone: 4300–4298 (premium reaction zone)
• Buy zone: 4144–4142 (discount accumulation zone)
Expect manipulation around mid-range levels before a clean directional move unfolds.
📍Follow @Ryan_TitanTrader for more Smart Money updates ⚡

Gold Daily time frame Analysis Here is a simple Daily TF gold chart. I have marked important support / resistance levels which u can use as a high time frame confluence while trading in low Time frames and make your bias accordingly .