Gold rises. Latest analysis.Key Points:
With the federal government shutdown, Trump's consideration of firing federal employees has dampened risk appetite. The White House said the layoffs will begin soon, and Trump plans to meet with White House budget director Russell Vought to discuss the cuts.
The government shutdown has halted the release of US economic data, and Fed officials' speeches have become a substitute for data, with every statement being over-interpreted by the market.
The non-farm payroll data failed to be released as scheduled, marking the first time since 2013 that a government shutdown has delayed the release of key data, further increasing market uncertainty about the economic situation and Fed policy.
Market Analysis:
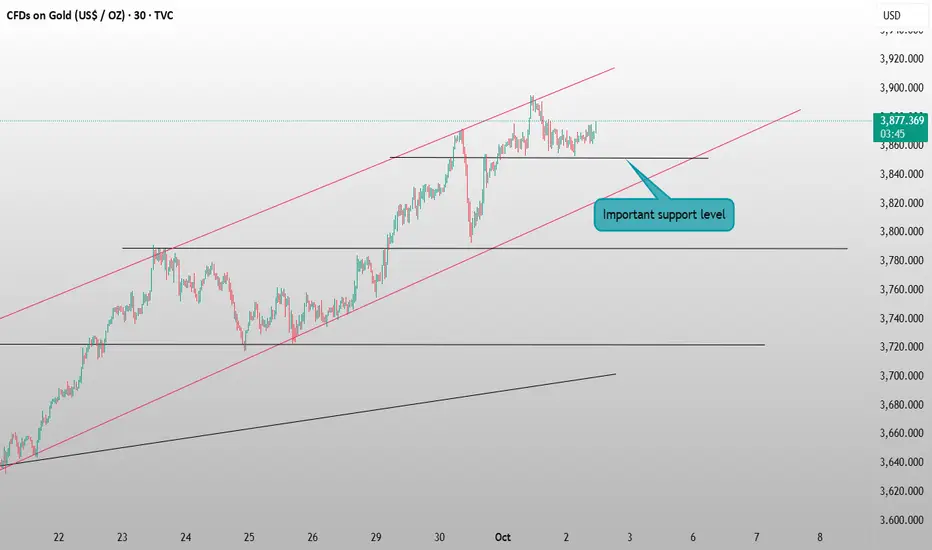
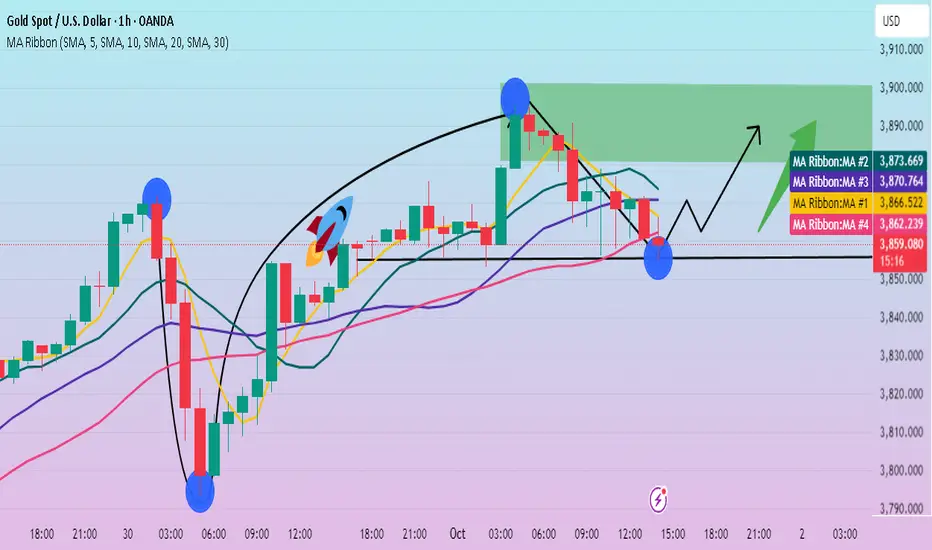
Although gold prices retreated during the European session, the factors supporting the long-term uptrend remain intact. From the 4-hour chart, the current important support level is at the 38603865 area where the MA5, 10 and 20 moving averages intersect. Although the RSI14 period indicator fell slightly, it still remained above the midline. Judging by the indicator data, any dip in price is likely to be bought quickly.
Due to the data blank period on Friday, the price is likely to remain volatile at a high level today. Quaid recommends that you wait and see for a short period of time. Consider a small long position if the price pulls back to around 3860.
Goldpreis

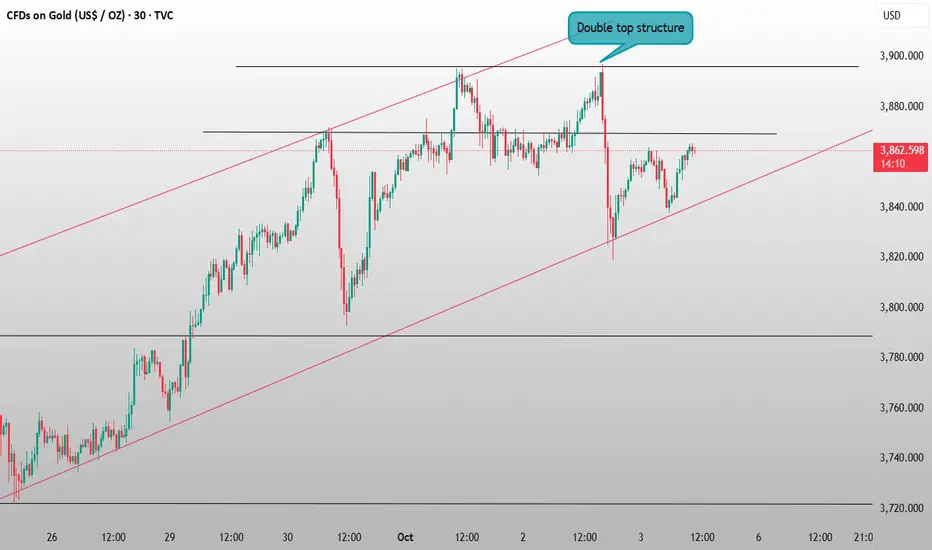
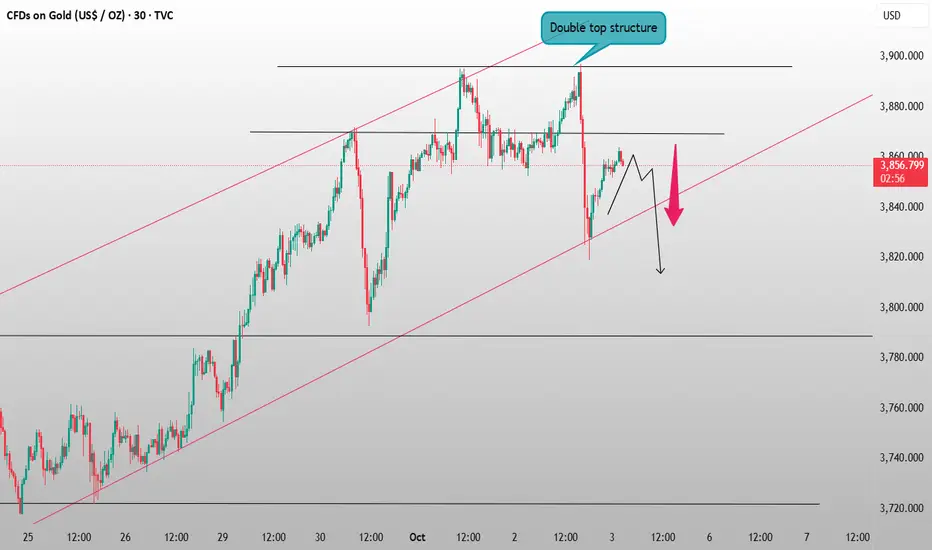
Gold adjustment is not over yet, continue to short at highsGold continued to fluctuate in today's Asian session, failing to initiate a strong rebound and instead fluctuating weakly. This suggests that gold's short-term correction has not concluded and may continue. Today's non-farm payroll report may be delayed, so without supporting data, short-term volatility is likely to continue.
Gold's 1-hour moving average has begun to turn upward, forming a double top pattern. Short-term bulls have yet to re-establish themselves at the gold neckline, indicating continued weakness. Gold rebounded several times but still failed to break through the pressure of 3865. Gold near 3865 in the European session is an opportunity to short on rallies.
Resistance levels: 3865, 3878
Support levels: 3843, 3828
For specific trading decisions, please follow my live updates. I will update my trading ideas and strategies daily. If you lack a gold trading plan or strategy and are struggling to achieve consistent and stable profits, you can refer to and follow my updates for guidance and help avoid mistakes.
Non-farm payrolls delayed? Here's the analysis.Due to the government shutdown, the U.S. Bureau of Labor Statistics is not expected to release the non-farm payrolls report on Friday. However, several recent private sector indicators suggest weak hiring, limited layoffs, modest wage growth, and easing labor demand in September. This data generally aligns with the low hiring and low layoff trends observed before the government data release was suspended.
Even without the non-farm payrolls report, the market can still get a general sense of the labor market situation, allowing the Fed to confidently proceed with a rate cut later this month.
At the same time, combined with the MACD indicator, the downward cross formed far above the zero axis indicates that the upward momentum has weakened and the price is in a correction phase. In the short term, watch for signs of slowing in the decline; if the correction breaks below 3793, the trend could quickly shift to a downtrend.
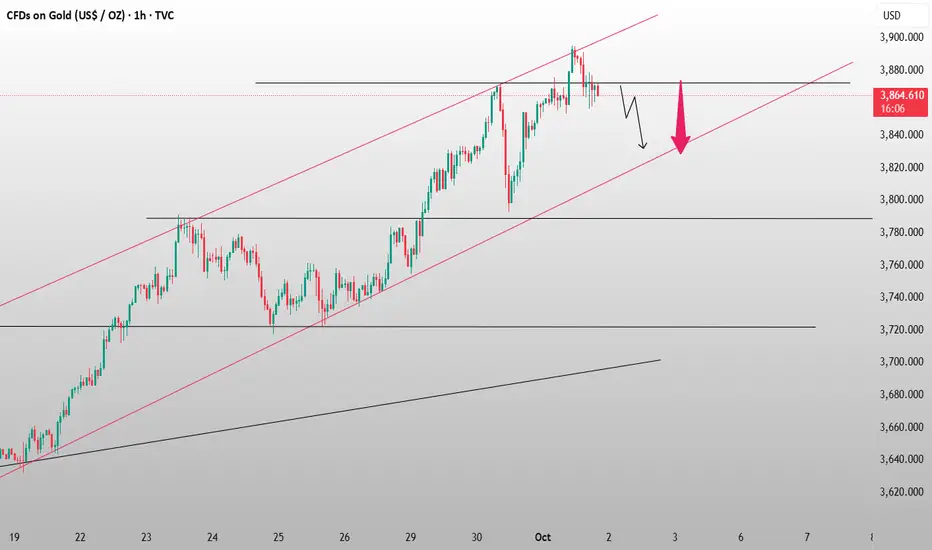
Looking at the 1-hour level, with the sharp drop on Thursday, the overall trend is moving down from high to low and creating a new low, indicating that the 1-hour level trend has begun to fall. Short-term support is at the 3860-3865 area, which has been a significant resistance level for gold.
If the price cannot break through 3865 strongly, it will still usher in a trend of correction. At the same time, we should pay close attention to whether the non-farm data can be released as scheduled.
Before the non-farm payroll data release, if the price corrects to around 3830, consider a small long position, waiting for the data release.

Gold Stalls? A Deep Dive Analysis.Key Points:
Why Gold Rallied: Gold has been one of the strongest-performing commodities recently, driven by continued central bank buying and expectations of further Fed rate cuts.
Why Gold Fell: Lori Logan's call for caution on further rate cuts weighed on gold. Markets are cautious about whether the Fed will take more aggressive easing measures at its next meeting.
The government shutdown entered its second day, potentially delaying the release of key economic data, including the non-farm payrolls (NFP) report scheduled for Friday. The weekly initial jobless claims report, which was supposed to be released on Thursday, also failed to be released as scheduled.
Market Analysis:
Gold's current performance is significantly influenced by news. While the medium- to long-term upward trend remains unchanged, short-term bullish and bearish swings are often volatile, with significant fluctuations. Therefore, timely adjustments to market conditions are necessary.
The 1-hour chart shows that the short-term pressure is around 3860-3865. Only by breaking through and stabilizing above this position will there be momentum to continue to attack higher points. If this level is unable to hold, gold could fall further to test the key support at 3820. During the Asian session, traders should focus on 3865 as a key level for determining the direction of the market.
Trading Strategy:
Short at 3865, stop loss at 3875, target range 3845-3820.

The adjustment is not over yet, continue to short on reboundYesterday, as expected, gold continued its upward trend before retreating, closing with a bearish candlestick pattern with upper and lower shadows. Over the past few days, the market has consistently shown a pattern of prices initially falling from a high before reaching a new high and then plummeting, or initially reaching a low and then breaking a new low before rebounding.
As shown in the above chart, downward support remains strong. Yesterday, after testing the lower limit of the rising trendline, the price began to rebound and is currently testing resistance at the middle limit of the hourly boll line. Today will see the non-farm payroll data. Due to the US government shutdown, there's still uncertainty about whether it will be released, and yesterday's initial jobless claims were also delayed. Regardless of whether the data is released tonight, technically, we can consider the 3895-3820 range.
Trading Recommendation: Short near yesterday's high, long near yesterday's low. Watch for a break of the 3868-3852 range in the Asian session.
Resistance: 3862, 3868, 3885
Support: 3852, 3843, 3828
For specific trading decisions, please follow my live updates. I will update my trading ideas and strategies daily. If you don't have a plan or idea for gold trading and can't achieve consistent and stable profits, you can refer to and follow my updates as a reference and guide to help you avoid mistakes.
Gold rebounds? Latest analysis here.Gold faced resistance and declined around the $3900 level, with significant downward pressure, confirming strong support at the 5-day moving average (3830-3820). The daily trend has been consistent this week, with the market repeatedly testing and finding support at the 5-day moving average. If this pattern continues, gold is likely to test the 10-day moving average on Friday, potentially stabilizing and consolidating around that level.
If the 10-day moving average is broken, the price is likely to fall further, approaching the middle Bollinger Band.
The 1-hour chart shows that the resistance zone of 3855-3890 has been broken to the downside, with 3855 now acting as short-term resistance. On Friday, during the Asian session, the price is likely to initially test 3860, potentially triggering further declines. However, if the 1-hour chart breaks above this level and sustains upward movement, adjust your trading strategy accordingly. If the downward trend continues, key support levels to watch are 3800-3790.

You can buy short orders on reboundWe began warning this morning that gold is about to start fluctuating. Shorting at short-term rebound highs is recommended. We've already achieved good returns by going short directly in the European session.
Gold's 1-hour chart shows the formation of a double top. It has now fallen below 3853 and is testing the initial support level of the uptrend. If this level is broken, it will fall further and test the support levels of 3810-3800. Continue shorting during a rebound in the New York market.
Resistance levels: 3853, 3972
Support levels: 3824, 3812
For specific trading decisions, please follow my live updates. I will update my trading ideas and strategies daily. If you don't have a plan or strategy for gold trading and are struggling to achieve consistent profits, you can refer to and follow my updates for guidance and help you avoid mistakes.

Gold breaks below support. Is a bottom in sight?The US government shutdown delayed the release of several key economic data, including Friday's non-farm payrolls report, leading to the ADP report on Wednesday having a greater impact on the US bond market than usual. Market analysts believe that if the prolonged shutdown harms the economy, the government shutdown itself could further fuel market expectations of lower interest rates. The ISM data released on Wednesday also reinforced the impression of a weakening US economy. Most market participants now expect the Fed to cut interest rates by 25 basis points this month, with a probability exceeding 90%.
Gold traded in a narrow range on Thursday, reaching a high near $3897 before pulling back, indicating strong resistance above. The breakdown below the recent high suggests that gold may continue to decline.
In summary, Quaid believes that after a recent rally, gold is now facing selling pressure. For short-term trading, consider selling on rallies, with key resistance at $3850-3855 and support at $3820-3810.
Trading Strategy:
Sell at $3850-3860, stop loss at $3870, target $3830-3810;
Buy at $3815, stop loss at $3805, target $3840-3850.

Gold → May rise and then fallToday's day is in a state of slow upward fluctuation, but the short-term bullish performance is not strong. Yesterday's daily line closed with an inverted line. Today, we can see a decline based on the high point of 3895. In the New York market, gold may rise and then fall. The support below is 3862-3852, and the strong support is 3828 to see the rise! If it unexpectedly breaks above 3895, consider going long with a small position!
Resistance levels: 3895, 3925
Support levels: 3853, 3828
For specific trading decisions, please follow my live updates. I update my trading ideas and strategies daily. If you don't have a plan or strategy for gold trading and are struggling to achieve consistent profits, you can refer to and follow my updates for guidance and help avoid mistakes.

Gold → Oscillating pattern, short at high levelGold prices hit a record high of 3895 yesterday before retreating. Unlike previous declines, yesterday's retreat didn't offer the same swift rebound as before. As prices gradually climbed, nearing $600, a divergence in funds among bulls began to emerge. Some investors began to take profits, leading to short-term profit-taking and a short-term correction.
Regarding today's market trends, in the short term, we should keep an eye on support at 3853, a key support point mentioned yesterday. At this time, we should look at it from the perspective of strong fluctuations. That is, the possibility of breaking the high again is not high, so we should arrange the layout around the fluctuation range of 3895~3828. As further breaks above this high are unlikely, we should prioritize range-bound trading between 3895 and 3828.
Resistance levels: 3882, 3895
Support levels: 3853, 3828
For specific trading decisions, please follow my live updates. I will update my trading ideas and strategies daily. If you don’t have a plan or idea about gold trading and cannot achieve sustained and stable profits, you can refer to and follow my updated content as a reference and guidance to help you avoid mistakes.
Waiting for a trend? A continued rise?In early Asian trading on Wednesday, prices rallied before retracing several times, providing continuous confirmation of bullish entry opportunities. Prices surged sharply around the European session, accelerating past the highs and encountering short-term resistance below the 3900 mark. The US ADP data, released below previous expectations, failed to drive price gains, suggesting the market may test support levels in the short term.
Gold prices are currently fluctuating around 3865. Bulls are focusing on $3850, which has become effective support. Go long immediately upon reaching this target. If prices successfully rise from around 3850 and stabilize above 3875, bulls will likely continue their push towards the 3900 mark on Thursday. Conversely, if prices fail to hold above this level, prices are likely to develop a shoulder-top pattern and experience a short-term correction.
Trading strategy:
Go long in the 3850-3855 area, with a stop-loss at 3840 and a profit target at 3875. Break through 3875 and stabilize in the European session, then go back to 3870 to cover the position, with the profit target at 3900.

Pay attention to 3853, and sell short when the price goes high.Currently, gold is fluctuating and adjusting around 3870-72. We have made good profits by shorting gold at 3891. We have already notified the market to lock in profits a few hours ago. From the trend, we can see that the bullish momentum has weakened significantly. At this stage, we just need to wait patiently for gold to break through the support line of 3853.
Resistance: 3875, 3893
Support: 3853, 3828
Gold continues to make new highs. Watch for key support levels.With the government shutdown, data collection and reporting by federal agencies may be delayed or suspended. Therefore, employment and inflation reports scheduled for release in the coming days may not be published, creating uncertainty and fueling a flight to safety.
Since the start of this week, gold has essentially set new all-time highs almost daily. While there have been significant pullbacks, they have been short-lived, and gold has rebounded to new highs. The surge in gold suggests that pullbacks are merely opportunities to buy.
On the 1-hour chart, after reaching its all-time high of 3895, gold's momentum has slowed. The moving average system is flattening out, and after several attempts to break below support, gold has rebounded. In the short term, there is strong support below, with the lowest point reached at 3856. As long as gold doesn't break below 3856, it is likely to continue its strong upward trend.
Trading Strategy:
Buy at 3855, stop loss at 3845, target profit range: 3880-3890-3900.
Fear-driven pullback? Still strong.From a daily chart perspective, gold is currently in a very strong uptrend. The price has been steadily rising, supported by the 5-day moving average, and has seen four consecutive days of gains. Wednesday is expected to see further upward momentum.
The Bollinger Bands are widening upwards, and the moving average system is perfectly aligned in an uptrend, confirming the strength of the upward trend. The key support level is around 3820. As long as the price doesn't break below this level, the strong uptrend will likely continue. Therefore, the trading strategy should remain focused on buying on dips.
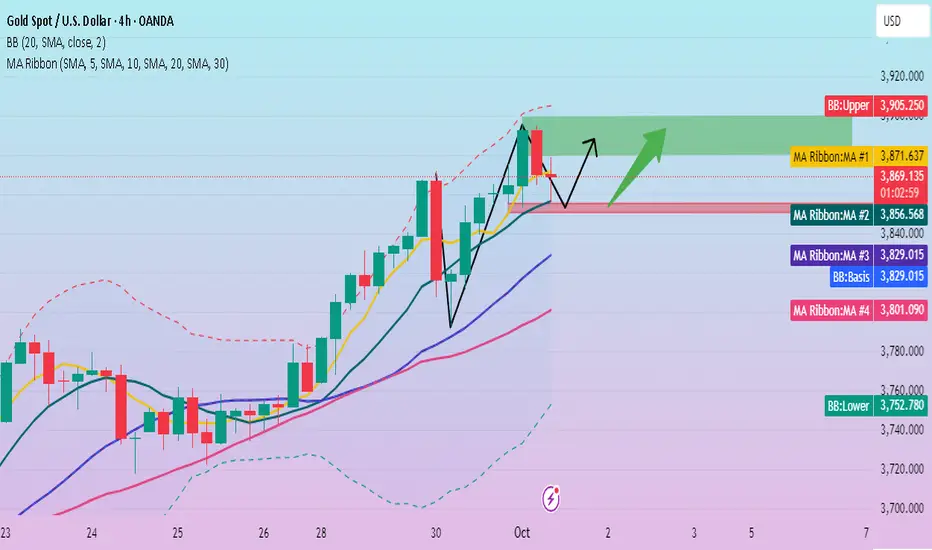
The 4-hour chart shows that while there was a significant pullback on Tuesday, the price did not break below the middle Bollinger Band. Following this, a strong rebound quickly recovered the losses and reached a new high, indicating that the previous decline was merely a technical correction, not a trend reversal. In terms of short-term operations, we need to focus on the key support area of 3855-3850 below, and we can wait for the price to fall before choosing an opportunity to go long.
Trading Strategy:
Buy at 3855-3850, with a stop loss at 3840. Target profit levels: 3880, 3890, 3900.
Gold prices soar, where will the short positions go?Currently, gold is encountering resistance and falling back near 3893-3895, and the bullish momentum has weakened slightly. As mentioned earlier, the current price has reached our risk area. A large part of the reason for today's rise is that the US government has officially shut down. This kind of news-stimulated rise is not long-lasting. After encountering resistance, it will fall like a waterfall. The technical indicators have diverged and are overbought, and most funds cannot participate in long transactions in this extreme rising pattern. In order to increase liquidity, gold also needs a correction, so we consider continuing to short gold near 3893. To increase liquidity, gold also needs a pullback, so we are considering continuing to short gold around 3893.
Resistance: 3900, 3925
Support: 3872, 3843
Gold Hits New Highs; Can It Break Through 3900?This week, key economic data releases to watch include the US ADP employment report, the ISM Manufacturing PMI, and the crucial September non-farm payrolls report. If data continues to show a slowdown in the U.S. economy, it will reinforce expectations of a rate cut by the Federal Reserve, which will be good for gold.
While an October rate cut is highly anticipated, any clues about the future path of interest rates could cause market volatility.
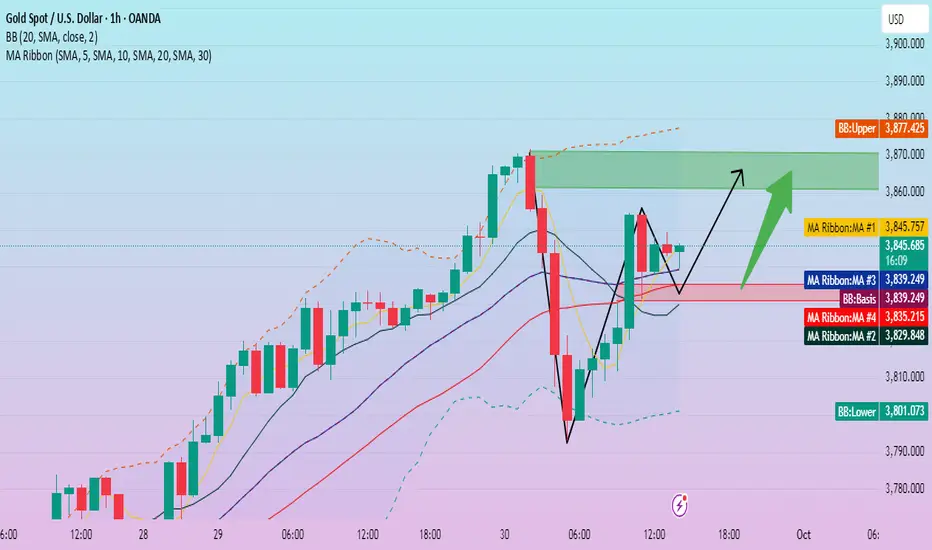
On Wednesday, gold generally showed a volatile upward trend, breaking through a new all-time high in early Asian trading, reaching a high of 3895.37. The 3900 level seems unable to halt the price's upward momentum. From the perspective of technical indicators, the 1-hour chart shows that the price rebounded on Tuesday and touched the lower track of the Bollinger Band, and then rose strongly to a new high of 3875. The moving average system is arranged in a straight line upward, and the momentum of gold bulls remains abundant.
The 4-hour moving average shows a golden cross bullish arrangement, the price remains above the 5-day moving average, the gold price is above the middle Bollinger band, the gold bulls are strong and remain unchanged. In the short term, pay attention to the MA10 moving average position of 3870-3875 area. You can still go long when the price pulls back to this position.
Trading Strategy:
Buy around 3870, with a stop loss at 3860. Target profit range: 3890-3900. Hold the position if it breaks above 3900.

Gold Holds Near Record Highs📊 Technical Structure
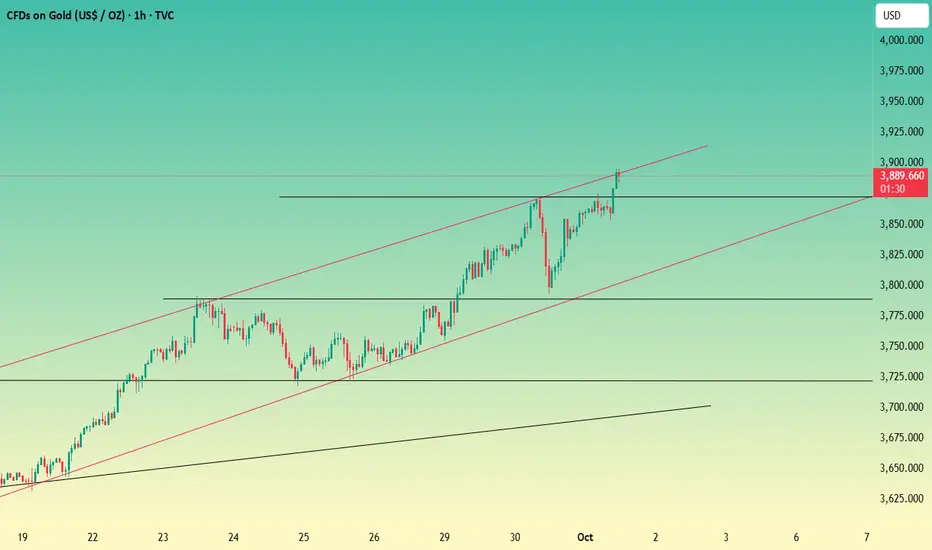
TVC:GOLD (XAU/USD) continues to consolidate near its all-time high, with price currently trading around $3,863 after retreating slightly from the peak. The chart shows a clear bullish channel, with immediate Support Zone at $3,840–$3,847 and a Resistance Zone at $3,900–$3,905. Any corrective dips into the support area are likely to attract fresh buying, keeping the upside bias intact.
🎯 Trade Setup
Entry: $3,847 (near support retest)
Stop Loss: $3,836 (below channel and support zone)
Take Profit: $3,905
R:R Ratio: ~1 : 5.13
🏦 Macro Background
Gold’s bullish momentum is underpinned by three key themes:
US Government Shutdown Risk – A Republican spending bill failed in the Senate, increasing the likelihood of a partial shutdown, which supports safe-haven demand.
Dovish Fed Expectations – Markets are pricing in a 95% chance of a rate cut in October and a 75% chance of another in December, keeping USD under pressure.
Geopolitical Risks – Rising tensions over US missile supplies to Ukraine and Middle East instability continue to drive safe-haven flows into bullion.
Together, these fundamentals reinforce gold’s upside bias, making dips attractive for buyers.
🔑 Key Technical Levels
Resistance Zone: $3,900 – $3,905
Support Zone: $3,840 – $3,847
📌 Trade Summary
Gold remains in a bullish consolidation phase near record highs, with the path of least resistance to the upside. A retest of the $3,840–$3,847 support zone may provide a solid long opportunity targeting $3,900+. Fundamentals continue to support safe-haven demand and weaken USD, keeping gold well-bid.
⚠️ Disclaimer
This analysis is for reference only and does not constitute trading advice. Trading involves significant risk, and proper risk management is essential.

Gold Volatility: New Highs Ahead?Gold bottomed out and rebounded on Tuesday, breaking below the 3800 level with a significant decline. Most market participants expected a trend reversal; however, the subsequent rise during European and US sessions demonstrated the strength of the bullish sentiment, driving gold sharply higher.
The bullish momentum remains strong in the short term, with gold consolidating around 3860. The fresh high reached in early Asian trading, around 3875, further reinforced the bullish sentiment.
The 1-hour line is also rising in slow fluctuations. In the short term, we need to focus on the trend of the European session. If the bulls are strong, the retracement of the European session will be relatively limited, otherwise it will lose the momentum to continue to attack; and the top and bottom conversion below will also be maintained around 3855, which may form a watershed position.
You can try to continue to go long near this position, and if the European session breaks down, then we need to abandon the long strategy in the US session. Currently, the competition between bulls and bears is fierce, and prudent traders can maintain a wait-and-see attitude for a period of time.
For more aggressive traders, consider buying around 3855, with a profit target of 3880-3890 and a stop loss at 3845.

Gold experiences a correction. The bull market continues.Gold saw a sudden and significant pullback on Tuesday, but under the influence of a series of risk-averse news related to the potential US government shutdown, gold bulls rallied again, pushing prices higher. Gold closed the day at a high level. The strength of the gold bulls remains robust; this single-day correction suggests that the upward momentum for gold is still strong.
Although gold fell significantly, it did not break below the key support level of 3791, indicating that the bears did not gain complete control. After a short-term correction, the bulls launched a counterattack. The 1-hour moving average for gold remains upward, with no signs of a trend reversal. The bullish momentum for gold is still strong, and the moving average support has now moved to around 3828.
Quaid believes that gold may continue its upward trend, as the current gold bull market is unlikely to end soon. Quaid recommends continuing to buy on dips, maintaining a bullish stance on gold.
Trading Strategy:
Buy around 3825-3830, with a stop loss at 3805, and target profit levels of 3865-3875.

Gold enters the overbought zone, you can short it on ralliesWhy is gold so strong? Ultimately, it's driven by multiple factors: the Federal Reserve entering a cycle of rate cuts, financial and trade factors, and war. However, this doesn't mean gold won't need a short-term correction! Large cycles provide directional guidance, while smaller cycles determine the rhythm.
Yesterday, the gold market completed its final formation for September. After a strong, volatile rally at the beginning of the month, it broke through multiple round numbers, reaching a record high of 3872 in late trading before consolidating. The monthly line finally closed at 3858, forming a large, saturated bullish candlestick with a slight shadow. This monthly gain of over $400 is primarily due to the Federal Reserve's initiation of a new round of rate cuts against the backdrop of poor US data, which heightened market risk aversion, and the intensified conflict in the Middle East and between Russia and Ukraine. This strong upward trend has led to a strong upward trend. While this large bullish candlestick has the technical potential to continue its upward trend, a rapid short-term rise can also lead to a technical divergence. If the market continues to rise without adjustment and encounters resistance, it can easily lead to profit-taking.
As mentioned before, the increase this time has exceeded 500 US dollars, which has entered our risk zone. Technically, it has deviated from the pattern and entered the overbought zone. Most people in the market are bullish now, but I think the benefits of chasing the rise now are greater than the risks, and there are still opportunities to make profits by shorting gold. So today we are still considering shorting gold on rallies.
Resistance: 3872, 3893
Support: 3843, 3812
If you don't have a detailed trading plan for gold, follow my updates. I'll update my strategies and ideas daily for your reference, helping you avoid detours on your trading journey.

XAU/USD) Bullish trend analysis Read The captionSMC Trading point update
Technical analysis of XAU/USD (15m timeframe) chart analysis:
---
Bullish Gold Setup
Chart Pattern: Price broke out of a triangle consolidation after retesting the order block (OB, yellow zone). This signals accumulation before continuation.
Order Block (OB): The zone around 3,836 – 3,840 acted as a strong demand area. Price respected it and bounced back.
EMA Support:
50 EMA (red) is sitting just above the OB, providing short-term support.
200 EMA (blue) is trending upward, confirming underlying bullish bias.
Projection: The breakout is expected to expand higher toward the measured move target.
---
Target Point
3,883.44 is the projected upside target.
This aligns with the breakout projection and prior liquidity grab zone.
Mr SMC Trading point
Trading Idea
Bias: Bullish.
Entry Zone: Pullback toward 3,836 – 3,840 OB for confirmation.
Target: 3,883.
Invalidation: A breakdown below 3,816 (200 EMA) would invalidate the bullish setup and suggest deeper retracement.
Please support boost 🚀 this analysis

Bullish sentiment dominates, sweeping all before it?The gold market witnessed a dramatic V-shaped rebound. After initially breaking through the key $3800 support level, bearish sentiment briefly dominated.
However, the market sentiment abruptly shifted due to two pieces of news: Fed officials signaled a potential interest rate cut, suggesting the high-interest rate environment may be nearing its end; and Trump's announcement of a significant increase in military spending to $1 trillion by 2026, further fueling geopolitical uncertainty. These two factors combined ignited safe-haven buying, providing strong support for gold.
Gold prices then staged a 360-degree turnaround, rallying strongly. This bottom-reversal pattern clearly demonstrated the strength of the bullish forces. The price not only recovered above the $3830 support level but also formed a strong bullish technical pattern, indicating a significant shift in market sentiment towards optimism, with lower support solidified and bearish resistance effectively overcome.
Trading Strategy:
Continue to buy at $3835-$3830, with a stop loss at $3820 and a profit target of $3860-$3870.
XAU/USD) Bullish trend analysis Read The captionSMC Trading point update
Technical analysis of Gold (XAU/USD) 30-min chart you shared:
---
Gold (XAU/USD) – Bullish Setup (M30 Chart)
Market Structure:
Price is moving inside a bullish ascending channel.
Current retracement is pulling back toward a fair value gap (FVG, H4) highlighted in yellow.
Price is still holding above the 50 EMA (3806.16) and 200 EMA (3766.40), both sloping upward → confirming bullish momentum.
Key Levels:
Support Zone (Demand / FVG H4): 3810 – 3820 region (yellow box).
EMA 50: Acting as dynamic short-term support around 3806.
EMA 200: Stronger bullish base at 3766.
Target Point: 3857.19 (resistance zone & top of channel).
Price Expectation:
Likely scenario:
Price may retrace into the FVG support zone → bounce upward → continue inside the channel toward the target point 3857.
As long as the structure holds above 3806 (EMA 50), the bullish setup remains valid.
Mr SMC Trading point
---
Bias: Bullish
Target: 3857.19 Key Support: 3810 – 3820 zone (FVG + EMA confluence)
Please support boost 🚀 this analysis
