XAUUSD – Should You Trade the Red News… or Let Them Trade You?🌟The Hype vs. Reality
Every NFP Friday, you’ll see traders flexing $500 to $5,000+ in one candle. But the reality check is that 95% of accounts are blown by spreads, slippage, and whipsaws. News looks like payday, but for the market, it is traps set both ways for retail traders.
Why Gold + Red USD News Is a Dangerous Mix
XAUUSD reacts harder with momentum than any other Forex pair.
NFP, CPI, FOMC, PCE — every release creates engineered chaos.
Typical pattern: spike one way → sweep stops the other way → only then trend resumes.
Example: NFP prints strong, Gold dumps 100+ pips, sweeps liquidity, then rips 350+ pips bullish with the higher-timeframe trend.
🔴When You Shouldn’t Touch It (Beginners)
If you’re still learning structure, stay flat. Here’s why:
• Spreads jump 10–30 pips instantly.
• SLs get slipped or completely ignored.
• First candle is pure manipulation.
• Emotions peak → revenge trades blow the account.
• Best move: study the reaction and wait for a safe entry, repeat 100+ times X more.
🟢When You Can Consider It (Intermediate Traders)
For traders with experience 1year+ on the charts:
• Before the release: position based on HTF bias, with very small risk.
• After the release: wait for the spike to finish, then take structure-backed entries.
Example: CPI prints weak, Gold jumps → once the fakeout clears and structure reclaims, you trade the continuation.
🖊️The Truth Nobody Likes to Hear
News doesn’t set the trend; instead, it likes to accelerate the story the chart was already telling.
If you can’t trade Gold without news, why would you dream of lying to yourself that an Unemployment Claims would make you instantly rich?
Final Note:
Trading XAUUSD over Red folder news is not proving catching the spikes. You need to show by sitting put, waiting for the dust to settle, that you trade with structure.
Beginners should grab some popcorn, watch it, and study for a while.
Intermediate traders can use news as fuel.
But if you dive in blind, remember XAUUSD doesn’t care about your trade; most likely, it will feed on it while you are volunteering as liquidity.
If this article helped you today and brought you more clarity:
Drop a 🚀 and follow us✅ for more trading ideas and trading psychology. Thank you.
Goldpriceaction

Can gold reach new highs?Gold is currently in a critical phase of long-short confrontation, with key focus on the resistance zone of 3,656-3,658 on the upside. This range is not only a periodic resistance formed after the previous price rally, but also a core verification point for the sustainability of short-term bullish momentum. From a technical perspective, only when the gold price breaks above and holds the 3,656-3,658 range effectively can the bullish trend reactivate its strong momentum, thereby continuing to challenge the previous high of 3,674. If the price remains constrained by this resistance before breaking through 3,656-3,658, the market will most likely maintain a range-bound consolidation pattern, with prices possibly fluctuating repeatedly at current high levels while awaiting guidance from the Federal Reserve next week.
From a short-term perspective, gold generally presents a "consolidation with bullish bias" trend. Although the low points fluctuate, there is no obvious downward shift, and the price can quickly recover part of the lost ground after each pullback—this indicates that there is still support from buying interest below. Based on this, the evening trading strategy will center on "building long positions on pullbacks".

A pullback is an opportunity, go long decisively!Yesterday, the technical analysis of gold first declined and then rose. It was suppressed below the 3650 mark during the Asian and European sessions and showed a continuous decline. It further accelerated its decline before the European and US sessions, breaking through the 3630 mark, and continued to decline to around 3613 to stabilize and rebound. It rebounded strongly during the US session and finally closed above the 3630 mark with a small negative fluctuation. The overall price still held the 3610 mark, forming a support and stabilization pattern. After the opening of today, gold once again rose and broke through the 3640 mark. In the short term, it has experienced continuous retracements to test the 3610 mark support, which is still valid. The long position at the daily level is continuing well, and it is expected to further impact the previous high of 3675 resistance area. Today, the short-term support below is around 3630-3620, and the important support is 3610. If it falls back to this position during the day, the main bullish trend will remain unchanged. The short-term bullish strong dividing line is 3600. If the daily level stabilizes above this position, the rhythm of falling back to low and long and following the trend will continue. The specific execution plan of the counter-trend short order will be updated as soon as possible according to the real-time trend, and I will remind everyone to respond flexibly to ensure that every step of the operation is carried out under controllable risks. Remember to pay attention in time.
Gold operation strategy: Go long when gold falls back to around 3630-3620, with the target at 3650-3660. Continue to hold if it breaks through.

CPI data is confusing,gold is fluctuating in a bearish directionGold Technical Analysis: Looking back at the recent trend, gold surged and then retreated on Tuesday, forming a shooting star pattern. However, the decline did not continue on Wednesday, indicating that the pullback was merely a one-off adjustment and lacks sustainability. It is a normal correction after a significant rally. Even if the market peaks, it will not be so simple. It will at least undergo a process of "high-level fluctuations turning bearish" or "second upward attack to lure more investors and then decline." In the short term, the rebound will continue to fluctuate, and it is unlikely to see significant rises or falls in a short period of time. Looking at the daily gold chart, the daily gold line has slowed down slightly. After continuous large volume, the daily line has turned into a small Yinxing candlestick pattern for consolidation. There is a need for a short-term pullback. Considering the short-term chart, the second high-point test failed to break through the previous high, the previous continuous large volume without a pullback, and the pressure from the second upward test. If there is no new high in the short term, there will be a partial correction around 3675-3657. The pattern will determine whether it is a deep pullback or a sideways consolidation.
Judging from the 4-hour gold chart, yesterday's gold price failed to achieve results in its attempt to rise again. There are signs of a downward correction. The 4-hour chart lost the middle track, breaking the unilateral upward momentum. At the same time, there is a need to further retrace to the lower track. Combined with the second high in the hourly chart near 3657, the second pressure turned into a decline. The strong market is to retrace and then break the high. Once the breaking power is stopped, it will go into a shock correction. Overall, today's short-term gold operation strategy recommends shorting on rebounds as the main strategy, and buying on pullbacks as the auxiliary strategy. The short-term focus on the upper side is the 3640-3650 resistance line, and the short-term focus on the lower side is the 3610-3600 support line.
Stay bullish, stick to the direction.Gold prices did not continue to rise but instead fluctuated at high levels. Such fluctuations do not mean a short-term peak; only a drop back below $3,600 would warrant considering short-term short positions. The high-level consolidation on the 1-hour chart has not broken down, and after such a substantial rally, a minor short-term pullback is perfectly normal—there's no need for excessive concern. What's more important is to grasp the overall trend; pullbacks are just opportunities to get on board at a better price.
The market is currently focused on next week's Federal Reserve interest rate decision, which will be the real game-changing news. Therefore, holding the $3,600 level is crucial. As long as this level remains unbroken, the bullish momentum will continue to stay strong.
I will closely track and analyze the market daily. If you're losing direction in this kind of market, feel free to follow me or leave me a message.

The decline is just an adjustment, gold still has new highsAccording to the strategy, we first arranged long orders near 3620, and the market rose smoothly to around 3650; then it fluctuated and consolidated, and according to the strength of the decline, we were prompted to go long again near 3640, and finally made a profit again near 3655, achieving two consecutive wins with open long orders, and reaping considerable profits overall. Congratulations to friends who have been paying attention. Many traders who blindly followed the trend and shorted in the market today are wailing, but we have always insisted on remaining unchanged in the face of change. After confirming the strong rhythm, we have made decisive and continuous attacks, steadily reaping profits, and the winning streak is still continuing.
Gold is fluctuating upward above the 3640 level. It is currently fluctuating around the 3650 level. The market's expectations for interest rate cuts have not cooled down. The market may continue to fluctuate at a high level in the later period. Although gold rebounded on Wednesday, it did not reach a new high. The main structure is still operating within the expected range. However, after the market has stood above 3650, it brings uncertainty to the trend. Therefore, gold is still treated with the idea of going long on pullbacks. Going long on pullbacks is still the general trend. In terms of operation, I believe that we will continue to go long as the pullback does not break.
From the 4-hour cycle, the bullish structure of gold remains stable. The short-term support below is around 3635-3625. The bullish strong dividing line has moved up to 3615. If this position is not broken, the pullback will rely on this area and continue to be bullish. At the daily level, as long as it stabilizes above 3615, the overall main tone of pulling back to low and long and following the trend will remain unchanged. In terms of operation, we should be patient and wait for the support to be confirmed. Low and long is still the general direction. As for the specific operation strategy of the counter-trend short position, I will remind you again at the key position, and everyone can pay attention to it in time.
Gold operation strategy: Go long when gold falls back to around 3640-3630, with the target at 3655-3660. Continue to hold if it breaks through.

Gold Trade Idea Thurs 11 Sep Gold is breaking out of the ascending channel and we expect a new ATH again.
The big move might be before, during or after tonight CPI and PPI data.
Gold 30 min chart
Enter: Buy/long 3645
stop loss: 3630
Target 1: 3675
Target 2 : 3700

Pullback for accumulation; bullish momentum remains promising.Gold broke upward against the resistance of the trendline, rising to a high of around 3,658. As indicated in the morning analysis, we have advised everyone to take partial profits first on positions entered below the 3,600 level to lock in gains. From the 1-hour candlestick chart, gold has consistently maintained a "gradual upward movement amid consolidation" rhythm, with lower lows continuing to move higher, and the stability of the trend structure is remarkable.
During a one-sided upward trend, the market's response to data is biased: bullish news will be amplified, while bearish news will be overlooked. One should not rely excessively on data for trading; more seasoned traders understand the logic behind the data and the current market environment.
For subsequent moves, when the price retraces to the hourly support level, those who have already taken profits can continue to follow up with long positions. We will closely track and analyze the market daily. If you lose your direction in such a market, you are welcome to follow us and leave a message for communication to obtain more targeted analysis and trading advice.

A pullback with a pause, yet the uptrend remains unchanged.The higher the gold price climbs, the more hesitant people become to take action. Those who sold gold early or waited for a lower entry point have completely missed out on this rally—some regret buying too little, some regret not buying at all, and even more regret exiting at a loss.
The market works this way: it can never satisfy everyone. When it’s in consolidation, people long for a one-sided trend; when a one-sided trend arrives, they want to wait for a correction. Life is much the same—things rarely go smoothly at every turn.
In an uptrend, a sharp drop is hard to sustain. Only when the secondary rebound fails to hit a new high and the subsequent pullback breaks below the previous low can the market shift into consolidation. Right now, $3,618 has become the key long-short dividing line.
Currently, the market is edging higher along the hourly support level. Personally, I still hold a bullish view overall, but today’s momentum is noticeably weaker than before. Therefore, I will consider taking partial profits around the $3,658 level.
I will closely track and analyze the market every day. If you lose your direction amid such market moves, you can follow me or leave me a message.
US PPI Data Preview (Aug 2025) – Impact on USD, Gold, and Fed RaThe US Producer Price Index (PPI) for August 2025 will be released on September 10th. PPI measures the prices producers receive for goods and services, making it one of the earliest indicators of inflation trends.
July 2025 Recap
PPI MoM: +0.9% (biggest jump in 5 months, mainly services)
PPI YoY: +3.3% (highest since early 2025)
Core PPI (ex-food & energy): +0.9%
Core-Core PPI: +0.6% (largest since 2022)
The surge was driven by service costs and tariffs on goods.
What to Expect in August
Headline PPI MoM: Likely 0.2% – 0.4% (a slowdown after July’s spike)
Core PPI MoM: Around 0.3% – 0.5% (services stabilizing)
PPI YoY: Could ease to 2.8% – 3.2%
Tariffs, energy prices, and service costs remain the key risks.
Why This Matters for Markets
If PPI comes in hotter than expected, inflation fears rise → less chance of a Fed rate cut → USD stronger, Gold weaker, stocks cautious.
If PPI is softer, markets may price in a September Fed cut → USD weaker, Gold and risk assets supported.
Core-Core PPI (ex-food, energy, trade services) is critical to see the real inflation trend.
Market Watch
Dollar Index (DXY): Could gain on strong PPI, slip on weak PPI.
EUR/USD: Around 1.16 – sensitive to inflation data & Fed bets.
Gold (XAU/USD): Likely to benefit from weaker data and safe-haven flows.
S&P 500 / Stocks: Bullish if inflation cools, cautious if hot.
Conclusion:
August PPI is expected to cool slightly after July’s jump. If inflation pressure eases, the Fed may stick to rate cut plans, which could lift Gold and risk assets. But if service and tariff costs stay high, expect the Dollar and yields to rise.
👉 What do you think? Will the PPI surprise higher and boost the Dollar, or cool down and give Gold a push?
#PPI #USD #Gold #Forex #Fed #Inflation #Trading #tradewithdecrypters

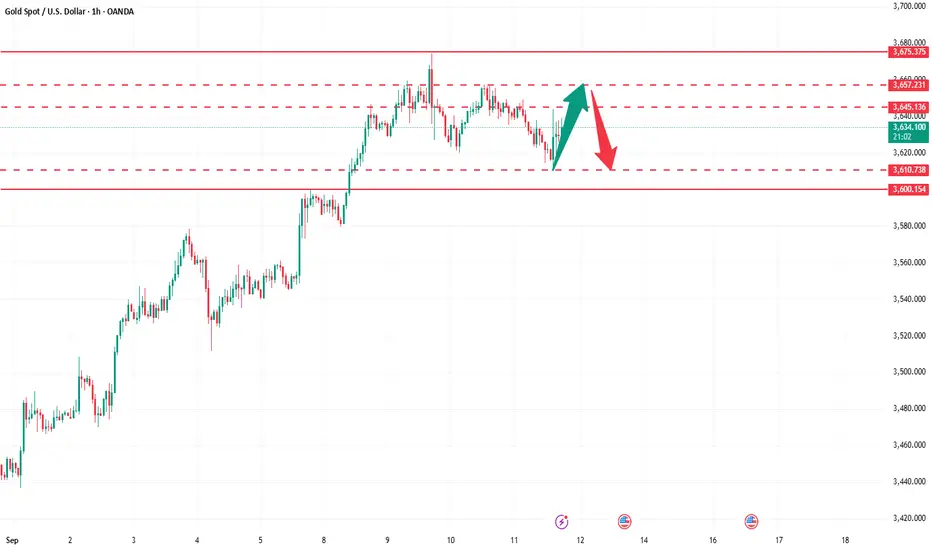
Gold Potential Reversal Ahead - Gold Sell OpportunityGold is currently trading around 3647 after making a strong bullish move. Price has reached near a weak high zone and is showing signs of exhaustion, which indicates a possible retracement. The immediate resistance at 3659 has created a weak high. If Gold fails to sustain above this level, sellers are likely to step in, pushing price down toward the levels at 3620 – 3604. A confirmed rejection candle around the sell zone will act as the sell trigger, with 3578 as a deeper bearish target if momentum increases.
🔑 Key Levels to Watch:
- Resistance: 3687 – 3712
- Support: 3,628 - 3600
📌 Sell Zone & Sell Trigger:
- Sell Zone: 3670 – 3685 area
- Sell Trigger: A rejection candle or confirmation of failure to break above 3670 – 3685 zone.
Note
Please risk management in trading is a Key so use your money accordingly. If you like the idea then please like and boost. Thank you and Good Luck!

Is gold at its peak?Gold has staged a "buy the rumor, sell the fact" move. The U.S. nonfarm payrolls data was bullish for gold, yet gold plummeted after the data release. There’s no need for confusion—it’s not as you might think, that bullish data means the price rises and bearish data means it falls. If it were that simple, everyone would be making money.
Data and fundamentals are reflected in prices, but such reflections can be ahead of time, lagging, exceeding expectations, or falling short of expectations. Judging which scenario it is depends solely on the historical database one has accumulated and long-term real-trading experience.
Today, I added to my gold positions twice and am still holding them. Even if the price falls further, my profits won’t decrease. This is because I believe today’s decline is most likely a result of some profit-taking traders closing their positions on the opportunity—after all, there have been no major bearish factors in the fundamentals yet. Whether a daily-level correction will occur still requires further observation. After all, since the rally started on August 20, there has been no real daily-level correction except for the sharp intraday pullback on September 4, and a correction would actually make the trend healthier.
The period from now to next week is a critical short-term window for gold. I will closely track and analyze the market every day. If you lose your direction in such a market, you can follow me or leave me a message.

GOLD– Market Outlook
🔼 Bullish Scenario:
• If the price holds above 3635, the upward momentum is expected to continue.
• Target: 3675 (main resistance level).
• If 3675 breaks, the price may rise further and enter the bullish zone.
🔽 Bearish Scenario:
• If the price stabilizes below the retracement level, a temporary correction may start.
• Target: 3595 (strong support).
• If the price breaks below 3595 and closes under it (especially on the 1h or 4h timeframe):
→ The next bearish target will be 3546.
⚠️ However, if 3595 holds and is not broken, the price will likely bounce and resume the bullish trend.
⸻

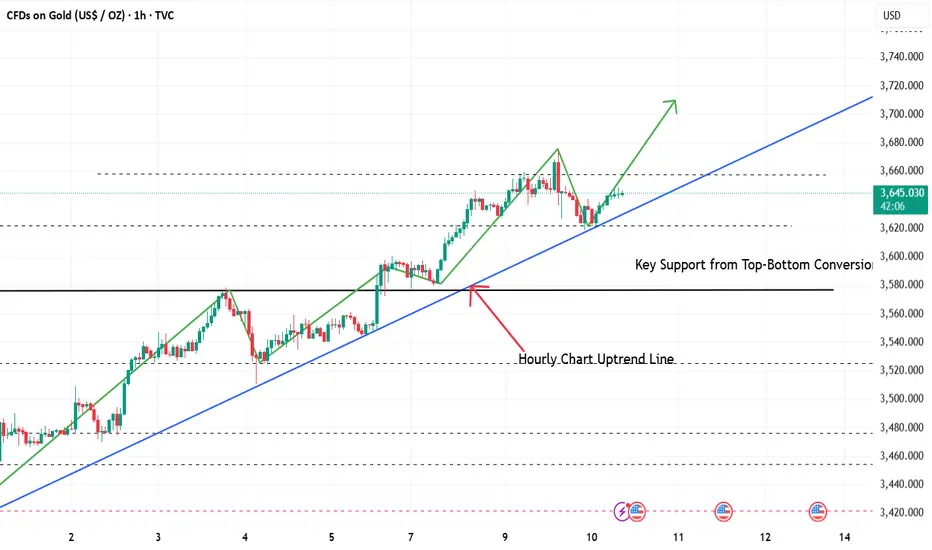
In a bull market, stick to the long position to the endThe biggest challenge in a one-sided trend lies in courage—the courage to enter the market, the courage to not fear high prices, and the resolve to stop guessing the top. No one can predict how high the price will go. The key to determining long or short positions lies in the starting point of the rally and whether the last top-bottom conversion level has been broken. Trend is king; go with the trend. In a bull market, short-term pullbacks do not disrupt the bullish trend. However, since gold is currently at a high level, it is essential to set up risk protection measures every time before looking for further upside. This will help avoid being caught holding positions at the peak during the final phase of the gold bull market. There’s no need to predict the top in a rally—gold is still in a major bull market, and we’ll keep the gold bullish trade going all the way.
From the perspective of the 1-hour trend structure, the overall market movement is extremely sound, including the top-bottom conversion levels and the early-morning rally starting points. While identifying the trend direction may seem simple, this logic is highly effective in a one-sided market. As long as we hold onto the key levels and maintain the bullish outlook unchanged, any pullback is an opportunity to enter the market. For those who haven’t entered yet—this has been emphasized many times—you can go long with a small position around the 3640-3642 range today. For those who entered the market with me earlier, simply hold onto your positions.
If you feel confused about the future market trend, or if you have not yet made profits in such a market, follow me and leave me a message – let me help you resolve this issue.

XAU/USD 09 September 2025 Intraday AnalysisH4 Analysis:
-> Swing: Bullish.
-> Internal: Bullish.
Price has finally printed a bullish iBOS, in-line with analysis dated 23 April 2025
As mentioned in analysis dated 04 September 2025, with respect to alternative scenario, price could potentially continue higher, is how price printed, price continued its upward trajectory printing all-time-highs.
Price previously printed a bearish CHoCH which is the first indication, but not confirmation, of bearish pullback phase initiation, however, due to the insignificant nature of the pullback, particularly relative to previous price action, I will apply discretion and not classify previous iBOS, I have marked this in red.
Price has continued with it's upward trajectory. We are now trading within an internal low and fractal high.
Intraday Expectation:
Price to print bearish CHoCH, which is the first indication, but not confirmation, of bearish pullback phase initiation. CHoCH positioning is denoted with a blue dotted line.
Price to then trade down to either discount of internal 50% EQ, or H4 supply zone before targeting weak internal high priced at 3,659.435.
Alternative scenario: Price could potentially print higher-highs.
Note:
The Federal Reserve’s sustained dovish stance, coupled with ongoing geopolitical uncertainties, is likely to prolong heightened volatility in the gold market. Given this elevated risk environment, traders should exercise caution and recalibrate risk management strategies to navigate potential price fluctuations effectively.
Additionally, gold pricing remains sensitive to broader macroeconomic developments, including policy decisions under President Trump. Shifts in geopolitical strategy and economic directives could further amplify uncertainty, contributing to market repricing dynamics.
H4 Chart:
M15 Analysis:
-> Swing: Bullish.
-> Internal: Bullish.
Price has printed according to analysis dated 13 June 2025 by targeting weak internal high priced at 3,451.375 and printing a bullish iBOS.
Price has continued with its bullish trajectory printing all-time-highs.
Price is currently trading within and internal low and internal high as price has printed a bearish CHoCH, which is the first indication, but not confirmation of bearish pullback phase initiation.
Intraday Expectation:
Price to continue bearish, react at either M15 supply zone, or discount of 50% internal EQ before targeting weak internal high priced at 3,659.435.
Alternative scenario: Price could potentially continue bullish.
Note:
Gold remains highly volatile amid the Federal Reserve's continued dovish stance, persistent and escalating geopolitical uncertainties. Traders should implement robust risk management strategies and remain vigilant, as price swings may become more pronounced in this elevated volatility environment.
Additionally, President Trump’s recent tariff announcements are expected to further amplify market turbulence, potentially triggering sharp price fluctuations and whipsaws.
M15 Chart:

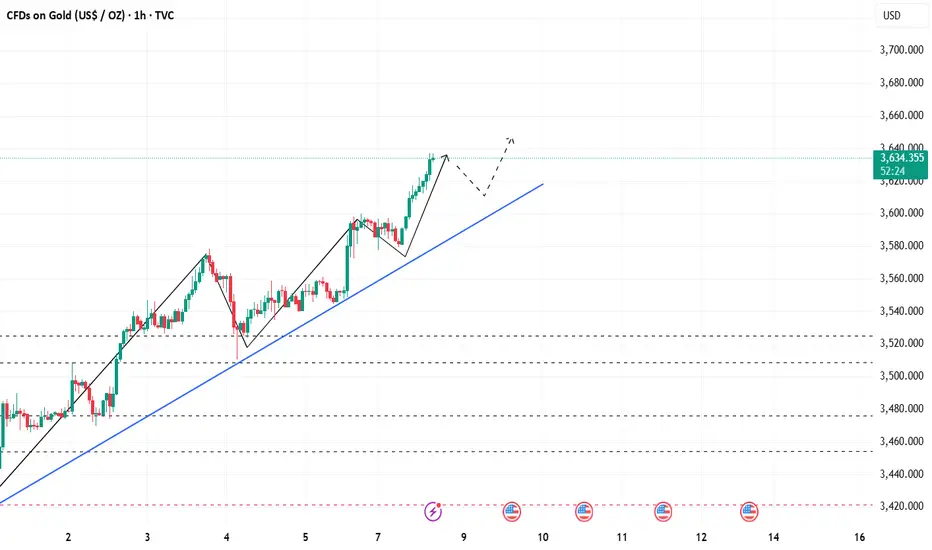
Never predict the top; go long with the trendThe bullish momentum for gold is unstoppable, with basically no significant pullbacks. Therefore, gold will only continue to stay strong for now. It is basically impossible to wait for a major pullback in gold at the moment—if a sharp pullback starts, it will no longer be a correction. The current market follows the rule: "A strong trend sees no correction; a correction means no strength."
The 1-hour moving averages of gold remain in a bullish divergence pattern with a golden cross trending upward. After breaking above the 3,600 level, gold has continued to move higher. Now that it has broken through and held above 3,600, this level will become a key support for gold in the short term. In such a strong market, gold usually resumes its strength after a pullback of around 20 US dollars. Those who haven’t entered the market can go long on dips around 3,620 in line with the trend. Those who already hold positions can just keep holding.
A real trending market won’t end so soon. Gold is now in a major bull market cycle—there’s no need to predict the top during a rally. Following the trend means going long; we’ll keep the gold bullish trade going all the way.
If you feel confused about the future market trend, or if you have not yet made profits in such a market, follow me and leave me a message – let me help you resolve this issue.

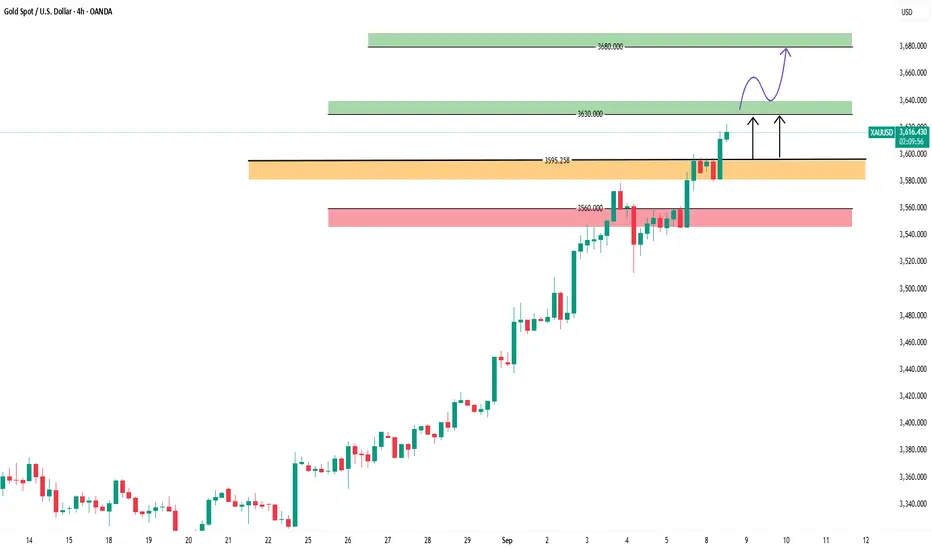
GOLD analysis in time frame 4h
🔹 If price trades above 3595:
• The trend will likely continue upward toward the resistance level at 3630.
• A breakout above 3630 and holding above it (on the 4-hour or 1-hour candle) would confirm a continuation upward toward 3680.
⸻
🔹 If price fails and breaks below 3595:
• The trend will likely move downward toward the support level at 3560.
• This support is strong, but if it is broken, the trend may fully shift into a deeper decline.
⸻
📌 In short:
• Above 3595 → bullish trend (targets 3630 → 3680).
• Below 3595 → bearish trend (targets 3560 → further downside).
Been going long all along—how many of you followed?The international gold price has continued its consistent strong trend. It not only remains firmly anchored at a high level but also keeps advancing toward new ranges driven by bullish momentum, with the stability and continuity of the current trend now extremely clear. For investors who have already established gold long positions, it is advisable to hold their positions firmly and avoid triggering profit-taking prematurely due to minor short-term fluctuations. As we have emphasized repeatedly, in such a one-sided strong market, exiting early – or "getting off the bus ahead of time" – is essentially equivalent to missing out on subsequent trending gains and can even be considered an implicit loss. More crucially, in a strong market, prices usually do not offer those who exit midway a chance to re-enter at a low price. Once you miss the opportunity (miss the market), you will likely have to chase the rally to enter, significantly increasing the risk of your positions.
For investors who have not yet entered the market, there is no need to feel anxious about missing the previous price gains, as the current strategy remains clear: wait for a minor retracement in the price, then enter the market in batches with a small position to "secure a spot" – establishing a foundational position first to keep in step with the trend direction. It is imperative to remember the core logic of the trading market: "A strong market sees no correction; a correction means the market is not strong." If the current trend is truly robust, the retracement will inevitably be extremely shallow and short-lived, leaving no room for excessive hesitation.
If you feel confused about the future market trend, or if you have not yet made profits in such a market, follow me and leave me a message – let me help you resolve this issue.
XAU/USD 08 September 2026 Intraday AnalysisH4 Analysis:
-> Swing: Bullish.
-> Internal: Bullish.
Price has finally printed a bullish iBOS, in-line with analysis dated 23 April 2025
As mentioned in analysis dated 04 September 2025, with respect to alternative scenario, price could potentially continue higher, is how price printed, price continued its upward trajectory printing all-time-highs.
Price previously printed a bearish CHoCH which is the first indication, but not confirmation, of bearish pullback phase initiation, however, due to the insignificant nature of the pullback, particularly relative to previous price action, I will apply discretion and not classify previous iBOS, I have marked this in red.
Price has continued with it's upward trajectory. We are now trading within an internal low and fractal high.
Intraday Expectation:
Price to print bearish CHoCH, which is the first indication, but not confirmation, of bearish pullback phase initiation.
Price to then trade down to either discount of internal 50% EQ, or H4 supply zone before targeting weak internal high priced at 3,617.295.
Alternative scenario: Price could potentially print higher-highs.
Note:
The Federal Reserve’s sustained dovish stance, coupled with ongoing geopolitical uncertainties, is likely to prolong heightened volatility in the gold market. Given this elevated risk environment, traders should exercise caution and recalibrate risk management strategies to navigate potential price fluctuations effectively.
Additionally, gold pricing remains sensitive to broader macroeconomic developments, including policy decisions under President Trump. Shifts in geopolitical strategy and economic directives could further amplify uncertainty, contributing to market repricing dynamics.
H4 Chart:
M15 Analysis:
-> Swing: Bullish.
-> Internal: Bullish.
Price has printed according to analysis dated 13 June 2025 by targeting weak internal high priced at 3,451.375 and printing a bullish iBOS.
Price has continued with its bullish trajectory printing all-time-highs subsequently printing a bullish iBOS.
Price is now trading within and internal low and fractal high. CHoCH positioning is denoted with a blue dotted line.
Intraday Expectation:
Price to continue bearish, print a bearish CHoCH, react at either M15 supply zone, or discount of 50% internal EQ before targeting weak internal high priced at 3,617.295.
Alternative scenario: Price could potentially continue bullish.
Note:
Gold remains highly volatile amid the Federal Reserve's continued dovish stance, persistent and escalating geopolitical uncertainties. Traders should implement robust risk management strategies and remain vigilant, as price swings may become more pronounced in this elevated volatility environment.
Additionally, President Trump’s recent tariff announcements are expected to further amplify market turbulence, potentially triggering sharp price fluctuations and whipsaws.
M15 Chart:

The golden bull market will continue.The international gold price has continued its consistent strong performance, breaking through the previous consolidation range and hitting a new all-time high again, with the sustainability of bullish momentum far exceeding the expectations of some cautious voices in the market. Recently, there have been consistent views that gold has entered a high range after a continuous rally, and it is necessary to be alert to correction risks and cautiously deploy long positions. However, we need to examine this from the perspective of longer-term trend logic: before this round of breakout, gold had been consolidating sideways in the broad range of 3,100-3,500 USD/oz for as long as four months. After such a long period of accumulation and consolidation, once a clear breakout direction is formed, the trend inertia usually has strong continuity, and the probability of a trend reversal in the short term is extremely low.
In fact, over the past month or so, we have always adhered to the core view of being bullish on gold, and we also clearly indicated the trading suggestion of "going long in line with the trend after the breakout" last Friday. The current market trend has fully verified this judgment. In such a one-sided strong trend, the core logic of trading should focus on "following the trend" rather than "pursuing extreme precision" — the "courage" to enter the market after the trend is confirmed is far more crucial than repeatedly worrying about "whether to buy at the lowest point" or "whether the entry point is absolutely perfect". Historical market trends have proven time and again that excessive pursuit of a perfect entry point often leads to missing the entire trending opportunity due to hesitation; if you are worried about short-term fluctuation risks after entering the market, you only need to appropriately reduce the position size , which can help control risks while seizing the trend dividends.
As for the subsequent trading strategy, there is no need for overly complicated analysis, and the core logic remains clear: wait for the price to retrace to the key support level , then enter the market in batches with a small position to establish a bottom position first, avoiding missing the trend again due to hesitation, and then gradually adjust the position according to the continuity of the market trend later.

XAUUSD Ready for a slight Pullback ?XAUUSD Still way Bullish on every time frame. This could do a little pull back on H4 and D1 Analysis. What are your thoughts ? Check your support and resistances and open positions accordingly. Wait for Price Again and strong solid breakouts to enter the market.
Disclaimer:
The content presented in this IMAGE is intended solely for educational and informational purposes. It does not constitute financial, investment, or trading advice.
Trading foreign exchange (Forex) on margin involves a high level of risk and may not be suitable for all investors. The use of leverage can work both for and against you. Before deciding to participate in the Forex market, you should carefully consider your investment objectives, level of experience, and risk tolerance.
There is a possibility that you may incur a loss of some or all of your initial investment, and therefore, you should not invest money that you cannot afford to lose. Be fully aware of all the risks associated with foreign exchange trading, and seek advice from a licensed and independent financial advisor if you have any doubts.
Past performance is not indicative of future results. Always trade responsibly.

XAU/USD 05 September 2025 Intraday AnalysisH4 Analysis:
-> Swing: Bullish.
-> Internal: Bullish.
Analysis/bias remains the same as yesterday's analysis dated 04 September 2025.
Price has finally printed a bullish iBOS, in-line with analysis dated 23 April 2025
As mentioned in yesterday's analysis, with respect to alternative scenario, price could potentially continue higher, is how price printed, price continued its upward trajectory printing all-time-highs.
Price has printed a bearish CHoCH which is the first indication, but not confirmation, of bearish pullback phase initiation.
Intraday Expectation:
Price to trade down to either discount of internal 50% EQ, or H4 supply zone before targeting weak internal high priced at 3,578.660.
Alternative scenario: Price could potentially print higher-highs.
Note:
The Federal Reserve’s sustained dovish stance, coupled with ongoing geopolitical uncertainties, is likely to prolong heightened volatility in the gold market. Given this elevated risk environment, traders should exercise caution and recalibrate risk management strategies to navigate potential price fluctuations effectively.
Additionally, gold pricing remains sensitive to broader macroeconomic developments, including policy decisions under President Trump. Shifts in geopolitical strategy and economic directives could further amplify uncertainty, contributing to market repricing dynamics.
H4 Chart:
M15 Analysis:
-> Swing: Bullish.
-> Internal: Bullish.
Analysis/bias remains the same as yesterday's analysis dated 04 September 2025.
Price has printed according to analysis dated 13 June 2025 by targeting weak internal high priced at 3,451.375 and printing a bullish iBOS.
Price has again continued with its bullish trajectory printing all-time-highs with previous pullbacks being very minimal, therefore, I will again apply discretion and mark previous iBOS in red due to insignificant depth of pullback.
Price has printed a bearish CHoCH which confirms internal structure, however, I will continue to monitor depth of pullback.
Intraday Expectation:
Price to continue bearish, react at either M15 supply zone, or discount of 50% internal EQ before targeting weak internal high priced at 3,578.660.
Note:
Gold remains highly volatile amid the Federal Reserve's continued dovish stance, persistent and escalating geopolitical uncertainties. Traders should implement robust risk management strategies and remain vigilant, as price swings may become more pronounced in this elevated volatility environment.
Additionally, President Trump’s recent tariff announcements are expected to further amplify market turbulence, potentially triggering sharp price fluctuations and whipsaws.
M15 Chart:

XAU/USD 04 September 2025 Intraday AnalysisH4 Analysis:
-> Swing: Bullish.
-> Internal: Bullish.
Price has finally printed a bullish iBOS, in-line with analysis dated 23 April 2025
As mentioned in yesterday's analysis, with respect to alternative scenario, price could potentially continue higher, is how price printed, price continued its upward trajectory printing all-time-highs.
Price has printed a bearish CHoCH which is the first indication, but not confirmation, of bearish pullback phase initiation.
Intraday Expectation:
Price to trade down to either discount of internal 50% EQ, or H4 supply zone before targeting weak internal high priced at 3,578.660.
Alternative scenario: Price could potentially print higher-highs.
Note:
The Federal Reserve’s sustained dovish stance, coupled with ongoing geopolitical uncertainties, is likely to prolong heightened volatility in the gold market. Given this elevated risk environment, traders should exercise caution and recalibrate risk management strategies to navigate potential price fluctuations effectively.
Additionally, gold pricing remains sensitive to broader macroeconomic developments, including policy decisions under President Trump. Shifts in geopolitical strategy and economic directives could further amplify uncertainty, contributing to market repricing dynamics.
H4 Chart:
M15 Analysis:
-> Swing: Bullish.
-> Internal: Bullish.
Price has printed according to analysis dated 13 June 2025 by targeting weak internal high priced at 3,451.375 and printing a bullish iBOS.
Price has again continued with its bullish trajectory printing all-time-highs with previous pullbacks being very minimal, therefore, I will again apply discretion and mark previous iBOS in red due to insignificant depth of pullback.
Price has printed a bearish CHoCH which confirms internal structure, however, I will continue to monitor depth of pullback.
Intraday Expectation:
Price to continue bearish, react at either M15 supply zone, or discount of 50% internal EQ before targeting weak internal high priced at 3,578.660.
Note:
Gold remains highly volatile amid the Federal Reserve's continued dovish stance, persistent and escalating geopolitical uncertainties. Traders should implement robust risk management strategies and remain vigilant, as price swings may become more pronounced in this elevated volatility environment.
Additionally, President Trump’s recent tariff announcements are expected to further amplify market turbulence, potentially triggering sharp price fluctuations and whipsaws.
M15 Chart:
