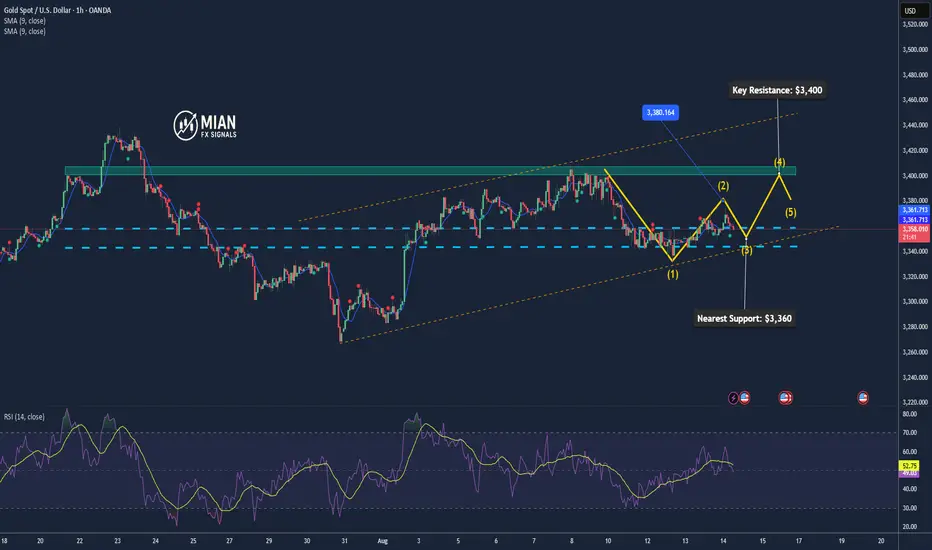
Gold Is Consolidating in the Short Term📊 Market Developments:
Spot gold is hovering around $3,337/oz, as investors await Fed Chair Powell’s remarks at the Jackson Hole symposium (Aug 21–23) for signals on possible rate cuts. Meanwhile, geopolitical updates on U.S. diplomacy in Ukraine also influence sentiment.
📉 Technical Analysis:
• Key Resistance: $3,380/oz
• Nearest Support: $3,330–$3,335/oz
• EMA 09: Price is consolidating near support, no clear direction yet.
• Candlestick / Volume / Momentum: Neutral, waiting for fresh catalysts.
📌 Outlook:
Gold may range or edge higher short-term if the Fed signals dovishness. Otherwise, a pullback toward support remains likely.
________________________________________
💡 Trading Strategy Suggestion:
🔻 SELL XAU/USD at: $3,377–$3,380
🎯 TP: 40/80/200 pips
🛑 SL: $3,383
🔺 BUY XAU/USD at: $3,330–$3,333
🎯 TP: 40/80/200 pips
🛑 SL: $3,327
Goldsetup

Gold Recovers as Rate-Cut Hopes Strengthen📊 Market Summary:
• Gold (XAU/USD) rose slightly +0.5% to ~$3,350.55/oz, supported by growing expectations of Fed rate cuts and lower U.S. bond yields, which boosted safe-haven demand.
• However, easing geopolitical tensions have reduced strong safe-haven flows, putting mild pressure on gold.
📉 Technical Analysis:
• Resistance Levels:
• $3,400 – immediate resistance
• $3,420 – next key resistance if $3,400 is broken
• Support Levels:
• $3,330–$3,335 – strong support zone
• $3,310 – secondary support if $3,330 fails
• EMA & MAs: Price is holding above most short-term EMAs/MAs (MA5, MA10, MA20 → bullish; only MA200 remains bearish) → trend still bullish.
• Momentum Indicators: RSI ~62 (positive), Stoch & MACD remain bullish, ADX ~30 confirms a relatively strong trend.
📌 Outlook:
• Short-term: Gold could retest $3,400–$3,420 if dovish Fed signals and low yields persist.
• Risk: A hawkish Fed tone or easing geopolitical risks could drag gold back down toward $3,330 and possibly $3,310.
💡 Trade Strategy:
🔺 BUY XAU/USD: $3,330–$3,333
🎯 TP: 40/80/200 pips
❌ SL: $3327
🔻 SELL XAU/USD : $3,402–$3,405
🎯 TP: 40/80/200 pips
❌ SL: $3,408

Gold May Correct Amid U.S. Inflation Concerns📊 Market Overview
• Spot gold edged up slightly as the U.S. dollar weakened, but is still heading for a ~1.5% weekly drop as strong U.S. inflation data reduced expectations for significant Fed rate cuts.
• Earlier this week, softer-than-expected U.S. CPI data (up 0.2% in July) briefly lifted gold prices to $3,351.46/oz.
📉 Technical Analysis
• Key Resistance: ~$3,350–3,360/oz
• Nearest Support: ~$3,330–3,340/oz
• EMA 09:
If price is above EMA09 → short-term trend is bullish.
If price is below EMA09 → trend is bearish
• Candlestick / Volume / Momentum:
Price action is consolidating in a narrow range, showing a cautious market tone.
No significant breakout signals from volume yet.
📌 Outlook
Gold may rise slightly in the short term if the U.S. dollar continues to weaken and inflation data remains soft. However, if incoming data reinforces the view of fewer rate cuts (e.g., higher PPI, lower jobless claims), gold could correct lower.
💡 Suggested Trade Strategy
SELL XAU/USD: $3,350–3,355
🎯 TP: ~$3,330–3,340
❌ SL: ~$3,360
BUY XAU/USD: $3,330–3,335
🎯 TP: ~$3,350–3,360
❌ SL: ~$3,320

Gold Longs from 3,300 (11hr demand zone)Weekly Gold Analysis
For this week, I’m watching for short-term sell opportunities down into the 12H demand zone. At the moment, price is showing momentum to the downside, so we could see a setup form in the 12H supply zone before continuation.
However, my main focus remains aligned with the long-term trend, which suggests a potential rally forming from the 11H demand zone.
I’ve also noted a trendline forming above current price — meaning the reaction from the 12H demand zone could play out sooner than expected. That said, given the imbalance below, price may first need to mitigate a supply zone before breaking structure further to the downside.
Confluences for Gold Longs:
- Higher timeframe structure remains bullish overall.
- Significant upside liquidity still needs to be taken.
- An 11H demand zone remains unmitigated.
- For price to continue higher, a retracement is necessary.
- DXY analysis aligns with this bullish outlook.
P.S. Pro-trend trades take priority — but if a sell setup forms, I’ll approach with caution, lower risk allocation, and tighter TP targets.

Gold Likely to Retrace Short-Term – Hot PPI Caps Gains📊 Market Overview:
Gold is facing mild downward pressure after July’s US PPI rose 3.3% YoY, stronger than expected, reducing optimism for an aggressive 50 bps Fed rate cut next meeting. Safe-haven demand remains supported by geopolitical risks ahead of the Trump–Putin meeting, but Fed caution is capping further upside.
📉 Technical Analysis:
• Key Resistance: ~$3,370 (near-term), ~$3,400 (major)
• Nearest Support: ~$3,345 (near-term), ~$3,330–$3,340 (major)
• EMA 09: Price is currently below EMA 09, indicating a mild short-term bearish bias.
• Candlestick / Volume / Momentum: Current structure shows a mild retracement with steady volume; momentum softens as hot inflation data limits upside potential.
📌 Outlook:
Gold may continue easing in the short term if US economic data remains strong. A rebound above resistance could occur if rate-cut expectations revive or geopolitical tensions escalate.
________________________________________
💡 Trade Strategy Suggestion:
🔻 SELL XAU/USD: $3,369–$3,372
🎯 TP: 40/80/200 pips
❌ SL: ~$3,375
🔺 BUY XAU/USD : $3,330–$3,333
🎯 TP: 40/80/200 pips
❌ SL: ~$3,327

Gold Holds Around $3,350 After Volatile Swings📊 Market Overview:
Gold is currently steady around $3,350/oz after intraday moves between $3,341 and $3,375, according to Investing.com. Reuters reports spot gold near $3,357.65/oz, supported by expectations of Fed rate cuts and a softer USD.
📉 Technical Analysis:
• Key Resistance: $3,400
• Nearest Support: $3,341 – $3,342
• EMA 09: Price is hovering near the 9-day EMA, showing a short-term neutral bias.
• Candlestick / Volume / Momentum: Small-bodied candles with long wicks indicate market indecision, awaiting clear macroeconomic cues.
📌 Outlook:
Gold may range sideways around $3,350 in the short term unless new economic data triggers strong movement. A weaker dollar or stronger rate-cut expectations could lift prices toward $3,360–$3,400, while renewed USD strength may pressure gold down to $3,340 or lower.
💡 Suggested Trading Strategy:
SELL XAU/USD: $3,362 – $3,365
🎯 TP: 40/80/200 pips
❌ SL: $3,368
BUY XAU/USD: $3,340 – $3,343
🎯 TP: $3,360
❌ SL: $3,337

Gold Extends Rally as Rate-Cut Expectations Rise📊 Market Overview:
Gold prices extended gains for the third consecutive session, supported by rising expectations that the US Federal Reserve will cut interest rates in September, following softer US inflation data and a weaker US dollar.
📉 Technical Analysis:
• Key Resistance: $3,400 / $3,435
• Nearest Support: $3,358–$3,360 / $3,345
• EMA: Price is trading above EMA50 → bullish short-term signal.
• Candle / Volume / Momentum: Forming an ascending triangle pattern with positive momentum, suggesting potential for further upside.
📌 Outlook:
Gold may continue to rise in the short term if it breaks and sustains above $3,400. A drop below $3,360 could trigger a pullback toward $3,3345.
💡 Trade Strategy Suggestions:
🔻 SELL XAU/USD: $3,400–$3,403
🎯 TP: 40/80/200 PIPS
🛑 SL: $3,406
🔺 BUY XAU/USD : $3,350–$3,353
🎯 TP: 40/80/200 PIPS
🛑 SL: $3,347
Gold Poised for Mild Rebound amid Tariff Relief📊 Market Movement:
Gold eased after President Trump announced tariff exclusions on imported gold bars, easing prior market uncertainty. Safe-haven demand stays supported by macroeconomic and Fed policy concerns.
📉 Technical Analysis:
• Key Resistance: $3,385 – $3,410 – $3,460
• Nearest Support: $3,330 – $3,332
• EMA: Price fluctuates around medium-term EMA.
• Candlestick / Momentum: Ascending triangle, neutral RSI, rising volume → mild accumulation signs.
📌 Outlook:
Gold may see a mild rebound in the short term if trade policy remains stable and the Fed keeps rates unchanged. Strong US economic data could pressure prices downward.
________________________________________
💡 Suggested Trading Plan
🔻 SELL XAU/USD: $3,410–$3,413
🎯 TP: 40/80/200 pips
❌ SL: $3,416
🔺 BUY XAU/USD: $3,330–$3,333
🎯 TP: 40/80/200 pips
❌ SL: $3,327

Gold Breaks $3,352 Support – Further Downside Risk📊 Market Overview:
• Spot gold is now trading at $3,352–3,356/oz, sliding sharply on profit-taking and uncertainty over potential U.S. import tariffs on gold.
• Weak buying interest at support pushed the price below the 200-hour MA, opening the door for deeper declines.
📉 Technical Analysis:
• Key resistance: $3,360–$3,365
• Nearest support: $3,345; next at $3,330
• EMA 09: Price remains below EMA09 → short-term trend is bearish
• Momentum: RSI below 45, sellers maintain control
📌 Outlook:
• Gold may continue to decline toward $3,345 or $3,330 if the H1 candle closes below $3,350.
• Only a break back above $3,365 with strong volume could trigger a short-term reversal.
💡 Suggested Trading Strategy:
SELL XAU/USD: $3,362–3,365
🎯 TP: 40/80/200 pips
❌ SL: $3,368
BUY XAU/USD: $3,345–$3,348 (only if clear bullish reversal candlestick forms)
🎯 TP: 40/80/200 pips
❌ SL: $3,342

Gold Sideways, Awaiting Breakout Confirmation📊 Market Overview:
Gold on the H1 chart is consolidating between $3,375 and $3,404, with buying and selling pressure balanced ahead of U.S. CPI data. Narrow H1 candles suggest imminent volatility.
📉 Technical Analysis:
• Key Resistance: $3.400–$3.410
• Nearest Support: $3.358–$3.351
• EMA: Price hovering around EMA 50, with EMA 9 crossing below EMA 21 → short-term bias slightly bearish.
• Pattern / Momentum: MACD losing bullish momentum, RSI neutral at 48–50, Inside Bar pattern forming on H1.
📌 Outlook:
• A break below $3.351 could drive gold toward $3.333–$3.321.
• Holding above $3.370 and breaking $3.400 could target $3.410–$3.420.
💡 Suggested Trading Strategy:
🔻 SELL XAU/USD : $3.397–$3.400
🎯 TP: 40/80/200 pips
❌ SL: $3.403
🔺 BUY XAU/USD : $3.352–$3.355
🎯 TP: 40/80/200 pips
❌ SL: $3.349

Excellent selling trades Delivered [550 pips]As I mentioned throughout Today's commentary session:
My strategy is sell from 3402-3405
Very happy with the profits so far multiple attempts after Back to back Tps HIT.
TODAY'S PROFITABLE TRADES 💰🙌
GOLD SELL 3400 60 PIPS BE
GOLD SELL 3402 200 PIPS TP
GOLD SELL 3401 130 PIPS TP
GOLD SELL 3400 190 PIPS TP
•4 consecutive WIN
•1 SETUP
Always follow your Setup & your path with Paitence and Discipline
My medium-term targets remain sucessfully delivered which is achieved alhumdullilah.
All I say thanks to those who followed us and made profits.

Gold Poised to Continue Rising If Supports Hold📊 Market Overview:
Gold remains on the rise amid expectations of further Fed rate cuts, a weakening U.S. dollar, and persistent tariff-related uncertainty. Citi has raised its 3-month forecast to $3,500–3,600/oz
📉 Technical Analysis:
• Current Resistance Levels:
o Near-term: $3,408–3,412
o Extended: $3,421 and $3,442
• Key Support Levels:
o Immediate: $3,375, then $3,355 and $3,343
o Deeper: $3,312–3,300 demand zone on TradingView, and April low at $3,170
• Technical Trend:
Gold continues to receive strong bullish signals across multiple moving averages, and FXEmpire indicators show “Strong Buy” across most timeframes
📌 Outlook:
The short-term bias is clearly bullish. As long as gold holds above the $3,375 support and breaks through the $3,408 resistance, it is likely to rally toward the $3,420–3,440 area.
💡 Suggested Trading Strategy:
BUY XAU/USD : $3,375–3,378
🎯 TP: 40/80/200 pips
❌ SL: $3,370

Gold Continues to Attract Safe-Haven Flows📊 Market Brief
Gold prices remain firm above the 20-day EMA and 50-day MA, reflecting increased safe-haven demand amid ongoing trade tensions and growing expectations of a Fed rate cut.
The price is currently testing the resistance area around $3,400/oz, while immediate support lies in the $3,320–$3,330/oz range.
📉 Technical Analysis
• Key Resistance:
- $3,400
- Followed by: $3,420–$3,435
• Nearest Support:
$3,320–$3,330
- If broken, next levels are $3,300–$3,268
• EMA Position:
- Gold remains above both the 20-day EMA and 50-day MA, indicating a short-term uptrend
• Patterns & Momentum:
- RSI ~54 (neutral), MACD positive – indicating underlying bullish momentum
- EMA 8/21 crossover is turning upward, signaling short-term bullish reversal potential
📌 Outlook
Gold may continue rising modestly if it holds above the $3,320–$3,330 support zone and successfully breaches the $3,400 resistance. However, a break below $3,320 could lead to a test of $3,300 or even $3,268.
💡 Suggested Trading Strategy
SELL XAU/USD : $3,395–$3,3400
o 🎯 TP: 40/80/200 pips
o ❌ SL: ~$3,405
BUY XAU/USD :$3,325–$3,330
o 🎯 TP: 40/80/200 pips
o ❌ SL: ~$3,320

Gold May Correct Short-TermMarket Overview:
• Gold trading around $3,366–3,371 USD/oz, easing from two-week highs.
• Pressure from firmer US yields and USD recovery.
• Weak US jobs data boosted Fed rate cut expectations to ~90%.
• Still supported by global economic/political uncertainties and safe haven demand.
Technical Analysis:
• Resistance: ~$3,385–3,390, near psychological $3,400.
• Support: ~$3,345–3,350; break could target ~$3,310.
• Trading above EMA50, EMA9 direction still bullish short-term.
• RSI and MACD momentum fading; July monthly candle formed bearish “shooting star” near $3,431—invalidated only if price closes above that level.
Outlook
Gold may dip if USD and yields recover; but may rally if macro data deteriorate further. The $3,385–3,390 zone is pivotal.
Trading Strategy:
• Sell 3,392–3,395
TP ~40/80/200 pips
SL ~3,397
• Buy 3,345–3,348
TP ~40/80/200 pips
SL ~3,342

Gold Slightly Pulls Back – Awaiting Fed & Dollar Direction📊 Market Drivers:
Spot gold slipped ~0.1% to $3,376/oz, pressured by a firmer USD and caution ahead of Trump’s Fed chair and governor appointments
📉 Technical Analysis
• Key resistance levels:
o $3,390: previous session high – near-term ceiling
o $3,410: weekly high – stronger upside barrier
o $3,435: medium-term resistance – break above confirms strong bullish continuation
• Nearest support levels:
o $3,365: current Asian session low
o $3,345: strong support zone – EMA50 on H4 chart
o $3,305: last week's low – breakdown here may trigger deeper pullback
• EMA: Price remains above EMA09 and EMA50, suggesting a short-term bullish bias, though momentum is slowing.
• Candlestick / Volume / Momentum: Low volume in Asian session; H1 candles show indecision (doji with long wicks), signaling a tug-of-war between buyers and sellers.
📌 Outlook:
Gold may consolidate or dip slightly short-term unless it decisively breaks above $3,395 to confirm a new bullish leg.
________________________________________
💡 Suggested Trading Strategy:
SELL XAU/USD: ~3,392– 3,395
🎯 TP: 40/80/200 pips
❌ SL: ~3,398
BUY XAU/USD : ~3,366 - 3363
🎯 TP: 40/80/200 pips
❌ SL: ~3,360

Gold Breaks Support – Risk of Pullback Toward $3,310📊 Market Summary:
Gold prices initially rose on weaker-than-expected U.S. jobs data, which lowered Treasury yields and weakened the U.S. dollar. However, after breaking the key support at $3,365, gold continued to decline toward $3,354, and briefly touched $3,352, signaling rising technical selling pressure. Despite a 92% market expectation for a Fed rate cut in September, the technical breach increases the risk of a deeper correction.
📉 Technical Analysis:
• Key Resistance: Around $3,365–$3,370 – this zone now acts as short-term resistance; stronger resistance lies at $3,375–$3,380 if prices recover.
• Nearest Support:
The $3,365 level was broken.
New support is seen at $3,352–$3,350; a continued drop may bring prices to $3,335, and possibly toward $3,310–$3,300.
• EMA 09: Price is now below the 9-day EMA, suggesting a short-term bearish trend.
• Momentum / Volume / Candlestick:
RSI is near 50, slightly bearish; volume is tapering on the downside, indicating distribution.
Early signs of a head-and-shoulders (H&S) pattern are developing.
📌 Outlook:
Gold may continue declining in the short term if it stays below the $3,350–$3,352 zone.
A further drop toward the $3,335 – $3,310 region is possible.
If price rebounds and closes above $3,365, the bearish momentum could be neutralized.
💡 Suggested Trade Strategy:
🔻 SELL XAU/USD : $3,355–$3,358
🎯 TP: 40/80/200 pips
❌ SL: ~$3,361
🔺 BUY XAU/USD : $3,305–$3,302 (if price pulls back deeper)
🎯 TP: 40/80/200 pips
❌ SL: ~$3,299

Gold Extends Gains as USD Weakens📊 Market Overview:
Gold prices are extending their gains during the Asian and European sessions today, as the US dollar weakens following weaker-than-expected US jobs data. Rising unemployment and a softer Non-Farm Payroll report boosted expectations that the Fed may cut interest rates in September. The US 10-year Treasury yield also dipped slightly, supporting gold's safe-haven appeal.
📉 Technical Analysis:
• Key Resistance: $3,385 – $3,390
• Nearest Support: $3,365 – $3,370
• EMA: Price is trading above the EMA 09, indicating a short-term bullish trend
• Candles / Volume / Momentum: H1 candles show steady buying pressure with stable volume, but we should monitor potential profit-taking if price nears the $3,390–$3,400 zone.
📌 Outlook:
Gold may continue to rise in the short term if USD weakness persists and bond yields stay low. However, failure to break above $3,390 could lead to a pullback toward support levels.
💡 Suggested Trading Strategy:
🔺 BUY XAU/USD: $3,365 – $3,368
🎯 TP: 40/80/200 pips
❌ SL: $3,362
🔻 SELL XAU/USD : $3,392 – $3,395 (if reversal signal appears)
🎯 TP: 40/80/200 pips
❌ SL: $3,398

Gold Breaks Resistance – May Target $3400 Next📊 Market Overview:
• Gold continues to rally in early U.S. session as September rate cut expectations by the Fed rise due to weak jobs data.
• U.S. Dollar weakens and 10Y Treasury yield falls, supporting gold.
• Risk-off flows and long-term inflation concerns push safe-haven demand for gold.
📉 Technical Analysis:
• Key Resistance: $3,390–$3,400 (short-term breakout zone)
• Nearest Support: $3,365–$3,370
• EMA: Price is trading above EMA09 and EMA50, confirming bullish momentum
• Candles / Volume / Momentum: Consecutive bullish H1 & H4 candles above $3,375 confirm breakout. Volume increasing, suggesting strong buying pressure.
📌 Outlook:
Gold may continue rising toward $3,400 if current bullish momentum holds. However, short-term pullback or profit-taking near $3,395–$3,400 is possible after a rapid $50+ rally.
💡 Suggested Trade Setups:
🔺 BUY XAU/USD : $3,375–$3,378 (pullback buy)
🎯 TP: $3,395–$3,400
❌ SL: $3,372
🔻 SELL XAU/USD: $3,397–$3,400 (countertrend short)
🎯 TP: $3,375–$3,380
❌ SL: $3,403

Gold Continues Its Upward Momentum Despite Short-Term Pullback📊 Market Summary
• Spot gold slipped slightly by ~0.1% to around $3,354–$3,361/oz due to profit-taking after last week’s sharp rally following weaker-than-expected U.S. job data
• The U.S. added only 73,000 jobs in July, boosting expectations of a Federal Reserve rate cut in September, with a current market probability of around 81%
• Ongoing geopolitical risks, trade tensions, and robust central bank and ETF gold demand continue to support the long-term bullish outlook
________________________________________
📉 Technical Analysis
• Key resistance: ~$3,360–$3,370/oz (short-term highs, potential profit-taking zone).
• Nearest support: ~$3,330/oz (watch for buying interest on pullbacks).
• EMA09: Price is currently hovering around the short-term EMA (~EMA09), still below EMA50, indicating a mild sideways bias. According to Economies.com, gold hasn’t confirmed a stable uptrend above EMA50 yet
• Candlestick / volume / momentum:
o Today's candle shows mild profit-taking, but momentum remains bullish from the prior session. Volume shows light distribution, not strong selling.
________________________________________
📌 Outlook
• Gold may continue rising slightly in the short term if the upcoming U.S. inflation data (due August 12) remains soft, reinforcing the likelihood of a Fed rate cut
• Conversely, if the U.S. dollar strengthens unexpectedly or new data comes out more robust, gold could retreat back to the $3,330 zone.
________________________________________
💡 Suggested Trading Strategy
SELL XAU/USD : $3,370–$3,373
🎯 TP: 40/80/200 pips
❌ SL: $3,377
BUY XAU/USD : $3,330–$3,333
🎯 TP:40/80/200 pips
❌ SL: $3,327

GOLD REMAINS UNDER PRESSURE AFTER U.S. INFLATION DATA📊 Market Overview:
Gold is trading around $3294, down from $3311 earlier after U.S. Core PCE and Employment Cost Index came in as expected — reinforcing the Fed's hawkish stance. A stronger dollar and rising Treasury yields continue to weigh on gold.
📉 Technical Analysis:
• Key resistance: $3302 – $3305
• Nearest support: $3285 – $3275
• EMA09 (H1): Price is below the 9-period EMA → short-term trend remains bearish
• Candlestick / volume / momentum: After the sharp drop, price is consolidating between $3293–$3298 with low volume. Failure to break above $3302 may trigger further downside. RSI near 45 suggests room for more selling.
📌 Outlook:
Gold may continue to decline in the short term if it fails to reclaim $3302 and the dollar remains strong through the Asian and European sessions.
💡 Suggested Trade Setup:
🔻 SELL XAU/USD: $3296 – $3298
🎯 TP: $3280 / $3275
❌ SL: $3305
🔺 BUY XAU/USD: $3275 – $3278 (if reversal candle appears)
🎯 TP: $3295
❌ SL: $3270

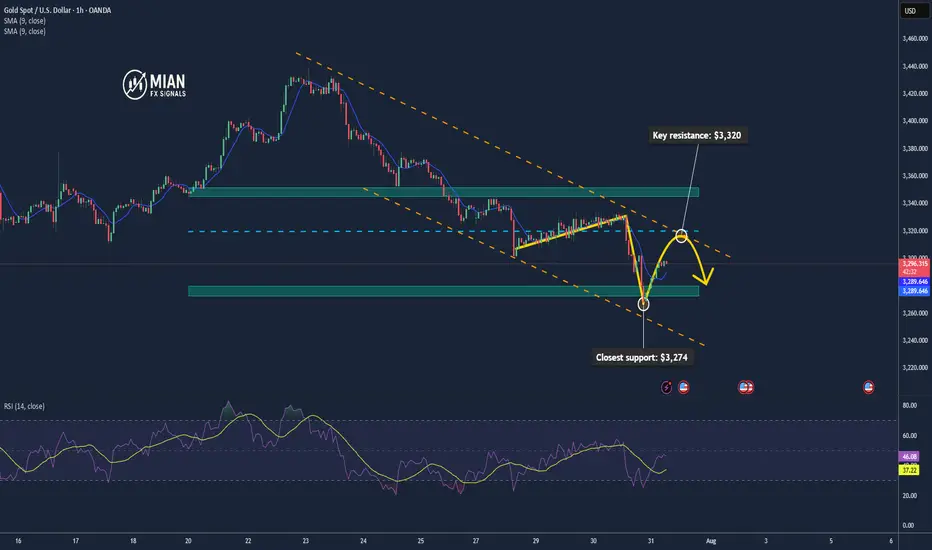
Gold May Rise Technically after Testing the $3,300 Zone📊 Market Overview:
Spot gold is trading around $3,295–$3,301/oz, influenced by slightly lower U.S. Treasury yields and a softer dollar tone. Analyst consensus from Reuters projects gold likely to stay above $3,220/oz through 2025 and possibly hit $3,400 in 2026 amid continued safe-haven demand
📉 Technical Analysis:
• Key resistance: $3,320 / $3,345
• Closest support: $3,274 – $3,280
• EMA09: Price is currently below the 9 period EMA on H1, indicating a short-term bearish bias.
• Candlestick / volume / momentum: There was a minor bounce from the support zone around $3,274, but volume remains low. RSI isn't oversold, suggesting room for technical pullback.
📌 Outlook:
Gold may experience a technical rebound if it holds above $3,280. A breakout above $3,320 would likely require clear catalyst—such as weak U.S. data or a dovish Fed tone.
💡 Suggested Trading Strategy:
SELL XAU/USD: $3,320 – $3,323
🎯 TP: 40/80/200 pips
❌ SL: $3,326
BUY XAU/USD: $3,279 – $3,282
🎯 TP: 40/80/200 pips
❌ SL: $3376
Gold May Dip Mildly Before US Data📊 Market Overview:
Spot gold is trading around $3,329/oz, up ~0.1%, supported by falling U.S. Treasury yields and a slightly weaker dollar, while investors await potential Fed dovish signals or rate cut in September . Meanwhile, easing U.S.–EU trade tensions weighed on safe-haven demand for gold.
📉 Technical Analysis:
• Key Resistance: ~$3,335–3,350 (recent highs and potential test zone)
• Nearest Support: ~$3,310 (previous stable support)
• EMA09 position: Price is above EMA9, indicating a mild bullish bias in the short term
• Momentum/Volume: RSI ~53 (neutral), MACD & StochRSI showing small buy signals. However, bullish momentum is fading, suggesting a possible mild pullback
📌 Conclusion:
Gold may dip modestly toward $3,310 if the dollar strengthens or if Fed rate-cut expectations recede. A break above $3,335–3,350 could pave the way for further gains, though current momentum remains insufficient to confirm a breakout.
💡 Suggested Trade Strategy:
SELL XAU/USD: $3,333–3,336
🎯 Take Profit: 40/80/200 pips
❌ Stop Loss: $3339
BUY XAU/USD: $3,310–3,308
🎯 Take Profit: 40/80/200 pips
❌ Stop Loss: $3305

Gold Buy SetupHi everyone
Hope you all had a good trading week so far, this is our buy setup we looking to see for Wednesday
Let us know in the comments what you think.
