Gold 4-hour timeframe analysisHi traders
In the 4-hour gold structure, following the break below the balance zone’s low, we can consider the entry of 4-hour sellers. The pullback zones for these sellers are at 4067 and 4090. The defined take-profit level for this time frame is 3773. As long as this balance remains intact (i.e., no 4-hour candle closes above the zone), the mentioned target will remain valid
Goldshort

XAUUSDHello Traders! 👋
What are your thoughts on Gold?
Gold has reached a key support zone after a sharp two-day drop.
From this area, we expect a corrective rebound toward the broken structure.
This retest could complete a pullback phase before the next wave of decline resumes.
A short-term rally toward the resistance zone is likely.
If price shows rejection there, the next downside targets are expected to follow.
As long as price remains below the red resistance zone, the bearish bias remains intact.
Look for bearish confirmation signals on lower timeframes before entering short positions.
Don’t forget to like and share your thoughts in the comments! ❤️

Gold 1H – Bearish Reaction After Consecutive Gains🟡 XAUUSD – Intraday Trading Plan | by Ryan_TitanTrader
📈 Market Context
After several sessions of steady gains, gold is showing signs of exhaustion as U.S. Treasury yields stabilize and traders reassess the Federal Reserve’s next move.
The market’s focus today is on U.S. housing data and Fed officials’ remarks, which could shape expectations for the December policy outlook.
• A hawkish tone from policymakers may strengthen the dollar and pressure gold lower.
• Conversely, softer remarks could briefly trigger buying around key discount zones, but the overall tone remains corrective after the recent rally.
Market liquidity is concentrated near the $4,230 area — where price may tap into unmitigated supply before continuing its bearish leg.
🔎 Technical Analysis (1H / SMC Style)
• Structure: The overall bias has shifted bearish following consecutive ChoCH and BOS formations.
• Premium Zone: The 4,230–4,228 area aligns with an H1 order block and previous liquidity pool — a prime zone for short re-entry.
• Liquidity Sweep: The recent upside push toward 4,230 may sweep late buyers before the next bearish leg unfolds.
• Discount Zone: Short-term liquidity may rest around 4,080–4,100, which aligns with previous sell-side imbalance (SSI) and acts as an intraday reaction zone.
🔴 Sell Setup
• Entry: 4,230 – 4,228
• Stop-Loss: 4,240
• Take-Profit Targets: 4,100 → 4,080 → 4,050+
🟢 Buy Scalp Setup (Short-Term Countermove)
• Entry: 4,081 – 4,083
• Stop-Loss: 4,074
• Take-Profit Targets: 4,100 → 4,115
(Only valid if liquidity sweep confirms reaction within discount zone)
⚠️ Risk Management Notes
• Confirm M15 BOS/ChoCH before entry — avoid blind orders during news.
• Reduce position size for scalp entries; primary directional bias remains bearish.
• Lock partial profits near first liquidity targets and trail stops as structure confirms continuation.
✅ Summary
Gold faces near-term correction pressure after multiple bullish sessions.
The 4,230–4,228 zone offers a clean premium OB entry for continuation shorts, while reactive buyers may scalp intraday from 4,081 if liquidity sweeps occur.
Stay adaptive — today’s sentiment is short-term bearish within a larger range-bound structure.
FOLLOW RYAN_TITANTRADER for daily SMC setups ⚡

Gold Trend Shift (4hr) Time frameDescription
✅ Trend Shift : Price broke the previous bullish structure — short-term bearish momentum confirmed.
🔹 Breaker Level : Previous swing high now acts as potential resistance on any retrace.
🔹 Demand Zone : Strong buyer interest around 4,000–4,050 — watch for bullish reversal signals.
📈 Potential Move :
1. Price may drop toward the demand zone.
2. Buyers reacting here could push price back to the breaker level.
3. Reclaiming the breaker could signal continuation toward next order block: 4,300–4,350.
⚡ Key Takeaways:
Monitor the demand zone for bullish confirmations.
Breaker retest = high-probability buy setup.
Risk management is essential — structure shows a clear shift from bullish → bearish.
#DYOR

Gold short Trade Idea Trend: Bullish
Divergence: Bearish
Reversal Pattern: Double Top
Bias: Bearish
Scenario: Entry at HL Breakout
Trade Plan
Stop Loss : 4405
Entry Level: 4175
TP: 3945

Gold sweeps SL, wait for BUY LIMIT at Demand Zone 4,223-4,225Timeframe analysis: H4/30M
Logic: Trend Continuation after liquidity sweep.
MARKET STRUCTURE ANALYSIS (SMC Analysis)
Main Trend: Bullish (Price is moving within a parallel channel).
Structure Confirmation (BOS): The chart has confirmed an upward Break of Structure (BOS), indicating that buyers are controlling the market.
Liquidity Sweep/Fake: The strong bearish candle (marked as "Fake") is a move to sweep Stop Losses of early buyers and gather liquidity before Smart Money pushes the price in the main direction. This is an Inducement action.
Key Demand Zone (POI/Demand Zone/Order Block): The TIMING BUY area (4,223.154 - 4,225.000) is a potential Demand Zone/Order Block identified by Smart Money. The price is expected to retest this area before continuing to rise.
MAIN TRADING SCENARIO (LONG SETUP)
SCENARIO: Wait for the price to Pullback to the POI area to enter a buy order, continuing the main bullish trend.
Parameter
Value
SMC Description
Action
BUY LIMIT
Place a pending buy order
Entry Zone (POI)
4,225.000 - 4,223.150
Demand Zone/Order Block after liquidity sweep.
Stop Loss (SL)
4,214.390
Place below the low of the liquidity sweep candle ("Fake Low"), ensuring safety.
Take Profit 1 (TP1)
4,240.000
Target the nearest Swing High.
Take Profit 2 (TP2)
4,250.000
Target psychological resistance and mid-channel.
Take Profit 3 (TP3)
4,260.000+
Target the upper boundary of the parallel channel.
R:R Ratio
Approximately 1:2.5 to 1:3.5 (Depending on TP)
Good R:R ratio for a trend-following trade.
RISK MANAGEMENT
Risk: Only risk a maximum of 1-2% of the account for this trade.
Breakeven: When the price hits TP1, move SL to the Entry point (Breakeven) to protect capital.
Invalidation: If the price closes the D1/H4 candle below the SL level (4,214.390), the buy plan will be invalidated.

TLDR: SELL Gold, BUY OilGold/oil ratio seems to be evolving in a band. We've had RSI divergences every time we touched the band predicting trend reversal. RSI Divergence playing out right now as we touch the seemingly relevant support.
- FX_IDC:USDWTI / FRED:WM2NS is at an all time low support level (1998, 2016, 2020)
- TVC:GOLD / FRED:WM2NS at an all time High (1983, oct 2011)
Gold/Oil ratio looks like a Big BUY to me. Enjoy \o/.

Gold 1H – Price Reaction Ahead of U.S. CPI DataXAUUSD – Intraday Trading Plan | by Ryan_TitanTrader
________________________________________
📈 Market Context
Gold prices remain steady around $3,975, as traders await the U.S. CPI data release later today — a key event that could shape expectations for the Fed’s next rate move.
If inflation cools, the dovish sentiment may boost gold’s safe-haven appeal; however, a hotter CPI print could trigger renewed dollar strength and short-term pressure on XAUUSD.
Market volatility is expected to spike near the release, so liquidity grabs and false breaks are likely before the true direction forms.
________________________________________
🔎 Technical Analysis (H1 / SMC Style)
• The recent Change of Character (ChoCH) confirms short-term bearish control after breaking the bullish structure near 4017.
• FVG Sell Zone (4015–4017) aligns with premium imbalance and prior liquidity — ideal for short setups if price retests that zone.
• BOS to the downside was confirmed at 3960, showing sellers in control.
• The discount zone 3908–3910 is a strong demand area where buyers may step in after liquidity sweep below 3910.
________________________________________
🟢 Buy Zone: 3908–3910
SL: 3900
TP targets: 3920 → 3940 → 3960+
🔴 Sell Zone: 4015–4017
SL: 4022
TP targets: 4000 → 3985 → 3970
________________________________________
⚠️ Risk Management Tips
• Wait for M15 ChoCH / BOS confirmation before entering either side.
• Use partial position sizing around CPI release — volatility may cause large wicks.
• Watch for liquidity hunts near 3980–3990 before CPI, then confirm structure direction.
________________________________________
✅ Summary
Gold is consolidating below key resistance while awaiting U.S. inflation data.
Smart money may engineer a liquidity sweep toward 4015–4017 (FVG) before resuming the bearish leg into 3910.
However, if CPI comes in softer than expected, buyers may defend 3908–3910, sparking a recovery back toward 3980+.
🔔 Stay alert around CPI release hours — expect manipulative price action and confirm structure breaks before committing to directional trades.

XAUUSD: Recovery after the correctionOANDA:XAUUSD After printing a new high at 4059 and retesting the prior high in yesterday’s session, gold came under clear selling pressure. A short-term downtrend has formed. For today’s session, the priority is to look for sell entry when price pulls back into the resistance zone. You can read my previous analysis here:
Today’s balance level: 3950 . If 3950 breaks to the downside, price may continue lower toward before a recovery develops.
📉 Analysis
The short-term structure has shifted to lower high/lower low (LH/LL) intraday , consistent with a tactical correction.
The zone is also a Margin Zone , containing significant CME liquidity and a cluster of Long-call contracts from prior sessions.
Key resistance:
Strong resistance:
Strong support:
📊 Trading Plan
Buy the dip:
Wait to buy at with confirmation.
Targets: first 3950, then .
Stop: below the M5 low of the signal candle. Move to BE at +1R.
Sell at resistance:
Watch reactions at .
If a clear rejection appears (rejection/engulfing), consider a sell entry for the next corrective with target is .
Stop: above the corresponding resistance, manage flexibly.
Please like and comment below to support our traders. Your reactions motivate us to produce more analysis in the future 🙏✨
Victor Dan @ ZuperView

XAUUSD 15m – EW Short SetupHi fellow traders,
On the 15m XAUUSD chart, I am applying Elliott Wave principles to outline a short setup. Price has completed wave (v) and is now retesting the Fibonacci cluster between the 0.618 and 0.88 retracement levels, which aligns with a potential reversal zone.
I am entering at the current price, with a Stop Loss at 4059.16, serving as the invalidation level. My Take Profit levels are set at 3991.32 (TP1), 3985.71 (TP2), and 3965.74 (TP3), targeting the projected completion of the next corrective leg.
If price moves above the invalidation level, this wave count is no longer valid.
Good luck and trade safe!

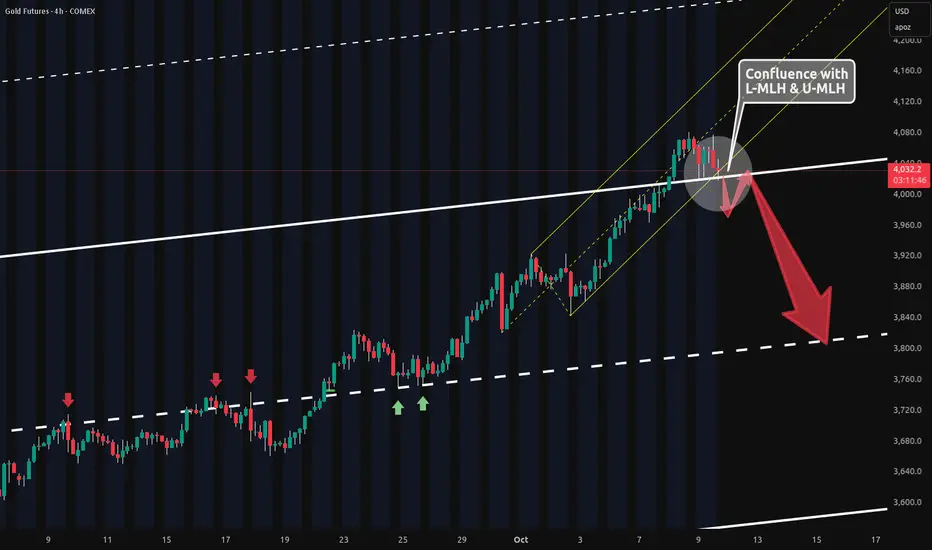
Gold 4h Potential Short Confluence🔱 Just wanted to highlight this confluence 🔱
The yellow L-MLH and white U-MLH are lining up to form a potential short setup.
Today’s selling pressure is also giving an early warning signal.
If we open and close below the white U-MLH, we’ll likely retest it before any major drop.
Shorting this move will require a decent stop, given the inherent volatility. So maybe a play with an Options Strategy would be a more secure way.
Let’s see if the party finally takes a breather.
XAUUSD: Momentum fades after new ATH, watching for a correctionOANDA:XAUUSD is currently facing strong selling pressure after printing a new high at 4059 and gapping down at the open , which reinforces the expectation of a correction in the coming sessions.
In addition, U.S. President Donald Trump recently stated that a deal to end the war in Gaza is “very close” and he may travel to Egypt later this week, as his envoys participate in talks aimed at a ceasefire and hostage-release agreement.
⇒ All factors are aligning for a pullback in gold.
As I analyzed in yesterday’s session, a large number of Longput contracts have been deployed by CME traders as protection against downside. You can read my previous analysis here:
Today’s plan: We will look for short , with a target at .
Resistance: ,
Key support:
Strong support:
This is a strong support zone with big liquidity concentration and is also where CME traders have placed a large cluster of Longput contracts.
Please like and comment below to support our traders. Your reactions motivate us to produce more analysis in the future 🙏✨
Victor Dan @ ZuperView

Gold BearishThere is a bearish change in character (15 min timeframe), and a short position is available considering that the price has pullbacked towards the supply zone.
Looking for the market to target at the 3945 - 3950 demand zone.

XAUUSD: A Correction Is Coming – Don’t Miss Out!Hey everyone, Kilian here!
Let’s dive into today’s XAUUSD analysis!
The price is currently moving within a clear upward channel, with price action testing the upper boundary. This could act as a dynamic resistance level, and if the price is rejected here, we might see a slight pullback, bringing the price back to the support zone at 3,900.
If buyers can successfully defend this support level, the bullish structure will remain intact, and gold could resume its move to higher levels. However, if the price breaks below the support, a deeper correction toward the lower boundary of the channel may open up a potential selling opportunity.
Keeping an eye on confirmation signals like engulfing candle patterns, strong rejection candles from support, or increased buying volume will help you time your entries for buying positions. That said, always prioritize risk management! Make sure to confirm the signals and implement a solid risk management strategy before entering a position.
What do you think about this move? Feel free to share your thoughts and strategies in the comments below!

Will Gold (Spot) Test $4,000/oz or Gold is Becoming UnsFall DownGold is Becoming Unstoppable
Made a New Record High of +3976.5
- But Will It Rise Further? Will it Test $4000 per oz?
or
- Will Fall Down From Here (The New ATHs) ?????
Taking reference from the Gold Futures Market
- Gold futures already & officially hit $4,000/oz for the first time in history.
- Generally, it is expected that the spot price & the futures prices converge as the contract expiration date approaches
- That means at expiry, gold spot & future must attain the same level
That means the spot might rise to 4000, or the future price might fall from 4000
The attached Gold mini future chart says that gold prices might fall from current levels

XAUUSD: Correction underway as selling pressure intensifiesOANDA:XAUUSD pushed through the Margin Zone toward 3976, a strong level with CME Longcall positioning—where selling pressure has begun to appear. I believe the upside objective for this leg has been met and the market is likely to enter a corrective phase in the near term. You can read my previous analysis here:
Momentum has clearly weakened, and selling pressure around has appeared.
CME traders have begun unwinding Longcall exposure , reinforcing the view that the advance may be nearing completion. However, Longput positioning has not increased materially yet, so the pullback may not accelerate immediately.
Key resistance:
Key support: ,
Contingency support:
Today’s plan:
Look for sell entries into and target the support zones below.
Confirmation: Wait for Quantum Vol-Delta at 5m timeframe to flag strong selling pressure before entering.
Stops: Place the stop above the resistance or above the most recent 5m timeframe swing high from the entry.
Please like and comment below to support our traders. Your reactions motivate us to produce more analysis in the future 🙏✨
Victor Dan @ ZuperView

XAUUSD: Reversal confirmationOANDA:XAUUSD had a significant correction immediately after establishing a new ATH at 3897 with strong bearish momentum, I assess that 3897 will be the top in the near future and the market will begin to correct from here. With the U.S. government currently shut down and the release time of the nonfarm data possibly delayed, it is highly likely that gold will not experience unusual volatility and will continue to correct to lower levels.
Price is currently trading below the trendline, and the bullish structure has been broken with heavy volume, while the rebound shows low momentum, indicating this is a strong break.
As I analyzed in yesterday’s session, CME traders have pushed a large number of long put contracts into the market to hedge against a decline. Therefore, price may continue to fall in today’s session as the nonfarm release is postponed. You can read my previous analysis here:
Resistance:
Support:
Strong support:
Trading plan: Look for sell entry at the resistance zone on the 5m timeframe when a reversal signal with large selling volume appears as indicated by Quantum Vol-Delta.
Place stop loss just above the nearest M5 swing high or above the resistance zone.
Move to break-even at 1R (R:R=1:1).
Please like and comment below to support our traders. Your reactions motivate us to produce more analysis in the future 🙏✨
Victor Dan @ ZuperView

XAUUSD Double Top Trend Bullish
Divergence Bearish
Reversal Pattern Double Top
Bias Bearish
Scenario Sell Stop at neckline breakout
Trade Plan
Stop Loss 3903
Entry Level 3845
TP1 3787

Gold Chart Update (XAU/USD)Quick breakdown:
Price ran a fakeout above resistance → liquidity grab before snapping back inside the channel.
Support held at mid‑channel demand, but momentum is fading.
RSI flashing bearish divergence (higher highs in price vs. lower highs in RSI).
Volume spike on the fakeout shows exhaustion at the top.
Watching for a trend re‑test rejection → potential short setup with clean R/R.
⚠️ Key Levels:
Resistance: $3855 – $3870 zone (fakeout area)
Support: $3793 demand zone
Break below = opens path to deeper pullback
🎯 Trade Idea:
If price rejects resistance again → short bias with stops above liquidity sweep highs.
If bulls reclaim and hold above resistance → invalidates short, flips bias back long.
Stay sharp - TVC:GOLD is setting up for a decisive move

XAUUSD: The last bull run?FXOPEN:XAUUSD keeps grinding higher, but the structure suggests this may be the last impulse of the current move. I expect price to complete the advance into the large liquidity pocket at before a sharper correction, as upside momentum has started to fade.
You can read my previous analysis here:
CME flow shows heavy long-call positioning around 3867. A failure back below 3867 would likely open a deeper pullback.
That said, there is still a Margin Zone/liquidity pool at actively traded by CME participants, so price may push through 3867 toward before reversing.
Watch 3828 (prior session POC) — price can react and bounce from 3828 without visiting the deeper supports.
Key support: ,
Margin Zone:
Trading Plan
Sell: Look for strong sell signals from Quantum Vol-Delta on the M5/M1 timeframes inside .
Buy: If price pulls back into the key supports, wait for Quantum Vol-Delta to confirm buyers returning → Enter on the candle close.
Risk management:
Stop loss: below/above the most recent 5m timeframe swing low/high or beyond the respective support/resistance zone.
Move to break-even at +1R (R:R = 1:1).
Please like and comment below to support our traders. Your reactions motivate us to do more analysis in the future 🙏✨

Gold XAUUSD Intraday Setup 26.09.2025Price is currently approaching the supply/resistance zone between 3757–3761, where multiple rejections and liquidity sweeps have previously occurred. The expectation is for sellers to step in within this region, making it a high-probability entry for shorts. The stop loss is set at 3774, just above the recent swing high and invalidation point, ensuring protection against a breakout scenario. The downside target is 3719, which aligns with the next significant support level and prior demand zone, offering a clean risk-to-reward structure. If price reacts as anticipated from the marked zone, we could see a sharp move down toward the target, making this setup attractive for traders looking to capitalize on bearish continuation.

Back to 3700 Before Breaking through 3800?Dollar remain strong from yesterdays fundamental's
A deep retrace t0 3700 would be appropriate before climbing up again.

XAUUSD: Continuation of the pullbackPrice failed to break the Asian session high at 3,753 (no candle close above it). As a result, a deeper correction is likely before any new advance. The pullback targets are , and if extended, .
📉 Analysis
Wait for an Easy Trend sell signal on a break below the trendline with big volume.
Key resistance: , .
Key support: , , .
📊 Trading Plan
Wait for an Easy Trend confirmation when price breaks the trendline to the downside on strong volume, first target is 3717.
Example (SIGNAL): On 15m timeframe, price breaks the trendline with high volume — enter on the candle close, with the stop below the most recent swing low.
Risk management: Place the stop above/below the nearest 5m swing high/low, move to break-even at 1R (R:R = 1:1).
Please like and comment to support our traders. Your feedback motivates us to produce more analysis in the future 🙏✨
