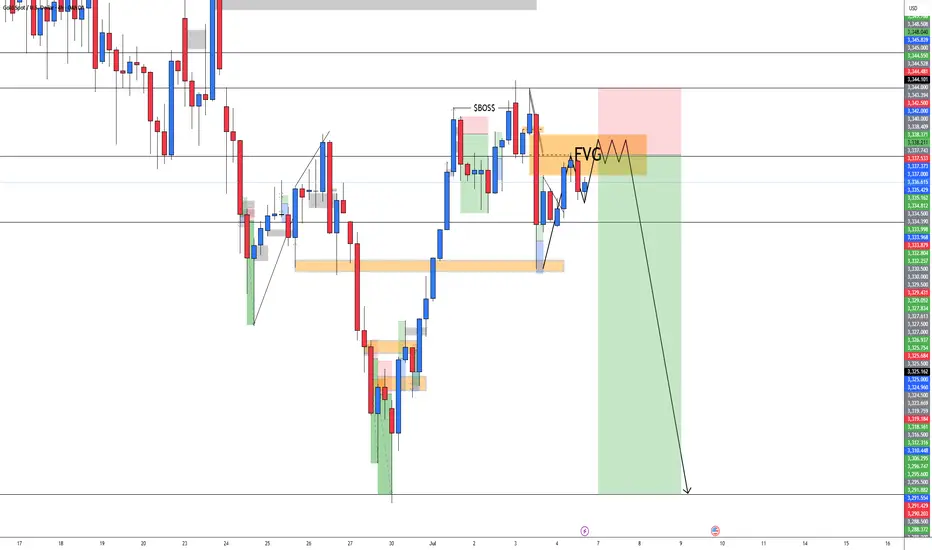
XAUUSD BEARISHAccording to the SMC and FVG concept, I am seeing bearish momentum in Gold. We have to wait for the proper rejection from FVG to sell the GOLD.
Goldshort
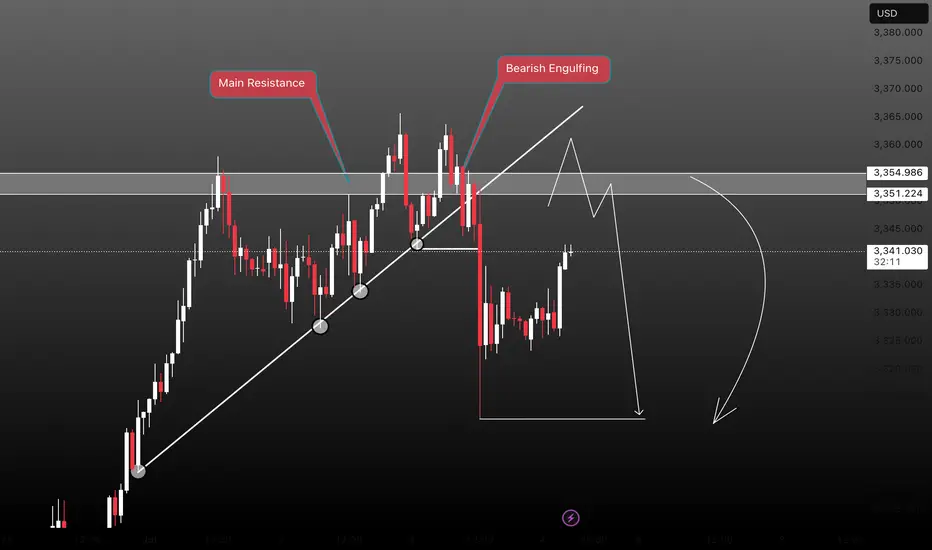
GOLD SHORT TRADEH1 TIMRFAME
1st Zone GOLD SHORT TRADE AT MAIN RESISTANCE AND ENGULFING ZONE
2nd Zone GOLD SHORT TRADE TLBP PULLBACK SELL AT SELL TRENDLINE
1st Signal : GOLD SELL MAIN RESISTANCE 3351- 3355
Stoploss : 3360
TP Level - 3345, 3340, 3335, 3330
2nd Signal : GOLD SELL TLBP PB TL 3360 - 3366
Stoploss : 3372
TP Levels - 3355, 3350, 3345, 3340, 3335, 3330
Manage Your Trade Properly
XAUUSD (GOLD): Sell setupXAUUSD (GOLD): Sell setup. It is ready for a sell, it will open in Asian session, and also market is complex now, but here is my plan.
Cheers

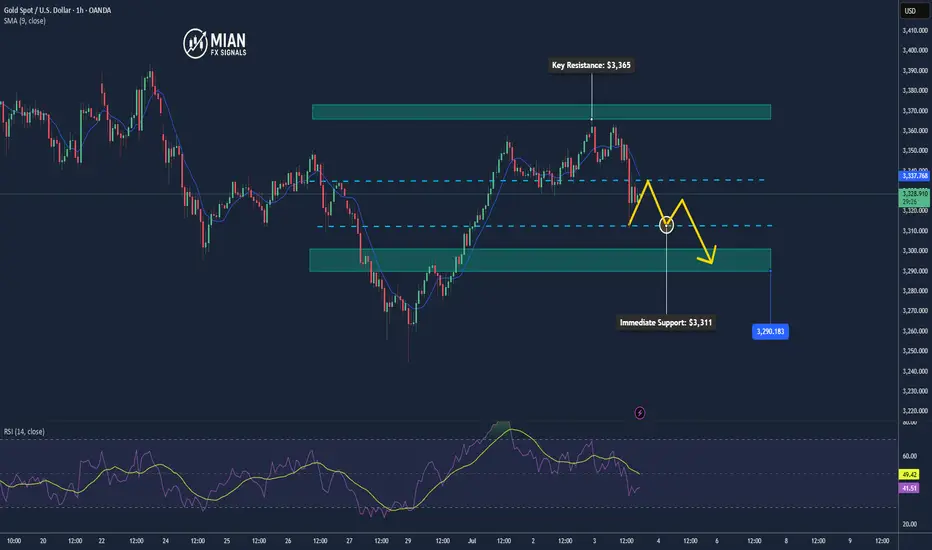
Gold Drops as NFP Beats, USD Gains📊 Market Overview:
• June’s Non-Farm Payrolls came in stronger than expected at +147K (vs 110K forecast), with unemployment ticking down to 4.1%.
• The US Dollar surged (DXY up ~0.5%) and Treasury yields rebounded following the release.
• Gold dropped sharply after the report, hitting a session low of $3,311 and is now trading around $3,328.
📉 Technical Analysis:
• Key Resistance: $3,364
• Immediate Support: $3,311
• EMA 09 (H1): Price is below the 09 EMA → confirms short-term bearish trend.
• Pattern / Momentum: A bearish engulfing candle near $3,364 signaled strong seller control. The failure to bounce afterward suggests persistent bearish pressure. RSI is tilting lower, confirming weakening momentum.
📌 Outlook:
Gold may continue to decline toward the $3,300–$3,290 area if USD and yields remain firm, especially if upcoming US data (such as ISM Services PMI) also supports the dollar strength.
💡 Suggested Trade Setup:
🔻 SELL XAU/USD at: $3,333 – $3,335
🎯 TP: $3,300
❌ SL: $3,339
🔺 BUY XAU/USD at: $3,293 – $3,290
🎯 TP: $3,330
❌ SL: $3,287
XAUUSD 4H SHORTPrice broke out of the bearish trend line and moved sideways in a range forming two tops or a double top.
Fundamentally, US jobs data came out positive keying into hawkish tone on interest rate and influenced CPI.
Price broke the neckline after 4H closure giving signal for bearish move to $3250 support.
Here’s my little idea on GOLD. Follow for more.

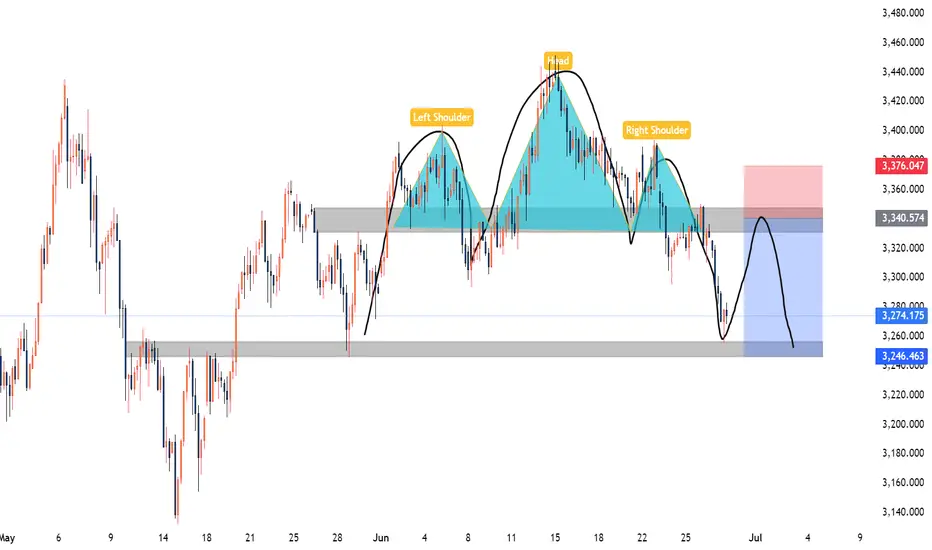
XAUUSD Weekly Analysis 30 June 4 July 2025Gold has formed a Head and Shoulders (H&S) pattern on the H4 timeframe. While the pattern is not perfectly symmetrical, it is still valid and clearly recognizable. The price has broken below the neckline, confirming a potential shift in market structure to the downside.
Analysis Insight:
The 3340–3350 area, previously a support zone, is now acting as resistance following the neckline break. A pullback to this zone may present a high-probability short opportunity for swing traders, especially if price shows rejection or bearish structure in that zone.
Trade Type: Swing
Trade Setup – Sell on Retracement:
Bias: Bearish on confirmation of retracement rejection
Entry Zone: 3340 – 3350
Stop Loss: 3376 (above right shoulder/high)
Take Profit: 3320/3300/3285/3260
Risk-Reward Ratio: Approximately 1:2
Kindly follow, share, like, support and comment.
Gold May Pull Back After Day’s High📊 Market Overview:
• Gold is currently trading around $3,350/oz, with the daily high at $3,366/oz.
• The rally stalled as traders took profits near the session high, while a slight rebound in the USD and rising U.S. Treasury yields weighed on gold’s momentum.
📉 Technical Analysis:
• Key Resistance: ~$3,366 (today’s high), with next level at ~$3,375–3,380 if breached.
• Nearest Support: ~$3,342 (intra-day low), stronger support seen at $3,329–3,330.
• EMA 9/21: Price is hovering near the EMA21 (~$3,350); this area is crucial to determine the short-term trend.
• Candle/Momentum Indicators:
o RSI is around 53-55, signaling a neutral stance;
o MACD shows weakening bullish momentum after hitting resistance.
📌 Viewpoint:
Gold may see a minor pullback in the short term, possibly testing the $3,342–3,329 zone after reacting to the daily high. However, if it holds above EMA21 and EMA50, the medium-term bullish trend remains intact.
💡 Suggested Trading Strategy
SELL XAU/USD at: $3,363–3,366
🎯 TP: 40/80/200 pips
❌ SL: $3,370
BUY XAU/USD at: $3,329–3,332
🎯 TP: 40/80/200 pips
❌ SL: $3,325

Gold may need to retreat to around 3300 againYesterday, the gold rebound stopped at around 3358, and then began to retreat. After that, it even failed to stand above 3350 during the rebound process, which to a certain extent hit the confidence of the bulls;
At present, gold has retreated to the area near 3330 again. Although gold has fallen slowly, the center of gravity of gold is still shifting downward in the short term, and the trading volume of gold is gradually increasing when it is falling, so I think the short position may not be over, and the 3330 area may be broken at any time; and the support area that really deserves our attention is first the 3320-3315 area, followed by the 3300-3295 area;
From the current gold structure, I think gold may still test the area near 3300 again before rising. Only after gold retreats to the area near 3300, it is possible to build an A-B-C head and shoulders bottom structure at the technical level (as shown in the figure), which can also help gold build a complete and effective rising structure, so gold has the need to retreat to the area near 3300 to build a right shoulder structure.
Therefore, I think shorting gold is still the first choice for short-term trading at present; you can consider shorting gold in the 3335-3355 area, looking at the target area of 3320-3310-3300.

Short-term opportunities are imminent.Gold prices have continued to rebound recently and have reached around 3358, but there is a lack of effective retracement during the rise, and the risk of short-term chasing has increased significantly. From a technical perspective, the US dollar index has a demand for a corrective rebound after a rapid decline, and it is expected to form a significant suppression on gold in the short term, limiting the rebound space of gold prices. From a capital perspective, the previous high-level long chips have gradually been untied and started to leave the market with profits, and selling pressure has gradually emerged; short positions may be re-arranged after completing concentrated stop losses, and the market structure is quietly changing.
Based on the above factors, it is recommended that traders remain patient and continue to hold short positions, focusing on the support of the 3335-3325 area. Be sure to control your position during the operation, strictly set stop losses, and avoid the high risks brought by chasing the rise. The core of trading is to follow the trend, respect the market rhythm, and wait for the adjustment to be confirmed before intervening.
Steady trading can only make long-term profits. Welcome everyone to share and communicate to improve the operation level together.

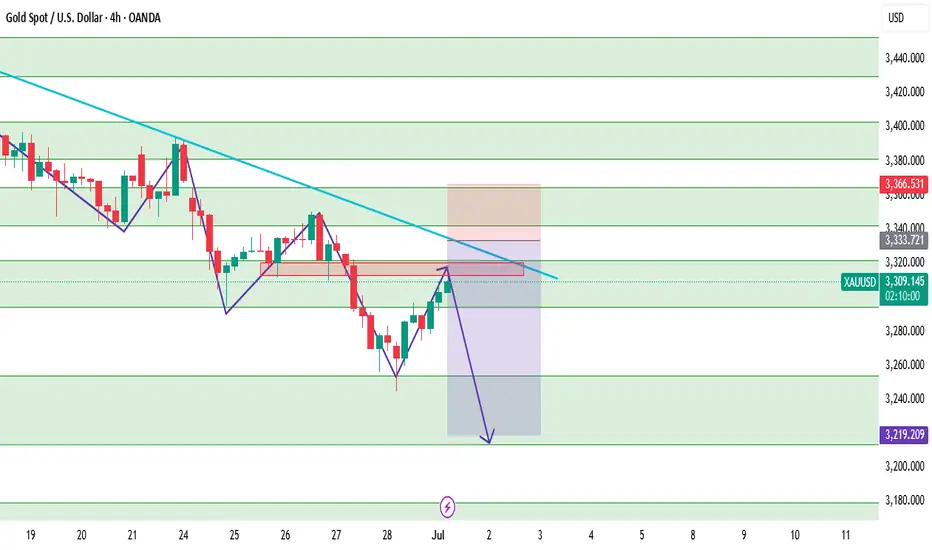
XAUUSD – Technical Outlook 4HXAUUSD is currently undergoing a corrective move after last week's bearish continuation. Price is now testing the minor resistance zone of 3295–3322, and could potentially extend the correction to test the descending trendline near 3333–3342.
The overall market structure remains bearish, with lower highs and lower lows clearly intact. Price has yet to break above the dynamic resistance trendline or the key swing high at 3366 — making any bullish move at this stage corrective, not a reversal.
Unless we see a strong bullish break and close above 3366, we expect sellers to return once price reaches the trendline or supply area around 3333–3342.
📌 Trade Plan (Sell on Pullback)
Sell Limit: 3333–3342
SL: 3368
TP1: 3296
TP2: 3255
TP3: 3220
📊 Key Levels:
R2: 3342
R1: 3322
Pivot: 3295
S1: 3254
S2: 3214
S3: 3180
Summary: Wait for bearish confirmation at the supply zone before entering. Bias remains bearish until proven otherwise by a structural break above 3366. Use smaller lot size or scale in slowly if price approaches the sell zone with weak bullish momentum.
Short gold, it will fall again when encountering resistanceIn the short term, gold retreated to around 3274 and then rebounded again, and it is only one step away from 3300. Will gold regain its bullish trend again?
I think it is difficult for gold to break through in the short term. Although gold retreated to around 3274 and successfully built a double bottom structure with the second low point and the low point of 3245, it only increased the rebound space; it is not enough for gold to regain its bullish trend. Since gold fell and broke through, the confidence of bulls has been hit hard. The previous support at the technical level has formed a strong resistance area after the top and bottom conversion, and to a certain extent helped the short force. In the short term, gold faces resistance in the 3310-3320 area. Before gold breaks through this area, the short energy still has the upper hand.
Therefore, shorting gold is still the first choice for short-term trading.
It is appropriate to consider shorting gold in batches in the 3300-3320 area, and look at the target: 3385-3375-3365

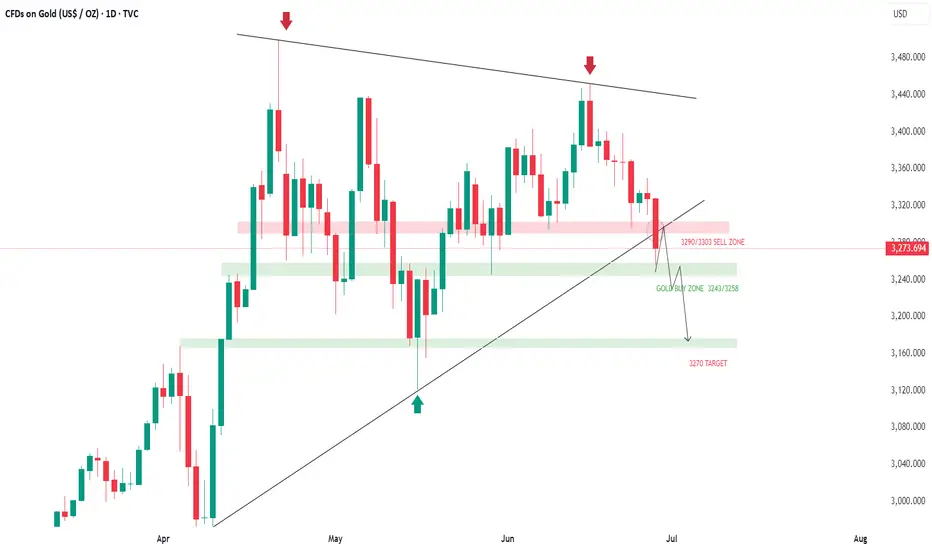
GOLD DAILY OUTLOOK | BEAR MARKET STRUCTURE CONFIRMED 📉 Trend Reversal Underway – Prepare for Lower Levels
The daily structure on Gold (XAUUSD) confirms a shift from accumulation to distribution.
Here's what stands out:
🔻 Key Breakdown Factors:
Failure at O_FIB Rejection Zone
The price failed to sustain above the upper Fib extension and supply zone (marked in red). Multiple attempts at reclaiming this level have resulted in sharp rejections, signaling exhaustion of buyers.
Break of Mid-Range Structure
We've decisively closed below the range midpoint, with strong bearish daily candles. This confirms loss of control by bulls and opens the door for a move toward deeper retracement zones.
Support Zones Exposed
The 0.618 FIB & 100 MA area around ~3160 is now a primary target. This zone held previously, but repeated touches weaken structure.
The 1.0 FIB & 200 MA zone around ~2960 is the macro support target. If sentiment continues to deteriorate, this will be the magnet.
EMA Crosses Rolling Over
Price has decisively lost the 9/21 EMA zone. Until a daily close reclaims this zone (~3335+), bearish momentum remains valid.
📉 Bearish RSI Momentum
While not a primary signal, RSI confirms momentum divergence and bear control below the midline. No sign of reversal.
🎯 Bearish Bias Until Reclaim of 3335 Zone
📌 Next Target = 3160, then 2960
🛑 Invalidation = Daily close above 3340 with strong volume and reclaim structure
This is not a short-term pullback — it's the beginning of a deeper correction. Gold is no longer in the “safe-haven” trade. Be patient, position with structure, and let the trend do the work.
Focus will be on fading the traps on pullbacks into structure.

gold bearish trading ideagold bearish trading idea gold breakdown traingle now gold next move [possible to sell target 3170
Gold Drops Sharply – Breaks Below the $3,300 Support📊 Market Overview:
Gold has plunged to $3,290/oz, breaking the key psychological level of $3,300 as the US dollar strengthened and Treasury yields ticked higher. Market sentiment has turned defensive ahead of Friday’s US PCE inflation data, with expectations that the Fed may maintain its hawkish stance for longer.
📉 Technical Analysis:
• Key Resistance: $3,310 – $3,325
• Nearest Support: $3,285 – $3,272
• EMA09: Price is currently below the 9-period EMA, confirming short-term bearish momentum.
• Candlestick / Volume / Momentum:
o H1/H4 charts show a series of long bearish candles, with rising volume → strong selling signal.
o RSI is approaching oversold levels (~28), MACD remains in a widening bearish divergence → downward pressure is still dominant.
📌 Outlook:
Gold is in a clear downtrend and may extend its decline toward $3,285 – $3,272 unless a reversal is triggered by weaker-than-expected PCE data or renewed geopolitical tensions. In the near term, any technical rebound is likely to offer sell opportunities rather than a trend reversal.
💡 Suggested Trade Setup:
🔻 SELL XAU/USD
• Entry: $3,300 – $3,305 (on technical retracement)
• 🎯 TP: $3,285 – $3,272
• 🛑 SL: $3,315
🔺 BUY XAU/USD (high risk)
• Entry: $3,272 – $3,277 (short-term bottom catching)
• 🎯 TP: $3,295 – $3,305
• 🛑 SL: $3,262

GOLD - XAUUSD Bear Flag PatternVery simple and clean chart with Bear flag pattern. If it breaks then hoping for retrest of 3300 area or more down.

The downward trend is strong.The easing of the situation in the Middle East weakens the demand for safe havens
The direct trigger for the decline in gold prices was the news that Israel and Iran announced a ceasefire. This news quickly cooled the market's risk aversion, and the attractiveness of gold as a traditional safe-haven asset weakened. In the past few weeks, the military confrontation between Israel and Iran once pushed up the safe-haven buying of gold, but with the conclusion of the ceasefire agreement, the market quickly turned to risk preference mode, global stock markets rose, and the US dollar fell. This change in market sentiment directly led to the decline in gold prices.
This decline will still intensify, pay attention to your trading orders, I will continue to update this article, I wish you a smooth trading.

The current price of gold is 3330-3335, go short directly!Gold rebounded after hitting the bottom of 3295. At present, gold is just a rebound, not enough to reverse directly. Gold rebounds and continues to be short. After all, the daily line has fallen continuously, so the short momentum of gold is still there. In the short term, the rebound of gold is just a repair after oversold. Gold is currently priced at 3330-3335 and is directly short.
The 1-hour moving average of gold continues to be arranged in a short position downward. After gold fell below the previous low of 3340 yesterday, gold has not been able to rebound again. In the short term, 3340 has become the key to long and short positions. In the short term, gold rebounds below 3340 and continues to be shorted. If gold breaks through and stabilizes at 3340 again, then gold may start to fluctuate again. Before breaking through 3340, gold is still weak and continues to maintain a short trend.

Gold Trading Analysis and Strategies for Sideways Decline MarketAfter Trump announced a comprehensive ceasefire agreement between Israel and Iran, market risk aversion significantly cooled, and gold prices plunged by more than $30 in early trading. Although the stability of the ceasefire agreement remains doubtful, the rebound in risk appetite has dominated market trends, with stock markets rebounding, oil prices falling, and demand for safe-haven assets declining.
From a technical perspective, the moving average system on the daily chart of gold shows an intertwined state, indicating a relative balance between bulls and bears. The current key resistance above is near 3350, which is an important psychological threshold. If effectively broken, it may open up upward space; the lower support is focused on the 3285-3290 range, which is the lower edge of the May consolidation platform. A break below this level may intensify correction pressure. The loss of the midline in the 4-hour chart further confirms the short-term weak structure, providing technical support for the downward trend.
XAUUSD
sell@3330-3340
tp:3320-3310
buy@3285-3290
tp:3310-3320
Investment itself is not the source of risk; it is only when investment behavior escapes rational control that risks lie in wait. In the trading process, always bear in mind that restraining impulsiveness is the primary criterion for success. I share trading signals daily, and all signals have been accurate without error for a full month. Regardless of your past profits or losses, with my assistance, you have the hope to achieve a breakthrough in your investment.

Gold Pulls Back to 3332 Before Mild Rebound📊 Market Overview:
This morning, gold dropped sharply to $3,332/oz, marking the lowest level in recent sessions, due to profit-taking after the early-week rally and a slight recovery in the USD.
However, dip-buying interest returned near key support, pushing the price back up to around $3,350/oz.
The market remains sensitive to Middle East geopolitical headlines and comments from Fed officials scheduled throughout the week.
📉 Technical Analysis:
• Resistance: $3,360 – $3,370
• Support: $3,332 – $3,340 (tested this morning)
• EMA 09: Price is currently below EMA09 ($3,355) → short-term trend remains slightly bearish
• Momentum / Volume / Candlesticks:
o H1 candle shows a bullish hammer formation at $3,332 → signal of potential short-term rebound.
o RSI recovered from oversold (<30) to ~42 → mildly positive signal.
o StochRSI indicates short-term buying pressure, but a break above $3,355 is needed to confirm a reversal.
📌 Outlook:
Gold may see a mild recovery toward the $3,360–3,370 area if buying interest holds near the $3,330 support. However, failure to break above $3,370 could lead to a pullback during the US session.
💡 Suggested Trading Plan:
🔻 SELL XAU/USD at: $3,365–3,370
🎯 TP: $3,345 (~20)
❌ SL: $3,375
🔺 BUY XAU/USD at: $3,332–3,340
🎯 TP: $3,355 (~20)
❌ SL: $3,325

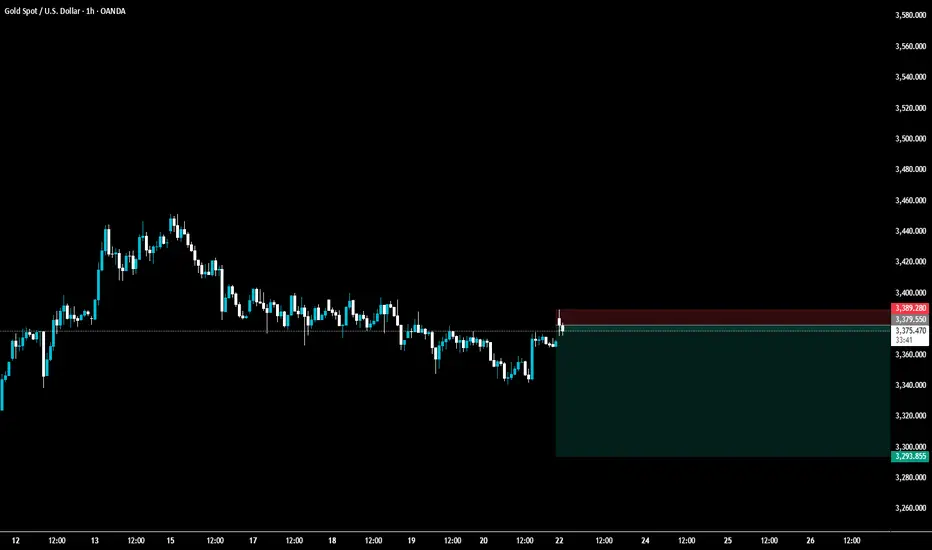
Gold Weekly Friday Trend Analysis and Trading RecommendationsOn Thursday, gold maintained a sideways trend, currently trading near $3,370. It hit a low of $3,347 and then rebounded immediately, while yesterday's Federal Reserve interest rate decision had little impact on market volatility. Since Monday, when bearish forces were stronger than bullish ones, the gold market has been seeing equalized bullish and bearish forces, consolidating as it waits for the next stimulus direction.
Once it stabilizes above $3,400 again, there is likely to be an inflection point, and it will gradually rise to test the upper track at $3,460–3,470. At the 4-hour level, it is currently under pressure at the middle track of $3,405, with support at $3,345.
Gold may break out of the current range on Friday. Intraday trading can focus on range operations between the support of $3,345 and the resistance of $3,400: when the gold price stabilizes above $3,360, you can lightly go long, with targets sequentially at $3,375 and $3,395; if it is resisted below $3,395, you can try to lightly go short.
XAUUSD
buy@3350-3360
tp:3380-3390-3400
Investment itself is not the source of risk; it is only when investment behavior escapes rational control that risks lie in wait. In the trading process, always bear in mind that restraining impulsiveness is the primary criterion for success. I share trading signals daily, and all signals have been accurate without error for a full month. Regardless of your past profits or losses, with my assistance, you have the hope to achieve a breakthrough in your investment.

XAU/USD Bullish Breakout from Flag PatternBullish Flag Formation: The price consolidated in a downward-sloping flag after a sharp bullish move. A breakout has occurred, signaling renewed buying pressure.
Support Zone: The breakout aligns with the horizontal support area around 3,392, reinforcing the bullish bias.
Upside Targets: Based on price structure and measured move projection:
First target: 3,435 – 3,452
Final target zone: 3,500+
Momentum Confirmation: The Ichimoku cloud supports bullish continuation as price trades above it, showing strong upward momentum.
Conclusion:
Gold appears to be resuming its uptrend after a brief consolidation. As long as price holds above the breakout level (around 3,392), the bullish targets remain valid. Ideal scenario for continuation traders looking for entries on minor pullbacks

Hold on to the high point and go short decisively!Gold closed the weekly line today, maintaining the idea of oscillating downward. The 4H consecutive negatives tested the support of the lower Bollinger track. Although it was roundabout and saw-sawed, every decline would be accompanied by a new low. Therefore, hold the high point to see the bottom break and accelerate. The lower side will gradually look to 3338 and 3315. Among them, 3315 is a strong support for the weekly line. If it is not broken, you can consider going long; the upper rebound pressure is 3361 and 3375. In terms of operation, short according to the rebound strength, and the specific points are subject to the bottom 🌐 notification.
Operation suggestion: Short gold in batches near 3361-3375, with a target of 3350-3340.
