Gold Price Analysis – Key Support and Resistance LevelsThis chart outlines the key support and resistance levels for gold prices. The Key Resistance Level at 5,431.175 is a potential rejection zone, where price may face resistance. The Support Zone at 5,040.060 is being tested, and if price holds, a bounce or reversal is expected. The Critical Support at 4,949.972 is a key level for a potential bullish reversal. The Extreme Support at 4,497.334 represents a significant reversal area where price is likely to find strong support. Traders should monitor these levels for price action to confirm potential movements
Goldsignals

XAU/USD | Gold At a Critical Short-Term Decision Zone!By analyzing the #Gold chart on the 30-minute timeframe, we can see that right after our last analysis, gold moved higher again and delivered more than 1,500 pips of profit, pushing price up to $5,047. Gold is now trading around $5,012.
If price fails to hold above $5,050 within the next 4 hours, we can expect a deeper pullback. The downside targets for this correction are $4,999, $4,990, and $4,960. On the other hand, if gold manages to stabilize above $5,050 within the next 4 hours, we can expect further upside in the short term, with targets above $5,080.
Please support me with your likes and comments to motivate me to share more analysis with you and share your opinion about the possible trend of this chart with me !
Best Regards , Arman Shaban

Gold at Key Resistance — Is This the End of the Correction?Gold( OANDA:XAUUSD ) is currently moving near its resistance zone($5,191-$5,097).
From an Elliott Wave perspective, it appears Gold is completing the microwave 5 of the main wave C, with the corrective upward structure likely a Zigzag correction (ABC/5-3-5).
Also, we can see a negative Regular Divergence(RD-) between two consecutive peaks.
I expect that upon entering the resistance zone($5,191-$5,097), gold will likely resume its decline and reach at least the targets I’ve identified on the chart.
First Target: $4,953
Second Target: $4,827
Third Target: $4,703
Stop Loss(SL): $5,221
Points may shift as the market evolves
What’s your view on gold’s trend this week? I’d be happy if you share your thoughts in the comments!
💡 Please respect each other's opinions and express agreement or disagreement politely.
📌 Gold Analyze (XAUUSD), 1-hour time frame.
🛑 Always set a Stop Loss(SL) for every position you open.
✅ This is just my idea; I’d love to see your thoughts too!
🔥 If you find it helpful, please BOOST this post and share it with your friends.

XAUUSDHello Traders! 👋
What are your thoughts on GOLD?
After a strong bearish rejection from the previous high, Gold entered a deep corrective phase and declined into the highlighted demand zone, where strong bullish reaction and buyer participation were observed.
Subsequently, price formed a higher low, signaling the development of a bullish structure, and is currently trading above the ascending trendline.
At the moment, price is testing a key resistance area .
As long as Gold holds above the rising trendline and the identified support zone, the overall outlook remains bullish, and price has the potential to advance at least toward the marked upside target.
Currently, price has entered a trading range, and it is now trading near the upper boundary of this range. From here, two main scenarios are in focus:
Scenario 1: A confirmed breakout above the range high could trigger a continuation toward the specified upside target.
Scenario 2: Price may correct toward the range support area, and from there, buyers could step in again and push price higher.
Therefore, waiting for confirmation is essential before entering any position, while proper risk management remains key.
Don’t forget to like and share your thoughts in the comments! ❤️

XAUUSDHello Traders! 👋
What are your thoughts on GOLD?
After a strong and sharp bullish rally, Gold faced a severe bearish correction, dropping significantly from recent highs. However, the market has shown a positive reaction, recovering a portion of the losses. Currently, price is moving within a rising channel.
As long as the marked support zone holds, our bias remains bullish.
We anticipate some consolidation and fluctuation in this area before the price gathers momentum to resume the uptrend.
What are your thoughts? Will the support hold? Let me know in the comments!
Don’t forget to like and share your thoughts in the comments! ❤️
XAUUSD Bearish Rejection from Resistance – Liquidity Sweep BeforGold (XAUUSD) is currently trading inside an ascending structure, respecting a rising trendline that has supported price since early February. Price has now reached a key resistance zone around 5,115 – 5,197, where a potential liquidity sweep and smart money distribution may occur.
The projected path shows a short-term bullish push into the resistance to grab buy-side liquidity, followed by a strong bearish reversal. A break below the ascending trendline would confirm market structure shift (MSS) and open downside targets toward 4,800 and potentially 4,450.
This setup aligns with Smart Money Concepts (SMC):
Buy-side liquidity resting above resistance
Premium pricing zone
Possible distribution before markdown phase
Bias: Bearish after liquidity grab
Confirmation: Trendline break + bearish displacement
Targets: 4,800 → 4,450

XAUUSD Triangle targeting 4730Gold (XAUUSD) has been trading within a short-term Triangle pattern, with the 1H MA200 (orange trend-line) as its Resistance and the 4H MA200 (red trend-line) as its Support. Having hit the 1H MA200 right on the Lower Highs trend-line, we expect the pattern to start now its new Bearish Leg.
Based on the previous one it could hit the 0.886 Fibonacci retracement level, which falls under the 4H MA200. Our Target is a potential contact with the latter at $4730.
---
** Please LIKE 👍, FOLLOW ✅, SHARE 🙌 and COMMENT ✍ if you enjoy this idea! Also share your ideas and charts in the comments section below! This is best way to keep it relevant, support us, keep the content here free and allow the idea to reach as many people as possible. **
---
💸💸💸💸💸💸
👇 👇 👇 👇 👇 👇

Gold Technical Outlook - Key Levels & OutlookGold is still bullish and making higher lows and respecting the rising trendline which shows buyers are in control. Right now price is consolidating just below 5086 resistance in a small wedge this usually means the market is building pressure for a breakout not reversing. As long as gold stays above the 5000-4990 support area the price favors a move up toward 5247 and possibly 5300+. Only a clear break below the trendline would open the door for a deeper pullback toward 4925-4875.
Trade Plan
Buy Zone: 5000 – 4990
Buy Trigger: Strong bullish H1/H4 close from the zone or breakout close above 5086 with continuation
Targets: 5086 → 5247 → 5300-5340
Invalidation: H4 or Daily close below 4,925 or clear break of rising trendline
Note
Please risk management in trading is a Key so use your money accordingly. If you like the idea then please like and boost. Thank you and Good Luck!

SILVER (XAGUSD): Gap Will Be Filled Soon
I think that Silver will fill a gap up opening soon.
A breakout of a rising trend line on an hourly time frame
indicates a local change of the market sentiment.
Goal - 78.14
❤️Please, support my work with like, thank you!❤️
I am part of Trade Nation's Influencer program and receive a monthly fee for using their TradingView charts in my analysis.

XAUUSD Intraday Plan | Stuck Between LevelsWe got our 5078 target yesterday, but there was no confirmed break above. Price is now trading between 4981 and 5078, stuck in a range. We’ll need to see one of these levels break for clearer direction.
Price is currently supported by both the MA50 and MA200. If bulls can clear 5078, the next upside focus shifts to the 5202 key resistance.
On the downside, if 4981 gives way, watch the support zone for a potential reaction.
📌Key levels to watch:
Resistance:
5078
5202
Support:
4981
4871
4732
👉 Let key levels guide your decisions — wait for confirmation and manage risk accordingly.

XAUUSD (Gold) – 30M Price Action & Key LevelsGold is trading within a corrective phase after breaking below the ascending channel. Price is currently reacting from a well-defined support zone, while the overall structure suggests bullish continuation if this support holds. A sustained move above the resistance zone may confirm strength and open the path toward the marked upside target.
Trend: Overall bullish structure, short-term correction completed
Support Zone: 4,850 – 4,870 (strong demand, price reacting upward)
Resistance Zone: 5,000 – 5,030 (key supply area)
Breakout Level: Above 5,030 (bullish confirmation)
Target 1: 5,060 – 5,080
Target 2: 5,160 – 5,170 (final upside target)
Invalidation: Daily/30M close below 4,840
Bullish as long as price holds above support; breakout above resistance may trigger strong upside momentum.
This analysis follows TradingView chart rules using price action, trend structure, and key support/resistance zones. For educational purposes only.

Support Hold & Continuation Toward Premium ResistanceChart Analysis
On the 1H timeframe, Gold is showing a bullish continuation setup after a corrective phase.
Market Structure
Price previously made a strong impulsive drop, then mitigated the FVG (fair value gap) around the 4,65x–4,75x area.
After mitigation, price formed higher lows, signaling a shift from bearish correction to bullish intent.
Current structure is range-to-expansion rather than trendless chop.
Key Levels
Support zone (≈ 5,000–5,030)
This area has been:
Previously resistance
Successfully flipped into support
Multiple candle rejections confirm buyers defending the level
Resistance / Target zone (≈ 5,220–5,260)
Clear supply zone
Likely resting liquidity from prior highs
Logical bullish target if support holds
Trade Idea Logic (as drawn)
Entry: Near support after consolidation
Bias: Bullish continuation
Target: Premium resistance zone
Rationale:
Support hold
Higher-low structure
Previous imbalance already mitigated
Price building acceptance before expansion
What Would Invalidate This Setup
A clean H1 close below the support zone
Loss of higher-low structure → opens risk of deeper retrace toward the FVG again
Overall Bias
📈 Bullish while above support
This is a classic buy-the-dip into support → target premium liquidity setup.

XAUUSD Analysis todayHello traders, this is a complete multiple timeframe analysis of this pair. We see could find significant trading opportunities as per analysis upon price action confirmation we may take this trade. Smash the like button if you find value in this analysis and drop a comment if you have any questions or let me know which pair to cover in my next analysis.

XAUUSD: Major Rejection at 5,180 Supply Zone – Bearish Impulse LMarket Sentiment: Gold is exhibiting significant bearish pressure on the 15-minute timeframe after a sharp rejection from the high-interest supply zone between 5,120 and 5,180.
Technical Breakdown:
Resistance Confirmation: The price failed to sustain momentum above the overhead purple supply block, leading to a structural shift.
Momentum Indicator: The large bearish impulse arrow indicates a high probability of a deep corrective move toward the lower liquidity zones.
Projected Trajectory: We anticipate a series of lower highs and lower lows as the market moves to clear the buy-side liquidity established during the previous rally.
Key Targets: The primary downside objective is the major demand cluster near 4,484.

XAUUSD Updated analysis todayHello traders, this is a complete multiple timeframe analysis of this pair. We see could find significant trading opportunities as per analysis upon price action confirmation we may take this trade. Smash the like button if you find value in this analysis and drop a comment if you have any questions or let me know which pair to cover in my next analysis.

8 Feb - Gold to $5350 - $5450
After last week's sharp decline, a leading diagonal pattern has emerged this week, possibly marking the beginning of wave 1. A wave correction then formed, forming a downtrend channel, completing the formation of wave 2.
The price is currently at the beginning of wave 3. If the Elliott Wave Analysis is successful, wave 3 will likely be the same length as wave 1, and the price will likely head towards the 5360 - 5450 area.
Wave 3 typically doesn't experience a significant price correction. If you want to buy, look for areas of demand on the H1 and M16 timeframes to avoid missing this week's rally.
This analysis will fail if the price rebounds and breaks through an invalid area.

monday XAUUSD Reject Major Supply Zone – Bearish Continuation ExMarket Context: Gold (XAU/USD) is showing a strong bearish rejection after testing the significant overhead supply zone between 5,100 and 5,150.
Technical Setup: The current price action on the 15-minute timeframe indicates a failed attempt to sustain bullish momentum. We are observing a structural shift as the price creates lower highs, respecting the primary descending trendline.
Key Observations:
Supply Zone: The purple resistance block at 5,120 remains the primary barrier for any bullish recovery.
Path Prediction: The projected trajectory (black path-line) suggests a retest of the immediate support near 4,800, followed by a potential decline toward the deeper demand clusters.
Primary Target: The main downside objective is the 4,400 - 4,500 region, indicated by the blue impulse arrow.
Risk Management: This bearish outlook remains valid as long as the price stays below the 5,150 resistance level.

XAUUSD Analysis todayHello traders, this is a complete multiple timeframe analysis of this pair. We see could find significant trading opportunities as per analysis upon price action confirmation we may take this trade. Smash the like button if you find value in this analysis and drop a comment if you have any questions or let me know which pair to cover in my next analysis.

GOLD (XAUUSD): Strong Intraday Bullish Signal
Gold turned very bullish on Friday.
The price violated a resistance line of a bullish flag pattern
on a 4H time frame.
With a high probability, it is heading toward 5070 level now.
❤️Please, support my work with like, thank you!❤️
I am part of Trade Nation's Influencer program and receive a monthly fee for using their TradingView charts in my analysis.

Gold Roadmap (1H): Breakout Scenario in PlayToday, I want to share a long setup for Gold( OANDA:XAUUSD ) on the 1-hour timeframe—so stay with me!
Gold is currently moving near a resistance zone($4,991-$4,878).
From a classical technical perspective, it appears that gold has formed a descending broadening wedge pattern. If we break above the upper lines of this pattern, we can anticipate bullish momentum in the coming hours.
From an Elliott Wave perspective, it seems gold can continue its upward corrective wave, likely a ZigZag Correction(ABC/5-3-5).
I expect gold, after a small correction near Fibonacci levels and support zone($4,991-$4,878), to start rising toward at least $4,976. If we break the resistance zone($4,991-$4,878), we can set the next target around $5,081.
In case of heightened Middle East tensions, gold could experience a sudden bullish surge—so be prepared for that scenario as well!
What is your idea about Gold!? Up or Down at least for the short-term!?
First Target: $4,976
Second Target: $5,081
Stop Loss(SL): $4,591
Points may shift as the market evolves
💡 Please respect each other's opinions and express agreement or disagreement politely.
📌 Gold Analyze (XAUUSD), 1-hour time frame.
🛑 Always set a Stop Loss(SL) for every position you open.
✅ This is just my idea; I’d love to see your thoughts too!
🔥 If you find it helpful, please BOOST this post and share it with your friends.

XAUUSD: Potential Bearish Structure and Key Retest LevelsMarket Overview: Gold (XAU/USD) is currently trading within a critical decision zone on the 15-minute timeframe. After a period of volatility and a sharp recovery from the 4,400 area, the price is now testing an established horizontal resistance zone near 4,860 - 4,870.
Technical Observations:
Supply Zones: We have a clear supply zone established around the 5,100 level and an immediate resistance block currently being tested at 4,863.
Trend Dynamics: The price recently broke through a descending trendline (blue), but the subsequent price action suggests a potential weakening of bullish momentum as it hits horizontal resistance.
Price Action Path: The projected path (black lines) indicates a high probability of a "Double Top" or a lower high formation if the current resistance holds. A failure to sustain above 4,800 could lead to a liquidity grab toward the lower support clusters.
Key Levels to Watch:
Immediate Resistance: 4,863 - 4,900
Major Resistance: 5,100 - 5,150
Support Level 1: 4,800 (Psychological level)
Support Level 2: 4,600 - 4,650
Demand Zone: 4,400

Gold Price Analysis – Key Resistance and Support LevelsThis chart outlines critical resistance and support levels for gold prices. The Key Resistance Level at 5,565.814 is a potential area for price rejection or breakout. If price approaches this level, watch for either a continuation of bullish momentum or a pause in upward movement. The Support Zone around 4,820 is being tested, and if this level holds, it could lead to a bullish reversal or bounce. The Critical Support at 5,012.323 is a key level for potential bullish movement, while the Final Target at 4,504.227 represents the expected downside if support fails. Extreme Support at 4,509.018 is a significant reversal area, should the price reach this level

Gold- From weekly to 15m chart. Where are the trades?These days, everyone has an opinion on Gold.
Most of them are bullish.
And to be fair — so am I.
But here is what many traders either don’t understand or simply ignore:
There is a huge difference between having an opinion and having a tradable opinion.
A tradable opinion is one that can actually be executed in the market, with leverage, risk control, and realistic stops — not just a direction on a chart.
This analysis is not about saying “Gold is bullish, it will go to 6k or 7k, I’m a genius if it does.”
It’s about giving traders something they can actually work with.
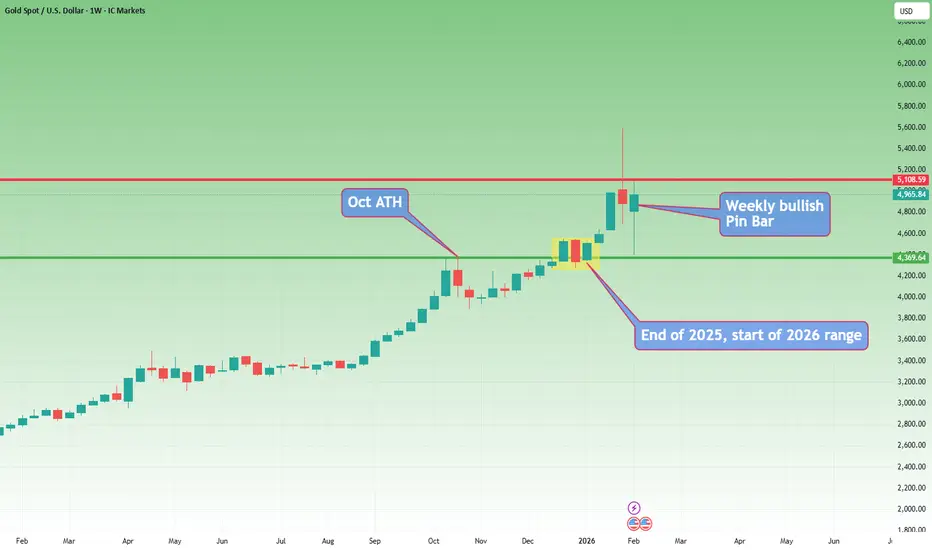
🔎 Weekly Chart — Big Picture Reality
Three things stand out immediately:
1️⃣ The 5600 → 4400 drop
Yes, it was massive:
- ~12,000 pips
- large in percentage terms
- emotionally shocking
But in long-term trend terms?
👉 Just a correction.
Even if we measure only the 2025 rally, the drop didn’t even reach a 50% retracement.
2️⃣ Technical respect of structure
The decline stopped almost exactly at the October 2025 ATH, which acted as support.
Markets remember levels.
This is not random.
3️⃣ Alignment with congestion
The drop also aligned with:
- the late-December congestion zone
- the starting price of 2026
The first prices of the year often act as major S/R zones.
This is classic market behavior.
✅ Conclusion from Weekly:
Trend is bullish. No debate here.
❌ But tradable?
Not really.
Why?
Because a correct structural stop would be ~8,000 pips away.
With leverage, that’s not trading — that’s praying.
🔎 Daily Chart — Still Bullish, Still Not Tradable
On the daily:
- clean reversal from support
- first impulsive leg up
- pullback forming a higher low
- recent Piercing Line bullish pattern
Again:
✅ Bullish structure
❌ Not tradable structure
A proper stop still sits ~4,000 pips away.
That’s not risk management.
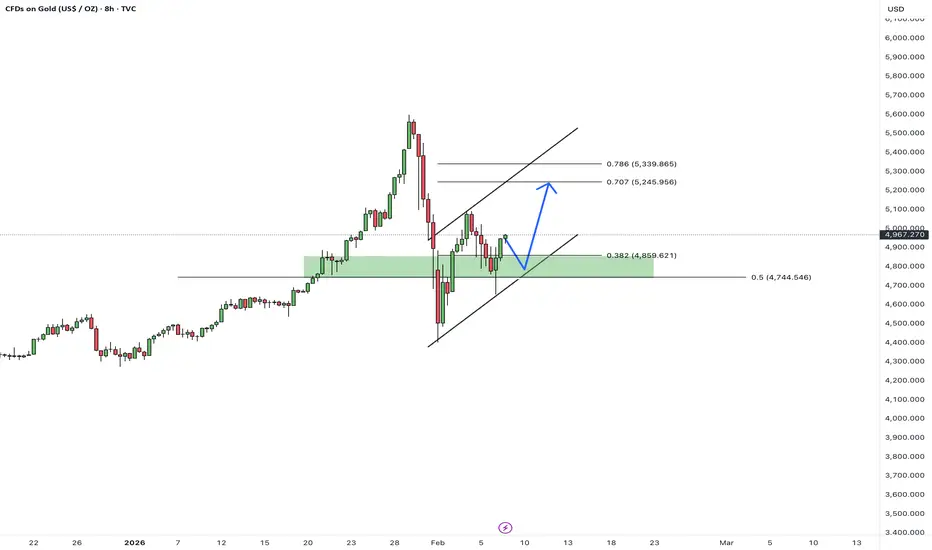
🔎 15-Minute Chart — Where Trading Actually Happens for me lately
Given current volatility, this is what matters these days
Here’s what we see:
- initial rally in a rising wedge
- rejection from resistance
- drop from 5100 → 4650 contained within a bullish flag relative to the impulse
- breakout above flag resistance
- continuation toward 5k
- NY close near highs
Structurally?
👉 Still bullish.
But even here:
❌ Buying blindly at 4965 makes no sense.
We need a dip.
We need structure.
We need asymmetric risk.
📌 The Two Buy Zones That Make Sense
If price offers them:
✅ 4900
✅ 4800
Those are the zones where risk/reward becomes logical.
⚠️ The Reality Most Traders Don’t Want to Hear
Even on a 15M chart:
- stops of 300–500 pips are normal
- targets should be well above 1,000 pips
Let’s be honest:
Bragging about a 100-pip Gold target these days is like bragging about a 2-pip win on a EURUSD trade.
simply not trading...
✅ Final Conclusion
✔️ Gold is bullish
✔️ I will look to buy dips
✔️ But only with structure and discipline
Because in this environment:
- volatility is extreme
- emotions are expensive
- precision matters more than bias
A trader’s job is not to be right.
A trader’s job is to make money.
And those are two very different things. 🚀
P.S.
And yes — if I see a clear reversal structure on the 15-minute chart, I can take a short trade, even if my overall bias on Gold remains bullish.
This does not contradict my opinion.
It simply reflects the reality that:
You can be bullish on the bigger picture and still trade short-term corrections.
Have a nice Saturday!
Mihai Iacob