XAUUSD Can it really get to $8000???Gold (XAUUSD) has been practically on a non-stop rally since the last time it tested its 1M MA50 (blue trend-line) 2 years ago (October 2023). It is no coincidence that the result of such a test was an aggressive rally, as this level has historically been Gold's long-term Support and what separates its Bull from its Bear Cycles.
More specifically, Gold has started trading within a multi-decade Channel Up since the August 1993 High. It first Bear Cycle (red Rectangle) started then end finished the moment it touched the pattern's bottom. Shortly after, the price broke sustainably above the 1M MA50, confirming the new Bull Cycle in the form of an internal (green) Channel Up.
This phase peaked a little above the 3.618 Fibonacci extension. That was when the latest Bear Cycle started, which again broke below the 1M MA50 and has been very similar in symmetrical terms to the first one. The new Bull Cycle started after the August 2018 Low.
With the use of the Time Cycles, we can estimate that in October 2029 the current long-term Bull Cycle might end. This doesn't mean that there won't be a sizeable correction until then, but the long-term bullish trend should stay intact.
By October 2029, contact with the Channel's top should have hit $8000, which is still marginally below the current 3.618 Fibonacci extension. This suggests that each of Gold's Time (Super) Cycle is approximately 18 years.
If such a continuous rise is materialized that doesn't only gives meaning to Gold's use as a 'safe-haven' but should also tell us a lot about future inflation and deliver a warning to economies and especially central bank strategy implementation.
-------------------------------------------------------------------------------
** Please LIKE 👍, FOLLOW ✅, SHARE 🙌 and COMMENT ✍ if you enjoy this idea! Also share your ideas and charts in the comments section below! This is best way to keep it relevant, support us, keep the content here free and allow the idea to reach as many people as possible. **
-------------------------------------------------------------------------------
💸💸💸💸💸💸
👇 👇 👇 👇 👇 👇
Goldsignals

Gold Holds Bullish Momentum – Key Watch at $3,565 and $3,578📊 Market Overview
Gold remains steady around $3,555–3,565/oz, close to record highs. The rally is supported by expectations of upcoming Fed rate cuts, a weaker USD, and strong central bank demand. In addition, geopolitical tensions continue to sustain safe-haven flows, keeping gold well-supported.
📉 Technical Analysis
• Resistance levels:
o $3,562–3,565 → minor intraday resistance.
o $3,572–3,578 → major resistance, close to ATH.
o $3,585 → extended resistance; a breakout here could trigger further upside.
• Support levels:
o $3,548–3,550 → immediate support zone.
o $3,540–3,542 → key short-term support.
o $3,530 → deeper support, below EMA9 H1.
• EMA: Price is trading above EMA9 on H1, confirming a short-term bullish trend.
• Patterns / Momentum: H1 candles continue forming higher lows, showing steady buying pressure. RSI hovers near 61, leaving room for further upside.
📌 Outlook
Gold is expected to remain bullish in the short term as long as it holds above $3,550. However, profit-taking pressure could emerge near $3,565–3,578, potentially leading to temporary pullbacks before resuming the uptrend.
Suggested Trading Strategy
🔻 SELL XAU/USD at: $3,565–3,562
🎯 TP: 40/80/200 pips
❌ SL: $3,568
🔺 BUY XAU/USD at: $3,548–3,545
🎯 TP: 40/80/200 pips
❌ SL: $3,542

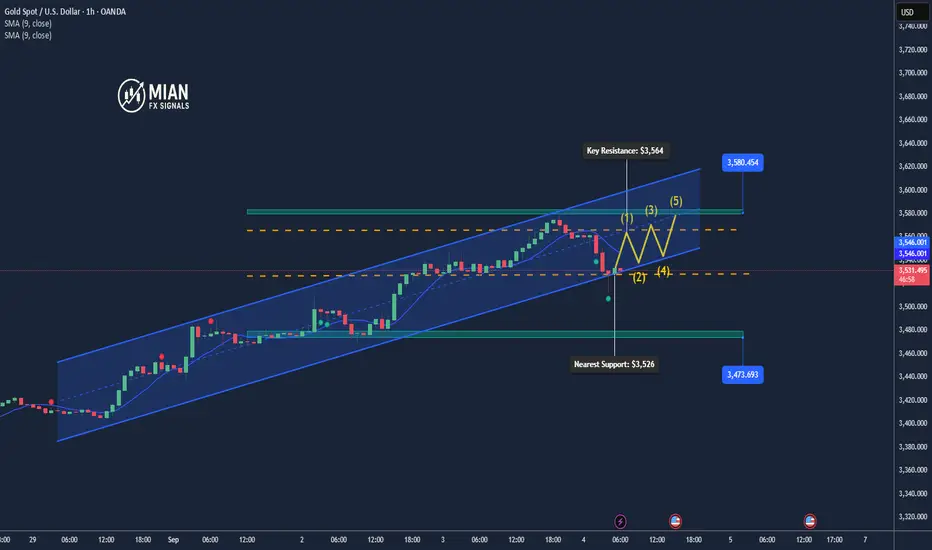
Gold Rebounds After Sharp Dip – Key Support in Focus📊 Market Overview:
Gold fell sharply to $3,511/oz earlier today before rebounding and is now trading around $3,530/oz. The move reflects profit-taking pressure after recent highs, followed by renewed safe-haven demand.
📉 Technical Analysis:
• Key Resistance: $3,553–3,564 (intraday high zone)
• Nearest Support: $3,526–3,530 (demand zone, EMA34/EMA89 support)
• EMA: Price is hovering near EMA34 & EMA89 → this zone is crucial for short-term direction.
• Candlestick / Momentum: Bounce from $3,511 indicates demand re-entry, but RSI is still neutral; a break below $3,526 could trigger deeper correction toward $3,500.
📌 Outlook:
Gold may continue its recovery in the short term if the $3,526–3,530 support holds. However, if price breaks below this zone, a deeper pullback toward $3,500–3,473 is likely.
________________________________________
💡 Suggested Trading Strategy:
🔺 BUY XAU/USD at: $3,525–3,528
🎯 TP: 40/80/200 pips
❌ SL: $3,522
🔻 SELL XAU/USD at: $3,561–3,564
🎯 TP: 40/80/200 pips
❌ SL: $3,567
GOLD TECHNICAL OUTLOOKGold is currently trading in the 3560 – 3565 range, marking a new all-time high in its history. The market remains in a high-volatility phase, and the next few H4 candles will be crucial in defining short-term direction.
🔹 Key Pivot Level: 3555
---
🟢 Bullish Scenario
If the H4 candle closes above 3555, this would signal continued bullish momentum. In this case, upside targets may extend towards:
3585 – Initial bullish target
3605 – Next resistance area
3620 – Major resistance zone / potential new ATH extension
This scenario suggests the uptrend remains intact, with buyers controlling the market.
---
🔻 Bearish Scenario
If the H4 candle closes below 3555, it may indicate a potential pullback or correction. Bearish levels to watch are:
3530 – First support
3515 – Next bearish target
3485 – Major support area and potential correction base
This would suggest a short-term reversal or healthy retracement after the recent rally.
📊 Summary:
Gold is at a critical decision point. A confirmed H4 close above or below 3555 will likely define the next directional move. Until confirmation, the market remains neutral with both scenarios valid.
💡 Always manage risk carefully and wait for candle confirmations before considering any positions.

GOLD STEPS UP – HITS NEW ATH AT $3 565📊 Market Overview:
Gold has now reached $3 565/oz, continuing its bullish ascent amid persistent global uncertainty. Safe-haven demand remains strong, and the market reflects near-certain expectations (92%) of a Fed rate cut in mid-September
📉 Technical Analysis:
• Key Resistance: $3 570 – $3 580
• Nearest Support: $3 555 – $3 560
• EMA: Price remains well above EMA09 & EMA50 → strong bullish momentum.
• Candlestick / Momentum: A breakout above prior resistance accompanied by high volume confirms strengthening upward momentum
📌 Outlook:
Despite modest economic data, gold continues its rally and just hit a new high. A short-term pullback to support zones remains possible, but the upward trend is firmly intact.
💡 Trading Strategy Suggestions:
✅ BUY : $3555 – $3558
🎯 TP: $3570
❌ SL: $3553

Gold Trade Idea Thurs 4 Sep Gold has finally come down !
Based on the Fibo levels, the next best buy levels are
3515-3520
3475-3480
Good Luck !

Gold Hits New ATH – Is a Bearish Crab Reversal Next?Gold ( OANDA:XAUUSD ) started to rise today after the release of the
ISM Manufacturing PMI index formed a new All-Time High(ATH) .
The question is what price range could the new ATH price range for gold be in?
Gold is currently moving near the Potential Reversal Zone(PRZ)($3,557-$3,531) .
From a pattern analysis perspective , it looks like Gold is completing a Bearish Crab Harmonic Pattern . In fact, if we find a trigger at point D of the Bearish Crab Harmonic Pattern , we can confirm this pattern.
From an Elliott wave theory perspective , it looks like Gold is completing wave 5 . This wave 5 could act as the end of the main wave 3 .
I expect Gold to drop to at least $3,501 in the coming hours .
Second Target: $3,481
Third Target: Support zone($3,474-$3,466)
Stop Loss (SL) = $3,559(Worst)
Gold Analyze (XAUUSD), 15-minute time frame.
Be sure to follow the updated ideas.
Do not forget to put a Stop loss for your positions (For every position you want to open).
Please follow your strategy; this is just my idea, and I will gladly see your ideas in this post.
Please do not forget the ✅ ' like ' ✅ button 🙏😊 & Share it with your friends; thanks, and Trade safe.

Gold Approaching $3,550 – Continuing Uptrend📊 Market Movement:
Gold has shown a corrective decline to around $3530 before stabilizing. The market is awaiting new momentum as traders balance between profit-taking and expectations of a continued uptrend.
📈 Technical Analysis:
- Resistance: $3550 – $3565
- Support: $3518 – $3525
- EMA trend: Still pointing upward, but showing early signs of consolidation.
- Candle patterns: Strong rejections near $3530 indicate demand remains solid.
🔎 Outlook:
Gold is still bullish in the medium term, but short-term corrections are expected before another upward attempt. Traders should remain cautious at resistance levels and look for confirmation signals at supports.
🎯 Trading Strategy:
🔻 SELL XAU/USD
Entry: $3542–3545
🎯 TP: 40/80/200 pips
🛑 SL: $3.548
🔺 BUY XAU/USD
Entry: 3520 – 3523
🎯 TP: 40 / 80 / 200 pips
🛑 SL: 3517

GOLD H1 STRUCTURE Gold Buying Zones We Have
TRENDLINE BUY : 3503
FVG AREA BUY : 3509, 3492
ORDER BLOCK : 3448, 3442
ORDER BLOCK : 3408, 3403
These Are Our Buy Zones
Hope You Understand Thanks For Here Follow Us For More

GOLD (XAUUSD): The Next Potential Resistances
As Gold is now trading in a no man's land, here are
2 potentially strong resistances that I spotted.
Psychological Resistance 1: 3550
Psychological Resistance 2: 3600
The price is heading toward Resistance 1.
It will most likely be the next goal for the buyers.
❤️Please, support my work with like, thank you!❤️
I am part of Trade Nation's Influencer program and receive a monthly fee for using their TradingView charts in my analysis.

Gold Extends Rally on Rising Rate-Cut Expectations📊 Market Developments:
Gold hit an all-time high around $3 508/oz before easing to about $3 494/oz, driven by a weaker U.S. dollar and growing expectations for a Fed rate cut in September. Markets are pricing in roughly a 90% probability of a rate cut this month.
📉 Technical Analysis:
• Resistance: $3 500 – $3 525 – $3 560
• Support: $3 425 – $3 400
• EMA: Price remains above EMA 09 → bullish trend
• Candlestick / Momentum: Indicators (RSI, MACD, CCI) all show strong buy momentum.
📌 Outlook:
Gold is in a clear short-term uptrend. A breakout above $3 500 may lead to $3 525 – $3 560. On the downside, strong support sits around $3 425 – $3 400, ideal for potential pullback entries.
💡 Trading Strategy:
🔻 SELL XAU/USD
Entry: $3 522 – $3 525
🎯 TP: 40/80/200 pips
🛑 SL: $3 528
🔺 BUY XAU/USD
Entry: $3 425 – $3 428
🎯 TP: 40/80/200 pips
🛑 SL: $3 422

SILVER (XAGUSD): The Next Resistance
Here is my latest structure analysis for Silver.
With a current bull, run the price successfully violated
39.0 - 39.5 supply area that turned into a demand zone now.
The closest strong supply zone that I see is based on a major
rising trend line and 41.0 psychological level.
It looks like the price may easily reach that soon.
❤️Please, support my work with like, thank you!❤️
I am part of Trade Nation's Influencer program and receive a monthly fee for using their TradingView charts in my analysis.

XAUUSD Analysis todayHello traders, this is a complete multiple timeframe analysis of this pair. We see could find significant trading opportunities as per analysis upon price action confirmation we may take this trade. Smash the like button if you find value in this analysis and drop a comment if you have any questions or let me know which pair to cover in my next analysis.

GOLD NEW ATH AGAIN ? Hello Welcome To My Gold Idea
Gold Buy Setup For Now > CISD BUY : 3484
Gold Buy Setup Pending > FVG BUY : 3454, 3448
Gold Buy Setup Pending > ORDER BLOCK BUY : 3407 , 3402
Target Will NEW ATH Hope You Got It Follow For More !

Gold Consolidates Below $3,500📊 Market Overview
Gold trades near $3,487/oz, supported by Fed rate-cut bets and a weaker USD. Traders await this week’s NFP for clearer direction.
📉 Technical Analysis
• Key resistance: $3,490–$3,500
• Nearest support: $3,465
• EMA 09: Price remains above EMA 09 → short-term uptrend still intact.
• Momentum: High RSI, signaling risk of a short-term pullback.
📌 Outlook
Gold remains in a short-term uptrend, but volatility around $3,490–3,500 will define the next move.
💡 Suggested Trading Strategy
Base Scenario
• 🔻 SELL XAU/USD at $3,490–$3,493 → TP $3,470, SL $3,496
• 🔺 BUY XAU/USD at $3,464–$3,467 → TP $3,485, SL $3,461

XAUUSD about to make new ATH and head to $3800Gold (XAUUSD) is on a huge rebound following the double bounce on its 1W MA20 (red trend-line), a level which has been previously associated with the start of very strong rallies.
The 2-year Channel Up that started back in October 2023 has always formed a consolidation Triangle before the next Bullish Leg and on the three past occasions that was initiated after a 1W MA20 contact.
Assuming we 'just' repeat the minimum +22.41% Bullish Leg, we are targeting at least $3800 before the current peaks.
-------------------------------------------------------------------------------
** Please LIKE 👍, FOLLOW ✅, SHARE 🙌 and COMMENT ✍ if you enjoy this idea! Also share your ideas and charts in the comments section below! This is best way to keep it relevant, support us, keep the content here free and allow the idea to reach as many people as possible. **
-------------------------------------------------------------------------------
💸💸💸💸💸💸
👇 👇 👇 👇 👇 👇

Gold Reaches New High at 3,486 Amid Rising Rate-Cut Expectations📊 Market Overview:
Gold surged to a new high at $3,486/oz, surpassing earlier levels around $3,470, driven by elevated expectations of a Fed interest rate cut this month.
A weaker USD—amid dovish Fed comments and a court ruling limiting Trump-era tariffs—further underpinned gold’s appeal.
📉 Technical Analysis:
• Key resistance: $3,490–$3,495 (psychological barrier before $3,500).
• Nearest support: $3,460–$3,465 (EMA 09 + technical zone).
• EMA 09: Gold is trading above EMA 09 → bullish momentum.
• Candles / Volume / Momentum: Continuous rally with strong demand; however, a pullback is likely near resistance.
📌 Outlook:
Gold may continue climbing in the short term if Fed cut expectations remain firm and USD stays weak.
However, stronger US data (such as this week’s NFP) could dampen rate-cut bets and trigger a short-term correction.
💡 Suggested Trading Strategy
🔻 SELL XAU/USD : ~$3,492–$3,495
🎯 TP: 40/80/200 pips
🛑 SL: ~$3,498
🔺 BUY XAU/USD : ~$3,462–$3,465
🎯 TP: 40/80/200 pips
🛑 SL: ~$3,459

GOLD (XAUUSD): ATH Soon! What's Next?!
What a market opening on Gold!
Bull run continues, and the price is going to reach a current All-Time High soon.
Watching how strong is the momentum, it feels like the market is going to
update the ATH.
Your next confirmation to buy will be a daily candle close above 3500.
❤️Please, support my work with like, thank you!❤️
I am part of Trade Nation's Influencer program and receive a monthly fee for using their TradingView charts in my analysis.

Gold Faces $3,430 Resistance – Minor Pullback Likely📊 Market Dynamics:
Following the PCE report, gold rallied sharply and is now trading around $3,427/oz, testing a major resistance zone. Buyers remain in control, but profit-taking emerges near $3,430.
📉 Technical Analysis:
• Key Resistance: $3,430 – $3,435
• Nearest Support: $3,418 – $3,415
• EMA 09: Price holds above EMA09, keeping bullish bias intact.
• Candlestick / Momentum: H1 candles show long upper wicks around $3,430 → signaling short-term selling pressure.
📌 Outlook:
A clear break above $3,430 could extend gains toward $3,440 – $3,450; failure to hold may trigger a pullback to $3,418 – $3,415.
💡 Suggested Trading Strategy:
• 🔻 SELL XAU/USD: $3,437 – $3,435
🎯 TP: 40/80/200 pips
❌ SL: $3,442

XAUUSD Analysis Today Hello traders, this is a complete multiple timeframe analysis of this pair. We see could find significant trading opportunities as per analysis upon price action confirmation we may take this trade. Smash the like button if you find value in this analysis and drop a comment if you have any questions or let me know which pair to cover in my next analysis.

GOLD (XAUUSD): Another Breakout Ahead?!
Gold closed on Friday, testing a major horizontal resistance cluster.
Taking into consideration a strong bullish momentum,
the price may violate that as well.
Your next confirmation to buy will be a breakout of the underlined structure
and a daily candle close above 3452.
A bullish continuation to 3492 will be expected then.
❤️Please, support my work with like, thank you!❤️
I am part of Trade Nation's Influencer program and receive a monthly fee for using their TradingView charts in my analysis.

XAU/USD Technical Outlook – Short-Term Dip, Bigger Upside AheadHello guys.
It is what I see:
We can see that Gold is currently trading around $3,404, consolidating after a strong bullish move inside a rising wedge formation. The wedge has now broken out to the upside, and price action is showing a potential head and shoulders pattern near the top.
Head and Shoulders:
The left shoulder, head, and right shoulder are clearly visible, and the neckline is sitting around the $3,399–$3,400 zone. If price dips and retests this neckline, we could see a short-term bearish move toward the target of the head and shoulders around $3,399. This is a healthy pullback after the recent rally.
Bigger Picture (Wedge):
Even though we might see a short-term correction, the larger wedge breakout suggests continuation to the upside. The measured target of the wedge points toward $3,430, which lines up as the next resistance level.

XAU/USD: Gold Dip to 3351? FX:XAUUSD is signaling a potential bearish move on the 1-hour chart , with an entry zone between 3400-3407 near a resistance level.
The target range of 3363-3351 aligns with key support zones, offering a clear downside play. 📈 Set a stop loss on a close above 3418 to manage risk effectively.
A break below 3395 with increasing volume could confirm this dip, driven by profit-taking and USD strength. Watch economic data releases! 💡
📝 Trade Plan:
✅ Entry Zone: 3400 – 3407 (resistance area)
❌ Stop Loss: close above 3418 to manage risk
🎯 Target Zone 1: 3363 – 3351 (key support levels)
Ready for this drop? Drop your take below! 👇
