GOLD (XAUUSD): Support & Resistance Analysis For Next Week
Here is my latest structure analysis for Gold.
Support 1: 3306 - 3315 area
Support 2: 3245 - 3275 area
Support 3: 3121 - 3177 area
Resistance 1: 3371 - 3380 area
Resistance 2: 3403 - 3408 area
Resistance 3: 3431 - 3451 area
Consider these structures for pullback/breakout trading.
❤️Please, support my work with like, thank you!❤️
I am part of Trade Nation's Influencer program and receive a monthly fee for using their TradingView charts in my analysis.
Goldsignals

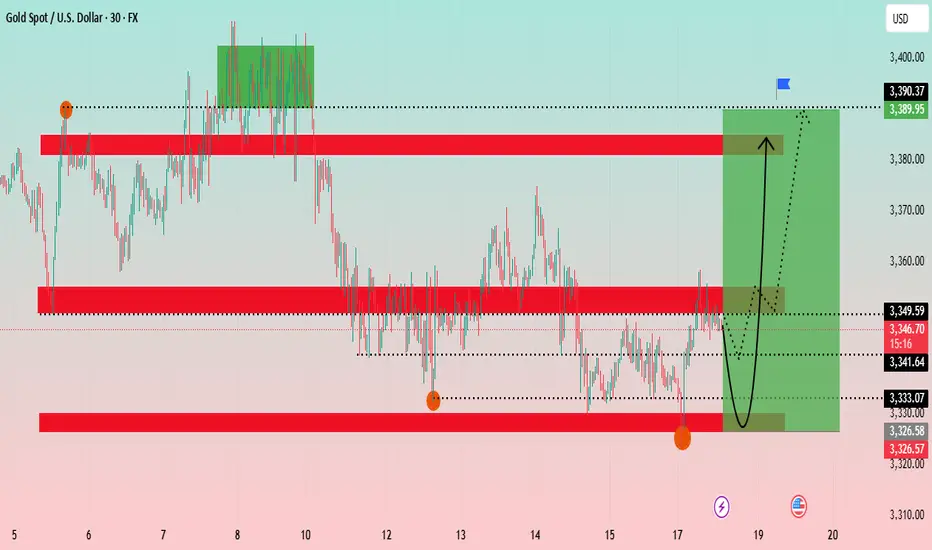
Gold and Bitcoin Technical Analysis: Navigating Key Support ?The Gold chart shows a 30-minute timeframe analysis, highlighting recent price consolidation and potential future trends. The analysis suggests a potential V-shape recovery for gold.
Key Levels: The price is currently at a critical juncture, having tested a support zone around 3,326 - 3,333 USD. This zone has proven to be a strong base. Above it, a significant resistance zone is identified between 3,349 - 3,353 USD. Further up, another major resistance is at approximately 3,389 USD.
Price Action: The price has recently experienced a sharp decline and is now in a consolidation phase. The chart projects a potential bounce from the current levels, indicated by the black curved arrow, with the target being the upper resistance zone around 3,389 USD. The green shaded box illustrates the potential upward movement from the current position.
Conclusion: Gold appears to be at a key support level and could be poised for a rally if it successfully breaks above the immediate resistance zone.
Bitcoin (BTC/USDT) 4-Hour Chart Analysis
The Bitcoin chart shows a 4-hour timeframe analysis, focusing on a short-term uptrend channel.
Key Levels: The price is trading within an ascending channel. A significant support zone is identified between 112,000 - 114,000 USDT. A "weak supply zone" is marked around 118,000 USDT, which is currently acting as support. A major resistance is at approximately 124,564 USDT.
Price Action: After a strong push towards the channel's upper boundary, the price has pulled back and is now retesting the "weak supply zone." The blue and red arrows project two possible scenarios: a bounce back up towards the channel's high, or a deeper retracement towards the channel's lower trendline. The price movement appears to be following the blue projected path.
Indicators: The Ichimoku cloud and RSI strategy are used to confirm the trend and identify entry/exit points. The price is above the Ichimoku cloud, indicating a bullish trend.
Conclusion: Bitcoin is at a pivotal point within its uptrend channel. Its ability to hold the 118,000 USDT level will be crucial for a potential re-test of the 124,564 USDT resistance.
XAUUSD – Watching 3,310 as Price Pulls BackHey Traders, in today's trading session we are monitoring XAUUSD for a buying opportunity around 3,310 zone, Gold (XAUUSD) has been moving lower after its recent swing high, with price now correcting toward the 3,310 area.
Structure: The broader bias has been bullish overall, but recent price action shows a corrective move.
Key level in focus: 3,310 — previously acted as support/resistance.
Next move: Holding above this zone could maintain the medium-term bullish bias, while a clear break below may open the way for deeper retracement.
Monitoring how price behaves around 3,310 to understand whether buyers will step in or if weakness continues.
Trade safe, Joe.

Gold Short-term: Selling Pressure Increases After Breaking 3340📊 Market Overview:
Gold broke 3340 due to strong selling pressure following hawkish Fed comments and strong USD data. Investor sentiment leans defensive, pushing gold down to 3328.
📉 Technical Analysis:
• Key resistance: 3335–3340
• Nearest support: 3320–3315
• EMA: Price below EMA09 → short-term bearish trend
• Candlestick / volume / momentum: Strong red candles with increasing volume indicate sustained selling pressure
📌 Outlook:
Gold may continue to decline in the short term if it fails to reclaim 3340, targeting support around 3320–3310.
💡 Suggested Trading Strategy:
🔻 SELL XAU/USD : 3335–3338
🎯 TP: 40/80/200 pips
❌ SL: 3340
🔺 BUY XAU/USD : 3319–3322
🎯 TP: 40/80/200 pips
❌ SL: 3315

XAUUSD and DXY Analysis todayHello traders, this is a complete multiple timeframe analysis of this pair. We see could find significant trading opportunities as per analysis upon price action confirmation we may take this trade. Smash the like button if you find value in this analysis and drop a comment if you have any questions or let me know which pair to cover in my next analysis.

Gold fell to 3325 after the US and EU reached a trade agreement📊 Market Overview
Gold is consolidating as traders await Fed Chair Powell’s speech at Jackson Hole. A slightly firmer USD is acting as a mild headwind.
Reuters reported spot gold trading around $3,340/oz earlier today with a wait-and-see tone.
📉 Technical Analysis
• Key Resistance: 3,361 → next levels 3,375–3,400.
• Nearest Support: 3,323 → next levels 3,300–3,285.
• EMA: Price is trading below EMA50, signaling short-term bearish pressure.
• Pattern / Momentum: Market is in a consolidation phase, with selling pressure emerging near resistance. Bearish bias likely if 3,350–3,361 fails to break.
📌 Outlook
In the short term, gold is expected to range-trade between 3,323 and 3,361.
• Holding above 3,323 favors a bounce toward 3,340–3,350.
• A break below 3,323 risks a move down to 3,315–3,310.
💡 Suggested Trading Strategy
SELL XAU/USD at: 3,350–3,360
🎯 TP: ~3,330 ❌ SL: ~3,370
BUY XAU/USD at: 3,330–3,322
🎯 TP: ~3,350 ❌ SL: ~3,312

H4 GOLD BUY Gold Give A Bullish Fvg After Big Falling So We Are Expecting A Bullish Setup Also Its Filled The Below IFVG And Break The Buy Trendline So Now We Will Buy Now Targeting Previous High Lets Goo For It
FOLLOW US FOR MORE TRADES
TRADE IN DEPTH MARKET

Gold Holds Steady Amid Consolidation Phase📊 Market Overview:
Gold is holding steady around $3,342/oz, slightly lower by ~0.1% as investors await Fed Chair’s speech at the Jackson Hole symposium. Meanwhile, geopolitical risks continue to support gold as a safe-haven asset.
📉 Technical Analysis:
• Key Resistance: $3,350 – $3,435
• Nearest Support: $3,300 – $3,310 (100-day MA)
• EMA: Price is trading above the 100-day MA but still below the 200-hour MA, signaling short-term recovery momentum but resistance ahead.
• Candle / Momentum: Market remains in a tight consolidation range; RSI shows potential cooling before the next move.
📌 Outlook:
Gold may edge higher in the short term if the Fed signals a dovish shift (rate cut), targeting the $3,400 zone. If policy remains unchanged, gold could consolidate further or retrace toward $3,300.
💡 Trading Strategy Suggestions:
🔻 SELL XAU/USD : $3,370 - $3,373
🎯 TP: 40/80/200 pips
🛑 SL: $3,376
🔺 BUY XAU/USD : $3,310 – $3,313
🎯 TP: 40/80/200 pips
🛑 SL: $3,307

SILVER (XAGUSD): Bearish Move From Trend Line
I see a test of a strong trend line on Silver on an hourly time frame.
A rapid growth stopped once the price approached that
and a consolidation started.
A bearish breakout of its support is a strong confirmation to sell.
I think that the market will retrace to 37,54
❤️Please, support my work with like, thank you!❤️
I am part of Trade Nation's Influencer program and receive a monthly fee for using their TradingView charts in my analysis.

Gold Holds $3310 Support, Trading Around $3319📊 Market Overview
Gold dropped to the $3311/oz zone (near a technical bottom) and then rebounded, currently trading around $3319/oz. This indicates buying interest emerging at a key support, while overall market sentiment remains cautious ahead of Fed signals.
📉 Technical Analysis
• Near-term resistance: $3325 and $3335
• Near-term support: $3310 and $3300
• The rebound from $3311 shows that the $3310 level is acting as strong short-term support.
• EMA20 on H1 still points downward, indicating selling pressure remains, but RSI shows an oversold condition, signaling a potential short-term technical rebound.
🔎 Outlook
In the short term, gold is likely to range between $3310 – $3330. Holding above $3310 could allow price to retest $3325 – $3335. If $3310 breaks, the decline could extend toward $3300.
🎯 Suggested Trading Strategy
🔺 BUY XAU/USD
Entry: 3300 – 3297
🎯 TP: 40 / 80 / 200 pips
🛑 SL: 3394
🔻 SELL XAU/USD
Entry: 3327 – 3330
🎯 TP: 40 / 80 / 200 pips
🛑 SL: 3333

XAUUSD Analysis todayHello traders, this is a complete multiple timeframe analysis of this pair. We see could find significant trading opportunities as per analysis upon price action confirmation we may take this trade. Smash the like button if you find value in this analysis and drop a comment if you have any questions or let me know which pair to cover in my next analysis.

GOLD H4 SETUPGold Buy H4
Buy At Order Block Price 3300 / 3280
Lets Go A Clearly Looking Buy Setup
Target. 3430
Longterm Gold Setups
Try To Hold The Trade And Manage Your Trade Properly

GOLD: Falling Wedge, Time To Buy?My overall bias is still bullish. HL was formed above 3305. We did get a deeper pullback. Price tapped into H4 demand zone 3322–3332 which has a bullish FVG confluence. Sell-side liquidity below 3332 was swept.
✅ Primary Breakout Entry (conservative, higher probability)
Trigger: M15 break + close above 3352
Entry on retest: 3348–3352
SL (use your own discretion)
TP1 3362
TP2 3372
TP3 3400

Gold Rises to 3339 – Awaiting Pullback to 3317📊 Market Overview
After dipping to 3326, gold rebounded sharply and reached 3339 in the latest session. The upside momentum came from safe-haven demand as the USD temporarily weakened. However, ahead of the Jackson Hole symposium, the market remains cautious with no clear trend established.
📉 Technical Analysis
• Key Resistance: 3338–3341 (fresh intraday top)
• Nearest Support: 3326–3328, deeper support at 3317 (major level)
• EMA: Price is trading above EMA9 on the H1 timeframe, indicating short-term bullish momentum still intact
• Candles & Momentum: Continuous bullish candles from 3326 → 3339, but limited volume suggests a potential pullback ahead
📌 Outlook
In the short term, gold is likely to face selling pressure near 3338–3341. A break below 3326 could open the way toward the key 3317 support zone for a retest of buyers’ strength.
💡 Suggested Trading Strategy
🔻 SELL XAU/USD at: 3338–3341
🎯 TP: 40/80/200 pips
🛑 SL: 3344
🔺 BUY XAU/USD at: 3317 - 3314
🎯 TP: 3332 / 3340
🛑 SL: 3311

XAUUSD: Fake Out Confirms Bearish Pressure, Eyeing 3323 & 3314Hello guys.
We recently saw a fake-out above the descending channel, which trapped early buyers and confirmed that sellers are still in control. Despite the QML formation in the highlighted zone, the bearish pressure remains dominant.
As long as the price trades below the fake-out high, the overall trend continues to point downward. My immediate downside targets are:
3323 (first key level)
3314 (secondary target, potential liquidity grab zone)
If sellers manage to hold momentum, we could see a continuation deeper into the channel.
⚠️ Keep in mind that a clean break above the fake-out level would invalidate this bearish outlook.

Bullish Setup on Gold – Targets Ahead!Gold ( OANDA:XAUUSD ) is still moving in the Support zone($3,350-$3,326) and near the Monthly Pivot Point .
In terms of Elliott wave theory , it seems that Gold has managed to complete the Zigzag Correction(ABC/5-3-5) , and we should wait for the rising waves .
Also, we can see the Regular Divergence(RD+) between Consecutive Valleys .
I expect Gold to rise to at least $3,371 AFTER breaking the Resistance lines .
Second Target: $3,394
Third Target: $3,407
Note: Stop Loss (SL) = $3,317
Gold Analyze (XAUUSD), 1-hour time frame.
Be sure to follow the updated ideas.
Do not forget to put a Stop loss for your positions (For every position you want to open).
Please follow your strategy; this is just my idea, and I will gladly see your ideas in this post.
Please do not forget the ✅ ' like ' ✅ button 🙏😊 & Share it with your friends; thanks, and Trade safe.

XAUUSD Possible drop to daily support?XAUUSD possibly continuing to trend down with a strong momentum to the downside as previous daily price action is showing strongly bearish. As the price is showing continued series of lower highs, it is possible for the price to slide down to daily support level today at 3323.38 level or further below.
A bearish trade is high probable!

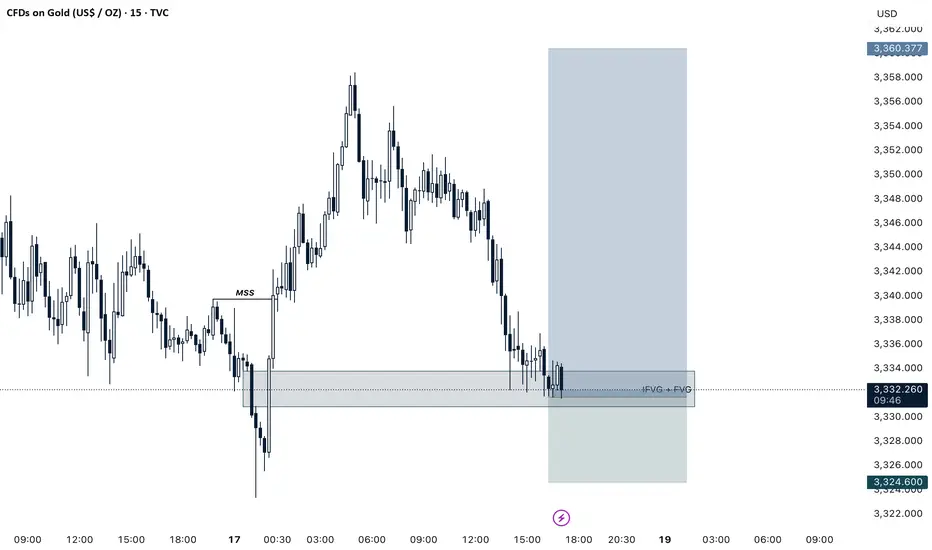
MSS + IFVG + FVG GOLD BUY SETUPGold Looking For Bullish With A Strong Setup
Strategy : MSS + IFVG + FVG
Lets Take Buy Trade Now Target 3360
Entry Price CMP
Manage Your Trades Properly And Follow Us For More Trades
Gold Recovers as Rate-Cut Hopes Strengthen📊 Market Summary:
• Gold (XAU/USD) rose slightly +0.5% to ~$3,350.55/oz, supported by growing expectations of Fed rate cuts and lower U.S. bond yields, which boosted safe-haven demand.
• However, easing geopolitical tensions have reduced strong safe-haven flows, putting mild pressure on gold.
📉 Technical Analysis:
• Resistance Levels:
• $3,400 – immediate resistance
• $3,420 – next key resistance if $3,400 is broken
• Support Levels:
• $3,330–$3,335 – strong support zone
• $3,310 – secondary support if $3,330 fails
• EMA & MAs: Price is holding above most short-term EMAs/MAs (MA5, MA10, MA20 → bullish; only MA200 remains bearish) → trend still bullish.
• Momentum Indicators: RSI ~62 (positive), Stoch & MACD remain bullish, ADX ~30 confirms a relatively strong trend.
📌 Outlook:
• Short-term: Gold could retest $3,400–$3,420 if dovish Fed signals and low yields persist.
• Risk: A hawkish Fed tone or easing geopolitical risks could drag gold back down toward $3,330 and possibly $3,310.
💡 Trade Strategy:
🔺 BUY XAU/USD: $3,330–$3,333
🎯 TP: 40/80/200 pips
❌ SL: $3327
🔻 SELL XAU/USD : $3,402–$3,405
🎯 TP: 40/80/200 pips
❌ SL: $3,408

XAUUSD Buy signal on Triangle bottom.Gold (XAUUSD) has been trading within a Triangle pattern, having dropped below its 4H MA50 (blue trend-line) in recent sessions. It is approaching its 1D MA100 (red trend-line), which is the ultimate long-term Support (holding since December 31 2024), which provided the bounce on the previous July 30 Higher Low.
With the 4H MACD printing a bottom formation similar to all buy sequences of the Triangle, it is highly likely that we will see a rebound next. As with the previous Bullish Leg, we expect to test at least the 0.9 Fibonacci retracement level, which is at 3420.
-------------------------------------------------------------------------------
** Please LIKE 👍, FOLLOW ✅, SHARE 🙌 and COMMENT ✍ if you enjoy this idea! Also share your ideas and charts in the comments section below! This is best way to keep it relevant, support us, keep the content here free and allow the idea to reach as many people as possible. **
-------------------------------------------------------------------------------
Disclosure: I am part of Trade Nation's Influencer program and receive a monthly fee for using their TradingView charts in my analysis.
💸💸💸💸💸💸
👇 👇 👇 👇 👇 👇

XAUUSD Analysis todayHello traders, this is a complete multiple timeframe analysis of this pair. We see could find significant trading opportunities as per analysis upon price action confirmation we may take this trade. Smash the like button if you find value in this analysis and drop a comment if you have any questions or let me know which pair to cover in my next analysis.

Gold May Correct Amid U.S. Inflation Concerns📊 Market Overview
• Spot gold edged up slightly as the U.S. dollar weakened, but is still heading for a ~1.5% weekly drop as strong U.S. inflation data reduced expectations for significant Fed rate cuts.
• Earlier this week, softer-than-expected U.S. CPI data (up 0.2% in July) briefly lifted gold prices to $3,351.46/oz.
📉 Technical Analysis
• Key Resistance: ~$3,350–3,360/oz
• Nearest Support: ~$3,330–3,340/oz
• EMA 09:
If price is above EMA09 → short-term trend is bullish.
If price is below EMA09 → trend is bearish
• Candlestick / Volume / Momentum:
Price action is consolidating in a narrow range, showing a cautious market tone.
No significant breakout signals from volume yet.
📌 Outlook
Gold may rise slightly in the short term if the U.S. dollar continues to weaken and inflation data remains soft. However, if incoming data reinforces the view of fewer rate cuts (e.g., higher PPI, lower jobless claims), gold could correct lower.
💡 Suggested Trade Strategy
SELL XAU/USD: $3,350–3,355
🎯 TP: ~$3,330–3,340
❌ SL: ~$3,360
BUY XAU/USD: $3,330–3,335
🎯 TP: ~$3,350–3,360
❌ SL: ~$3,320

XAUUSD Analysis todayHello traders, this is a complete multiple timeframe analysis of this pair. We see could find significant trading opportunities as per analysis upon price action confirmation we may take this trade. Smash the like button if you find value in this analysis and drop a comment if you have any questions or let me know which pair to cover in my next analysis.
