XAUUSDHello Traders! 👋
What are your thoughts on GOLD?
Gold failed to break through the key resistance zone near the recent highs and got rejected. Additionally, the ascending trendline has been broken, with price now trading below it.
While the long-term outlook remains bullish, the short-term bias has shifted to bearish, and we expect further downside toward the next support levels.
Don’t forget to like and share your thoughts in the comments! ❤️
Goldsignals

Gold Potential Bullish ContinuationAfter retracing to the approx. 3370 - 3380 zone, gold still seems to exhibit signs of overall potential Bullish momentum as the price action may form a credible Higher Low with multiple confluences through key Fibonacci and Support levels which presents us with a potential long opportunity.
Trade Plan:
Entry : CMP 3393
Stop Loss : 3286
TP : 3499 (Before All Time High)

Gold Likely to Retrace Short-Term – Hot PPI Caps Gains📊 Market Overview:
Gold is facing mild downward pressure after July’s US PPI rose 3.3% YoY, stronger than expected, reducing optimism for an aggressive 50 bps Fed rate cut next meeting. Safe-haven demand remains supported by geopolitical risks ahead of the Trump–Putin meeting, but Fed caution is capping further upside.
📉 Technical Analysis:
• Key Resistance: ~$3,370 (near-term), ~$3,400 (major)
• Nearest Support: ~$3,345 (near-term), ~$3,330–$3,340 (major)
• EMA 09: Price is currently below EMA 09, indicating a mild short-term bearish bias.
• Candlestick / Volume / Momentum: Current structure shows a mild retracement with steady volume; momentum softens as hot inflation data limits upside potential.
📌 Outlook:
Gold may continue easing in the short term if US economic data remains strong. A rebound above resistance could occur if rate-cut expectations revive or geopolitical tensions escalate.
________________________________________
💡 Trade Strategy Suggestion:
🔻 SELL XAU/USD: $3,369–$3,372
🎯 TP: 40/80/200 pips
❌ SL: ~$3,375
🔺 BUY XAU/USD : $3,330–$3,333
🎯 TP: 40/80/200 pips
❌ SL: ~$3,327

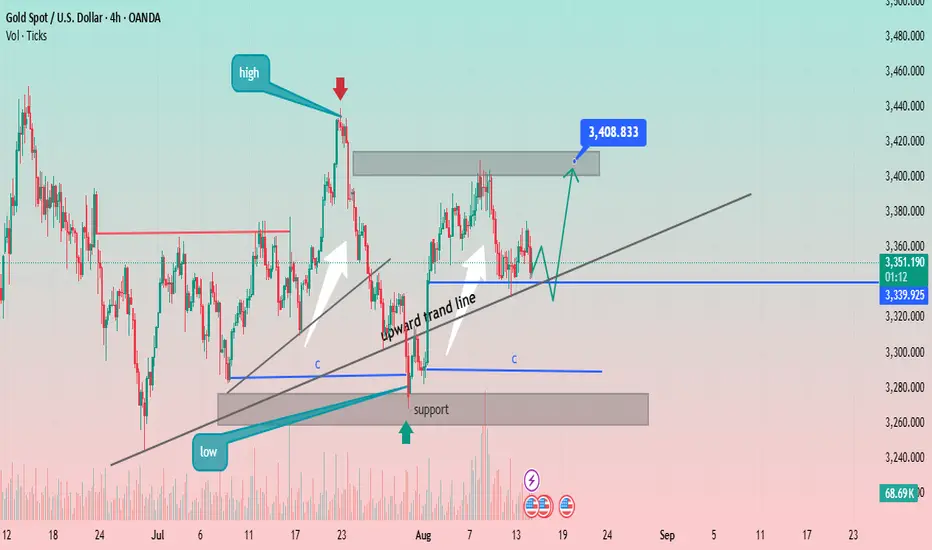
XAUUSD Bullish Trend Continuation: Potential Move to $3,400!The price action shows a higher high ("high") and a higher low ("low"), which are characteristic of an uptrend. An upward trendline has been established, connecting a series of higher lows, which is acting as a dynamic support level. A significant horizontal support zone has also been identified around the $3,260 - $3,280 price range, where the price previously found support.
Recently, the price experienced a pullback and bounced off the upward trendline. The analysis anticipates a continuation of the upward momentum toward a key resistance zone. This resistance zone is located around the $3,400 - $3,420 level. A specific target price of $3,408.833 is highlighted within this zone, suggesting a potential area where the upward movement might pause or reverse.
The chart includes a potential corrective wave pattern labeled with "C"s, indicating a recent three-wave pullback within the larger trend. The current price is shown at $3,353.520, positioned above both the horizontal support and the upward trendline, reinforcing the bullish sentiment.
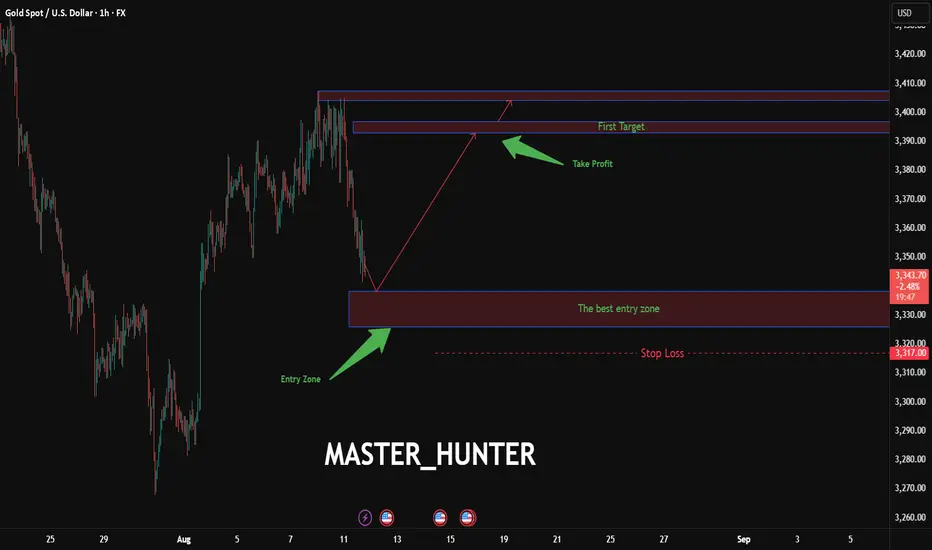
XAU/USD: Gold Rocket to 3407 Unleashed?FX:XAUUSD is primed for a explosive breakout on the 1-hou r chart, with an entry zone at 3326-3338 near a bullish pivot.
First target at 3393 , with a second target at 3407 smashing through resistance.
Set a tight stop at 3317 to lock in risk. A surge past 3340 with volume could ignite this gold rocket. Watch USD weakness and global risk appetite. Get ready to soar!
I will gladly see your comments
#XAUUSD #GoldTrading #ForexSignals #TechnicalAnalysis #TradingView #DayTrading #MarketAnalysis
Gold Holds Around $3,350 After Volatile Swings📊 Market Overview:
Gold is currently steady around $3,350/oz after intraday moves between $3,341 and $3,375, according to Investing.com. Reuters reports spot gold near $3,357.65/oz, supported by expectations of Fed rate cuts and a softer USD.
📉 Technical Analysis:
• Key Resistance: $3,400
• Nearest Support: $3,341 – $3,342
• EMA 09: Price is hovering near the 9-day EMA, showing a short-term neutral bias.
• Candlestick / Volume / Momentum: Small-bodied candles with long wicks indicate market indecision, awaiting clear macroeconomic cues.
📌 Outlook:
Gold may range sideways around $3,350 in the short term unless new economic data triggers strong movement. A weaker dollar or stronger rate-cut expectations could lift prices toward $3,360–$3,400, while renewed USD strength may pressure gold down to $3,340 or lower.
💡 Suggested Trading Strategy:
SELL XAU/USD: $3,362 – $3,365
🎯 TP: 40/80/200 pips
❌ SL: $3,368
BUY XAU/USD: $3,340 – $3,343
🎯 TP: $3,360
❌ SL: $3,337

Xauusd still Bullish??? NoHey Traders
i am expecting Xauusd/Gold if closed above 3342$ can make a upside move on 4hr time frame and if we close below 3340 we have potential to hit 3202$ this week so how to trade it??? well just wait for 4h candle to close if we closed above the levels i said above GO long or else Short the falling knife.

Gold Extends Rally as Rate-Cut Expectations Rise📊 Market Overview:
Gold prices extended gains for the third consecutive session, supported by rising expectations that the US Federal Reserve will cut interest rates in September, following softer US inflation data and a weaker US dollar.
📉 Technical Analysis:
• Key Resistance: $3,400 / $3,435
• Nearest Support: $3,358–$3,360 / $3,345
• EMA: Price is trading above EMA50 → bullish short-term signal.
• Candle / Volume / Momentum: Forming an ascending triangle pattern with positive momentum, suggesting potential for further upside.
📌 Outlook:
Gold may continue to rise in the short term if it breaks and sustains above $3,400. A drop below $3,360 could trigger a pullback toward $3,3345.
💡 Trade Strategy Suggestions:
🔻 SELL XAU/USD: $3,400–$3,403
🎯 TP: 40/80/200 PIPS
🛑 SL: $3,406
🔺 BUY XAU/USD : $3,350–$3,353
🎯 TP: 40/80/200 PIPS
🛑 SL: $3,347
XAUUSD Analysis todayHello traders, this is a complete multiple timeframe analysis of this pair. We see could find significant trading opportunities as per analysis upon price action confirmation we may take this trade. Smash the like button if you find value in this analysis and drop a comment if you have any questions or let me know which pair to cover in my next analysis.

Gold: Bearish Momentum Poised to ResumeFenzoFx—Gold opened the London session by sweeping liquidity below the previous day's low and is now consolidating above the $3,342.0 support.
Technically, bearish momentum is expected to resume. A break below $3,342.0 could lead XAU/USD to partially fill the bullish FVG, with support at $3,314.0.

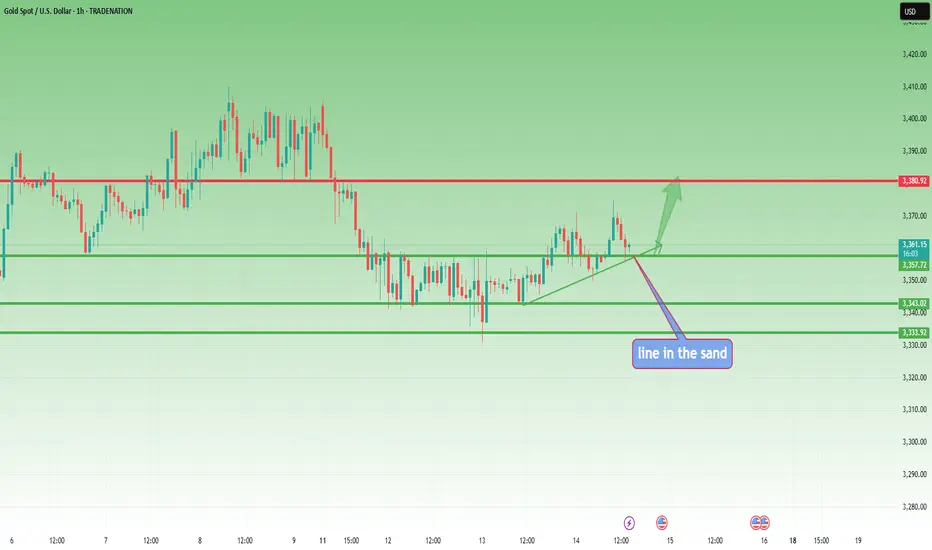
Gold – Bulls Still in Control, but Caution NeededIn yesterday’s analysis, I mentioned that Gold could reverse to the upside and challenge the 3375–3380 resistance zone. Throughout the day, dips were consistently bought, and last night the price briefly tapped into that area.
The overall structure remains bullish, but there are a few important notes:
1. Price action continues to be choppy.
2. Gold reversed quickly from 3375 overnight, which calls for caution from the bulls.
3. The 3350–3355 zone is the line in the sand — it is imperative for bulls to keep the price above this level.
That being said, and with the caution mentioned above, I remain bullish and expect another test of 3375, and potentially even a move beyond 3380. 🚀
Disclosure: I am part of TradeNation's Influencer program and receive a monthly fee for using their TradingView charts in my analyses and educational articles.
Gold Gains Amid USD Weakness📊 Market Overview:
Gold rose modestly as the U.S. dollar weakened following softer-than-expected July CPI data, increasing the likelihood of a Federal Reserve rate cut in September. Geopolitical tensions surrounding the Trump–Putin meeting and ongoing trade war developments further supported demand for safe-haven assets like gold.
📉 Technical Analysis:
• Key Resistance: $3,360–$3,361 (near EMA50 area), $3,375–$3,380 (major resistance zone, 0.618 Fibonacci & option barrier)
• Nearest Support: $3,350–$3,351 (break below may lead to downside at $3,325), additional supports at $3,336, $3,324, $3,313
• EMA: Short-term trend neutral, slight bearish bias near resistance
• Candlestick / Volume / Momentum: RSI on H1 around 45–50 (neutral), volume declining, possible upcoming breakout
📌 Outlook:
Gold may continue to edge higher in the near term if it breaks resistance at $3,361 with strong volume and the USD remains weak. Otherwise, failure to surpass $3,375–$3,380 could lead to pullback toward support at $3,350 or further down to $3,330–$3,325.
________________________________________
💡 Suggested Trading Strategy:
🔺 BUY XAU/USD
Entry: 3,320 – 3,323
🎯 TP: 40/80/200 pips
❌ SL: 3,317
🔻 SELL XAU/USD
Entry: 3,375–3,378
🎯 TP: 40/80/200 pips
❌ SL: 3,381

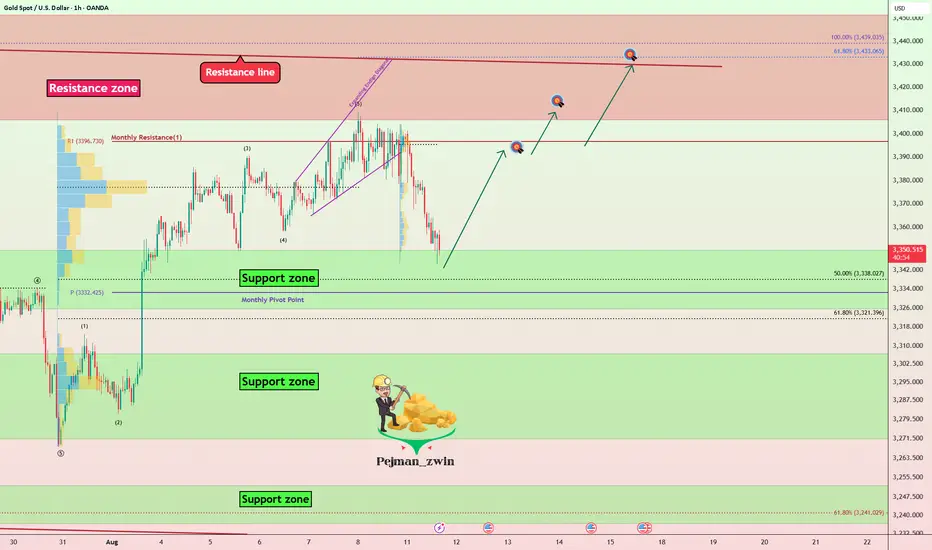
Gold Correction Ending — Time for the Next Rally?Gold ( OANDA:XAUUSD ) is currently moving near the Support zone($3,350-$3,326) and the Monthly Pivot Point .
In terms of Elliott Wave theory , it seems that Gold is completing a corrective wave, and we should wait for the next impulse wave .
I expect Gold to start rising from the Support zone($3,350-$3,326) and rise to at least $3,393 .
Second Target: $3,407
Third Target: $3,427
Note: Stop Loss (SL) = $3,317
Gold Analyze (XAUUSD), 1-hour time frame.
Be sure to follow the updated ideas.
Do not forget to put a Stop loss for your positions (For every position you want to open).
Please follow your strategy; this is just my idea, and I will gladly see your ideas in this post.
Please do not forget the ✅ ' like ' ✅ button 🙏😊 & Share it with your friends; thanks, and Trade safe.
EURUSD GBPUSD and DXY Analysis todayHello traders, this is a complete multiple timeframe analysis of this pair. We see could find significant trading opportunities as per analysis upon price action confirmation we may take this trade. Smash the like button if you find value in this analysis and drop a comment if you have any questions or let me know which pair to cover in my next analysis.

Gold: Bullish Setup Builds Above $3,352.0FenzoFx—Gold has taken out the previous day's high, currently testing this level as support. The immediate support is at $3,352.0, below the bullish candle that broke the resistance.
From a technical perspective, the uptrend will likely resume if the support holds. In this scenario, the next bullish target will likely be the order block with the highest resistance price at $3,380.

Gold Poised for Mild Rebound amid Tariff Relief📊 Market Movement:
Gold eased after President Trump announced tariff exclusions on imported gold bars, easing prior market uncertainty. Safe-haven demand stays supported by macroeconomic and Fed policy concerns.
📉 Technical Analysis:
• Key Resistance: $3,385 – $3,410 – $3,460
• Nearest Support: $3,330 – $3,332
• EMA: Price fluctuates around medium-term EMA.
• Candlestick / Momentum: Ascending triangle, neutral RSI, rising volume → mild accumulation signs.
📌 Outlook:
Gold may see a mild rebound in the short term if trade policy remains stable and the Fed keeps rates unchanged. Strong US economic data could pressure prices downward.
________________________________________
💡 Suggested Trading Plan
🔻 SELL XAU/USD: $3,410–$3,413
🎯 TP: 40/80/200 pips
❌ SL: $3,416
🔺 BUY XAU/USD: $3,330–$3,333
🎯 TP: 40/80/200 pips
❌ SL: $3,327

XAUUSD on the verge of price explosion to $3800.Gold (XAUUSD) has been trading within nearly a 2-year Channel Up. Despite the red start to this week, we have had a strong bullish confirmation signal prior, as the price hit and rebounded on its 1D MA100 (red trend-line).
The 1W MA50 (blue trend-line) may be the Channel's natural Support throughout all this time but its the 1D MA100 that every time it's been touched, it initiated the pattern's technical Bullish Legs.
As you can see this always takes place after an Accumulation/ Consolidation period and the minimum rise it has produced was +18.53%.
If we repeat this bear minimum, we are looking at a $3800 Target before the end of the year.
-------------------------------------------------------------------------------
** Please LIKE 👍, FOLLOW ✅, SHARE 🙌 and COMMENT ✍ if you enjoy this idea! Also share your ideas and charts in the comments section below! This is best way to keep it relevant, support us, keep the content here free and allow the idea to reach as many people as possible. **
-------------------------------------------------------------------------------
Disclosure: I am part of Trade Nation's Influencer program and receive a monthly fee for using their TradingView charts in my analysis.
💸💸💸💸💸💸
👇 👇 👇 👇 👇 👇

XAUUSD Analysis todayHello traders, this is a complete multiple timeframe analysis of this pair. We see could find significant trading opportunities as per analysis upon price action confirmation we may take this trade. Smash the like button if you find value in this analysis and drop a comment if you have any questions or let me know which pair to cover in my next analysis.

Gold Retesting Support 3,350–3,345-Short-Term Buying Opportunity📊 Market Overview
Gold is currently trading around 3,350 USD/oz, slightly higher than the previous session thanks to expectations that the Fed will cut interest rates amid a weakening USD. The market remains cautious ahead of upcoming U.S. inflation data, which could provide new momentum for gold prices. Additionally, President Trump’s confirmation that gold imports will not face tariffs has helped stabilize investor sentiment.
📉 Technical Analysis
• Key Resistance: 3,400 – 3,410 USD/oz
• Nearest Support: 3,345 – 3,350 USD/oz
• EMA09: Price is currently below the EMA09 on the H1 timeframe → short-term downward pressure still persists.
• Candlestick / Volume / Momentum: After a sharp drop on August 11, price is sideways around the support zone; RSI on H1 is about 56, not yet overbought, indicating potential for a rebound if support holds.
📌 Outlook
Gold could rebound short term from the 3,350–3,345 zone if U.S. inflation data comes in lower than expected and the USD continues to weaken. However, if price breaks below 3,345 with strong selling pressure, the downtrend may extend to 3,335 or 3,330.
💡 Suggested Trading Strategy
BUY XAU/USD: 3,346 – 3,343 USD/oz
🎯 TP: 40/80/200 pips
❌ SL: 3,339 USD
SELL XAU/USD: 3,407 – 3,410 USD/oz
🎯 TP: 40/80/200 pips
❌ SL: 3,413 USD

Gold Breaks $3,352 Support – Further Downside Risk📊 Market Overview:
• Spot gold is now trading at $3,352–3,356/oz, sliding sharply on profit-taking and uncertainty over potential U.S. import tariffs on gold.
• Weak buying interest at support pushed the price below the 200-hour MA, opening the door for deeper declines.
📉 Technical Analysis:
• Key resistance: $3,360–$3,365
• Nearest support: $3,345; next at $3,330
• EMA 09: Price remains below EMA09 → short-term trend is bearish
• Momentum: RSI below 45, sellers maintain control
📌 Outlook:
• Gold may continue to decline toward $3,345 or $3,330 if the H1 candle closes below $3,350.
• Only a break back above $3,365 with strong volume could trigger a short-term reversal.
💡 Suggested Trading Strategy:
SELL XAU/USD: $3,362–3,365
🎯 TP: 40/80/200 pips
❌ SL: $3,368
BUY XAU/USD: $3,345–$3,348 (only if clear bullish reversal candlestick forms)
🎯 TP: 40/80/200 pips
❌ SL: $3,342

Gold Sideways, Awaiting Breakout Confirmation📊 Market Overview:
Gold on the H1 chart is consolidating between $3,375 and $3,404, with buying and selling pressure balanced ahead of U.S. CPI data. Narrow H1 candles suggest imminent volatility.
📉 Technical Analysis:
• Key Resistance: $3.400–$3.410
• Nearest Support: $3.358–$3.351
• EMA: Price hovering around EMA 50, with EMA 9 crossing below EMA 21 → short-term bias slightly bearish.
• Pattern / Momentum: MACD losing bullish momentum, RSI neutral at 48–50, Inside Bar pattern forming on H1.
📌 Outlook:
• A break below $3.351 could drive gold toward $3.333–$3.321.
• Holding above $3.370 and breaking $3.400 could target $3.410–$3.420.
💡 Suggested Trading Strategy:
🔻 SELL XAU/USD : $3.397–$3.400
🎯 TP: 40/80/200 pips
❌ SL: $3.403
🔺 BUY XAU/USD : $3.352–$3.355
🎯 TP: 40/80/200 pips
❌ SL: $3.349

Gold (xauusd): still bullishHello guys!
Price is moving inside an ascending channel.
Recently bounced from mid-channel support (“last kiss”) and heading toward channel resistance.
Potential upside target: $3,435 zone.
As long as the price stays above mid-line support, bullish momentum remains intact.

XAUUSD Analysis todayHello traders, this is a complete multiple timeframe analysis of this pair. We see could find significant trading opportunities as per analysis upon price action confirmation we may take this trade. Smash the like button if you find value in this analysis and drop a comment if you have any questions or let me know which pair to cover in my next analysis.
