XAUUSD: Double top pattern completed, gold confirms reversalContrary to the vast majority of people's beliefs, OANDA:XAUUSD was unable to break through the old peak at $4380/oz to move above the $4400/oz area but formed a double top pattern on the 1 hour timeframes and corrected downwards with a record margin from $4380 to near $4000/oz.
With these factors, we can almost certainly conclude that gold has completed this rally and will begin to correct downwards in the near future.
Looking through the options market, almost all traders have withdrawn all Longcall contracts from the market and a large number of Longput contracts have been pushed in.
This further reinforces the fact that the price has begun to enter a downward correction cycle in the near future.
Some key levels that we need to pay attention to in today's trading session:
Resistance: , , ,
Support:
Margin zone support:
Strong support:
Always be patient and wait for the price to reach the support and resistance zones above and get confirmation. Do not place limit orders or enter orders when the price is increasing or decreasing sharply.
Take advantage of the above support and resistance zones and trade short-term when the price reacts at these support and resistance zones.
Take profit when the price moves from 10 to 20 prices since entering the order at the support and resistance areas.
Wait for reactions such as Engulfing candles, Doji,... at the support and resistance zones.
Always set stop loss when trading and manage risks closely.
Note: Price may spike through support or resistance levels and then reverse. Therefore, it is crucial to patiently wait for the candle to close before entering a trade.
Victor Dan @ ZuperView
Goldsignals

This Could be the Final Chance to Catch Gold at $4,000FenzoFx—Gold lost 8.00% last day and slightly touched last week's low at $4,007.0. Currently, the price closed above the SMA 8 with a prior 4-hour long-wick bullish candlestick pattern. This price action promises the uptrend will likely resume.
However, wicks are considered as gaps in trading. Therefore, we expect the price to decline toward $4,045.0. If this level holds, the uptrend will likely resume, targeting $4,200.0 in the short term. On the other hand, if the price closes below $4,007.0, we expect the price to revisit $3,900.0.
Please note that last day's sell-off is NOT a market crash. The price only visited last week's low, meaning it erased one week's earnings.

SILVER (XAGUSD): Correction is Over?!
Silver shows some strength after a test of a key intraday support.
A formation of a rejection candle followed by a buying imbalance
suggests a highly probable rise.
Goal - 50.15
❤️Please, support my work with like, thank you!❤️
I am part of Trade Nation's Influencer program and receive a monthly fee for using their TradingView charts in my analysis.

Gold faces a technical correction – watching 4185–4190 zone📊 Market Overview:
Gold (XAU/USD) fell sharply from 4260 to 4190 during the Asian–European sessions before stabilizing near 4195. Selling pressure came mainly from rising US bond yields and a stronger USD. However, the 4185–4190 support area may trigger technical buying in the upcoming US session.
📢Technical Analysis:
• Support: 4185 – 4178 – 4162
• Resistance: 4212 – 4230 – 4250
• Price remains below the EMA50 (H1), keeping the short-term bias bearish.
• Narrowing candles on H1 suggest market compression ahead of the US session.
• A close below 4185 could extend losses toward 4170–4160; holding above may trigger a rebound to 4210–4230.
💡 Outlook:
Gold is in a corrective phase with sellers still dominant. The 4185–4190 zone is a key short-term pivot for direction confirmation.
🎯 Trade Idea:
🔻 SELL XAU/USD : 4225–4228
🎯 TP: 40 / 80 / 200 pips
🛑 SL: 4231

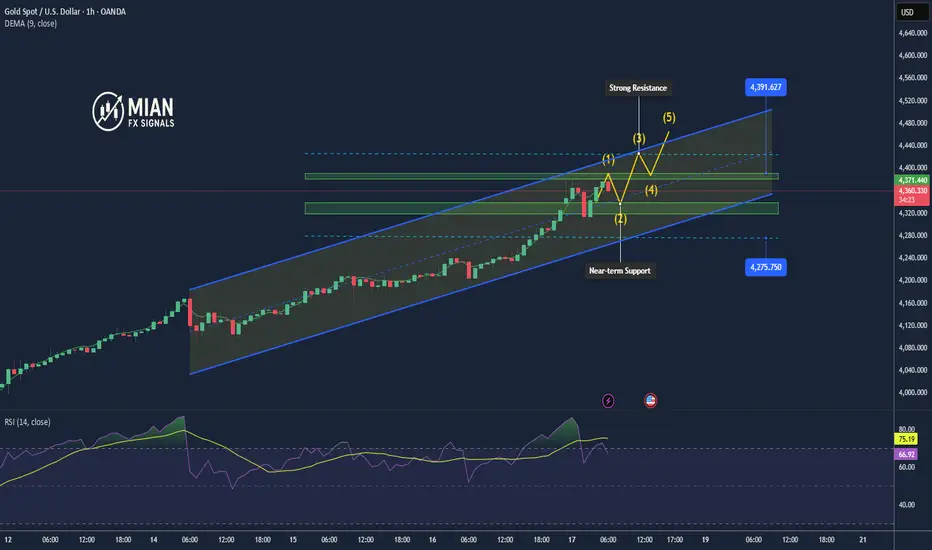
Gold Double Top Forming – Correction Ahead?When an asset hits an All-Time High(ATH) , technical analysis can get a bit tricky because there’s no historical resistance above and the usual technical rules might have less impact. However, right now it seems like some technical principles are still visible on gold’s chart, at least on the 1-hour timeframe , and I’d like to share that with you.
At the moment, Gold has broken below the lower line of its ascending channel, the Support zone($4,320 – $4,279) , and the neckline of a Double Top Pattern . This could indicate the start of a short-term correction. Given how strong gold’s momentum has been in recent weeks, this correction might not last too long since gold remains very attractive globally.
From an Elliott Wave perspective , the formation of a double top pattern might signal the end of an impulsive wave and the beginning of a corrective phase .
I expect that in the next few hours, Gold could at least drop to the Double Top Pattern’s target around $4,183 . If Gold breaks the Support zone($4,193 – $4,156) , we could see a deeper correction .
Second target:$4,143
Stop Loss(SL): $4,385(Worst)
Please respect each other's ideas and express them politely if you agree or disagree.
Gold Analyze (XAUUSD), 1-hour time frame.
Be sure to follow the updated ideas.
Do not forget to put a Stop loss for your positions (For every position you want to open).
Please follow your strategy; this is just my idea, and I will gladly see your ideas in this post.
Please do not forget the ✅ ' like ' ✅ button 🙏😊 & Share it with your friends; thanks, and Trade safe.

Gold drops sharply – profit-taking pressure spreads💹 1. Market Overview
Gold (XAU/USD) continued its sharp correction today, falling from $4,347 → $4,318 after failing to sustain above the $4,382 high.
The decline mainly came from:
Heavy profit-taking near strong resistance zones.
USD rebound and Treasury yields rising again.
Market sentiment turned cautious as traders await Fed’s next move on the rate-cut cycle.
📊 2. Technical Analysis
• Short-term trend: Correction within the medium-term uptrend channel.
• Resistance zones: $4,340 – $4,355 | $4,370 – $4,382 – $4,400
• Support zones: $4,318 – $4,305 | $4,285 – $4,260 – $4,240
• EMA20 – EMA50 (H1): Price testing below EMA20 → needs H1 close above $4,330 to confirm recovery.
• RSI (H1): Down to 42 → correction pressure still dominant.
• Volume: Increased at $4,318 → possible dip-buying activity emerging.
🔮 3. Outlook
Gold is in a healthy technical correction after the strong rally.
The medium-term bullish trend remains valid as long as price holds above $4,285.
If a bullish reversal candle appears near $4,315–$4,320, buyers could re-enter.
A break below $4,300 could trigger a deeper fall to $4,285 – $4,260.
🎯 4. Trading Strategy
🔻 SELL XAU/USD : $4,419 – $4,421
🎯 TP: 40 / 80 / 200 pips
🛑 SL: $4,425
🔺 BUY XAU/USD: $4,303 – $4,300
🎯 TP: 40 / 80 / 200 pips
🛑 SL: $4,296

Gold Dips: Levels to Watch for Buy SetupsFenzoFx—Gold dipped 2.00% today, nearing the ascending trendline. This pattern has been seen multiple times in the current and previous month where Gold dips to provide new discount prices to go long.
Interestingly, volume did not decrease as significantly as the price. This means there are buyers that are constantly buying Gold or the current decline is manipulation. From a technical perspective, XAU/USD is in an uptrend.
The $4,236.0 support, which aligns with the trendline, is a decent entry point to join the bull market if the buying volume is significant at this level. The stop should be below $4,200.0 for this setup, targeting the all-time highs.

XAUUSD Analysis todayHello traders, this is a complete multiple timeframe analysis of this pair. We see could find significant trading opportunities as per analysis upon price action confirmation we may take this trade. Smash the like button if you find value in this analysis and drop a comment if you have any questions or let me know which pair to cover in my next analysis.

XAUUSD: Strong recovery, will gold continue to make new highs?OANDA:XAUUSD had a significant correction in the trading session at the end of last week, for most of yesterday's trading session we have not seen too strong bullish momentum.
However, during the New York Session, gold rose sharply under the push of large cash flows and with the emergence of some unsettling news, typically the fact that China could pay 155% tariffs if there is no agreement before November 1 (President Trump).
Looking at the options market in today's trading session, most traders are still apprehensive as the price is trading above the peak of 4350 – 4370 (calculated through the price of CFDs). However, most of the market is involved by longcall contracts, so I assess that in today's trading session, the price will continue to above $4400/ounce.
Some key levels that we need to pay attention to in today's trading session:
Resistance: ,
Support:
Support:
Strong support:
Margin Zone support:
Fair value gap (FVG):
Margin Zone + Strong suport + FVG => This will be a strong support zone in today's trading session
Always be patient and wait for the price to reach the support and resistance zones above and get confirmation. Do not place limit orders or enter orders when the price is increasing or decreasing sharply.
Take advantage of the above support and resistance zones and trade short-term when the price reacts at these support and resistance zones => Take profit when the price moves from 10 to 20 prices since entering the order at the support and resistance areas.
Wait for reactions such as Engulfing candles, Doji,... at the support and resistance zones.
Always set stop loss when trading and manage risks closely.
Note: Price may spike through support or resistance levels and then reverse. Therefore, it is crucial to patiently wait for the candle to close before entering a trade.
Victor Dan @ ZuperView

XAU/USD | First LONG, then SHORT! (READ THE CAPTION)By analyzing the Gold (XAUUSD) chart on the 15-minute timeframe, we can see that gold hit all targets between $4,300 and $4,350 and even rallied to $4,380.99, marking a new all-time high (ATH)!
After that, gold started to correct below $4,300, briefly dipping to $4,258 before bouncing back above $4,285. I expect that if the price moves into the $4,300–$4,317 zone, we may see a negative reaction or rejection from this area.
If that scenario plays out, gold could drop toward $4,250 as its first key target.
Keep a close eye on these levels — and if you have questions about gold’s trend, feel free to leave a comment using the link below!
Please support me with your likes and comments to motivate me to share more analysis with you and share your opinion about the possible trend of this chart with me !
Best Regards , Arman Shaban

BUY GOLD - XAUUSD- Amazing low risk high reward trade!Based on our deep analysis we can see that XAU/USD (gold) will head to the upside. Great time to BUY - it has broken all major resistance levels and has nowhere else to go except upwards. It is also struggling to break past powerful support levels. Buy gold!

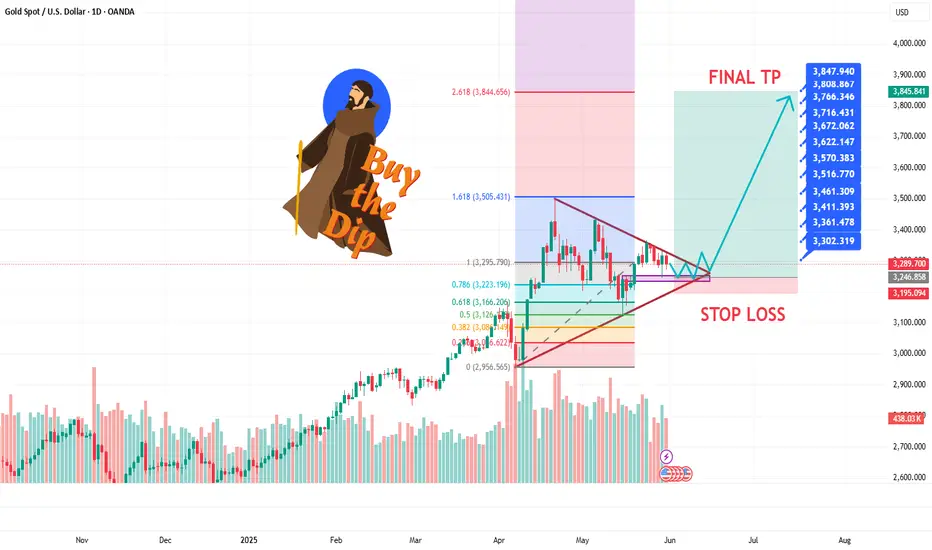
GOLD Is this a Super Cycle??XAUUSD (Gold) has been rising non-stop basically since the last time it made contact with (and bounced on) the 1M MA50 (blue trend-line) two years ago (October 2023). Contrary to what many believe, a technical correction may not be coming soon as this long-term bullish trend resembles the Super Cycle that started in the early 2001.
So far Gold is within a Channel Up since 2018 and the next correction may take place well within 2026 and closer to the 3.0 Fibonacci extension. In any case, if this is indeed a new such Super Cycle, Gold represents a sound long-term investment up until at least $8000, which would be again a +660% rise from the Bear Cycle's bottom (as in the previous Cycle).
Do you think history will repeat itself?
-------------------------------------------------------------------------------
** Please LIKE 👍, FOLLOW ✅, SHARE 🙌 and COMMENT ✍ if you enjoy this idea! Also share your ideas and charts in the comments section below! This is best way to keep it relevant, support us, keep the content here free and allow the idea to reach as many people as possible. **
-------------------------------------------------------------------------------
💸💸💸💸💸💸
👇 👇 👇 👇 👇 👇

THE KOG REPORTTHE KOG REPORT:
In last week’s KOG Report we gave the bias level as bullish above 4003 and the red box we would be looking for to break to then confirm the move into the region we wanted. The move played well from the opening going on to complete all the red box targets together with our algo targets on gold.
Although it being risky we wanted to short from the given region, but due to price breaking through without even halting, we updated traders with the higher region we were looking to target, which also worked well.
On Friday, we managed to identify the pattern we wanted and activated a target of 4197 together with the break below the bias level. This for us again worked well to end the week with a wonderful short and then a TAP AND BOUNCE from the indicator level giving those who missed the short and opportunity to capture a 200pip long to end the week.
A phenomenal week in Camelot, not just on Gold but the many other pairs we trade and analyse.
So, what can we expect in the week ahead?
So, this week I have a bit of a concern with this bearish move. I have a sneaky suspicion that they may not have completed upside as yet, and instead, want to get traders in to thinking the retracement has started. Just a inkling for now so let’s see how the week opens and what region we attack first.
Above, I have a reversal on the hourly and the 4H chart but the daily, weekly and monthly are still suggesting higher pricing. Ideally, we need another bearish day for price to leave the 4200’s and come close to the 4150 level to hold before we decide we’re going to either consolidate and accumulate here or get a deeper pull back. Below, we have 4220 which is the level that will need to break for us to go lower with the initial target below being 4165 and below that 4129.
Our key level here initially is the 4295 level and above that 4310. 4310 is the line in the sand for bulls to attempt to break to go higher and complete the move back above to create another all time high. Failure, and we should get more confirmation of a deeper pull back that should attempt to target the lower 4000 mark.
As usual, we’ll let the algo confirm the move, the indicators will tell us which way to stay in, and the liquidity indicator will tell us when to play caution. For now, the path is on the chart, let’s see how we open and begin the week.
KOG’s bias of the week:
Bullish above 4230
Bearish below 4220
RED BOXES:
Break above 4255 for 4265, 4270, 4284 and 4304 in extension of the move
Break below 4237 for 4230, 4220, 4210, 4206, 4185 and 4177 in extension of the move
Please do support us by hitting the like button, leaving a comment, and giving us a follow. We’ve been doing this for a long time now providing traders with in-depth free analysis on Gold, so your likes and comments are very much appreciated.
As always, trade safe.
KOG

Gold consolidates around 4264 – safe entries within narrow range🟡 Market Overview
Gold trades around $4264/oz, showing mild bullish pressure during the European session.
The market remains range-bound but buyers still dominate slightly.
Traders are awaiting upcoming Fed remarks and US PMI data for clearer direction.
📊 Technical Analysis
• Resistance: $4272 – $4275 - $4228
• Support: $4255 – $4252 - $4290
• Price stays above EMA50 (H1), maintaining short-term bullish bias.
• Neutral RSI suggests potential sideways accumulation before breakout.
💡 Outlook
Gold is stabilizing within a tight range.
The safe plan is to wait for H1 candle confirmation at either boundary:
• Buy near $4252–$4255 if support holds.
• Sell near $4272–$4275 if rejection occurs.
________________________________________
🎯 Trading Plan
🔻 SELL XAU/USD
Entry: $4272 – $4275
🎯 TP: 40 / 80 / 200 pips
🛑 SL: $4278
🔺 BUY XAU/USD
Entry: $4246 – $4243
🎯 TP: 40 / 80 / 200 pips
🛑 SL: $4240

XAUUSD: Has gold made a peak?OANDA:XAUUSD had a strong correction day at the end of last week with strong selling pressure, the rhythm of recovery does not make too much sense when the price is still sideways in the range of 4220 – 4270.
In previous corrections, we have seen that the price has always recovered strongly immediately, however in the current situation, the price has not made any attempt to rise again => Reinforce the fact that the price has made a peak and started a short-term correction.
In the Options market, there has been a large number of Longput contracts and Longcall contracts are gradually being withdrawn from the market , so I think the price will not be able to rise in today's trading session.
Some key levels are important in today's trading session:
Resistance: ,
Strong support:
Daily balance:
Daily balance is the temporary equilibrium level of the market in today's trading session, if the price breaks this balance, the price will look for lower value areas.
Always be patient and wait for the price to reach the support and resistance zones above and get confirmation. Do not place limit orders or enter orders when the price is increasing or decreasing sharply.
Take advantage of the above support and resistance zones and trade short-term when the price reacts at these support and resistance zones and take profit when price moves 10 to 20 prices from support and resistance zones.
Wait for reactions such as Engulfing candles, Doji,... at the support and resistance zones.
Always set stop losses when trading and manage risks closely.
Victor Dan @ ZuperView

GOLD AND WAR NEXT TO 4K$Hello traders
as i can see gold is trading in a Decending Triangle zone and it had tested Fibo 0.61 ratio in month of may dip as we can see gold close monthly candle above 3280 zone which is a clear sign that big players and banks are still prefer Safe haven we can see US econmey in a bad recession zone unemployment and higher inflation is a big problrm for $ and on all these things Mr. Trump Tariffs is a game changer in commodities markets if we see Geopolitical issues around the world it esculating more war in diffrent regions of the world.. Now Israiel & US have a new biggest problem Iran which is showing us a attack on Iran can be happen incoming days as we can see 6 meetings was unsucessful in Oman for a Deal to Stop Iran's Nucler Enrichment Program which is not good... other then fundamental Charts are crystal clear and showing us a clear view for a New ATH on Gold our Risk reward ratio is prefect for us have a proper research before taking any trade its just an trade idea share your thoughts with us it will help many other traders Comments are open we love your comments and support the channel so it can diliver to many other new traders Stay Tuned for new updates ..
xauusdGold seems to be entering a short-term downtrend after an interesting rally.
If we see signs of selling at 4280-4330, I could sell on the 1-hour timeframe with a stop loss at the previous high.
Targets are 4200-4160-4110-4060-3960

XAUUSD Analysis todayHello traders, this is a complete multiple timeframe analysis of this pair. We see could find significant trading opportunities as per analysis upon price action confirmation we may take this trade. Smash the like button if you find value in this analysis and drop a comment if you have any questions or let me know which pair to cover in my next analysis.

GOLD (XAUUSD): Bullish Market Opening?!
We got a nice pullback on Gold on Friday
and the price nicely retraced to a key intraday support.
Analysing the market reaction to that, I spotted a cup & handle pattern
and a confirmed violation of its neckline.
With a high probability, the market will rise after the opening.
The price will reach at least 4272 intraday resistance.
❤️Please, support my work with like, thank you!❤️
I am part of Trade Nation's Influencer program and receive a monthly fee for using their TradingView charts in my analysis.

Gold (XAU/USD) – Bullish Rebound Expected from Key Support ZoneTechnical Structure
Uptrend Confirmation: Despite the pullback, the overall structure remains bullish — higher highs and higher lows are intact.
Support Zone (Green Box): The area between 4,132 – 4,197 acts as a strong demand region where a reversal is likely.
Target Point: The upside target lies near $4,378 – $4,381, coinciding with previous highs and resistance.
📈 Bullish Scenario
If price tests the support level and shows rejection (bullish candles or wicks), we can expect:
Entry: Around $4,160 – $4,200
Target: $4,380 – $4,381
Stop Loss: Below $4,120
This would confirm a continuation of the uptrend after a healthy correction.
📉 Bearish Scenario
If price breaks below $4,120, it could trigger:
Deeper correction toward $4,060 – $4,000
Momentum shift from bullish to short-term bearish.
🟢 Signal Summary
Direction Entry Zone Stop Loss Take Profit Confidence
BUY (Long) $4,160 – $4,200 $4,120 $4,380 ⭐⭐⭐⭐ (Strong if support holds)
⚠️ Conclusion
Gold is showing signs of retracement within an uptrend.
If the support zone holds, we can expect a bullish reversal toward the $4,380 target point.
However, a break below $4,120 will signal a deeper correction before any new rally.

Gold Consolidates After Hitting Record High–Uptrend Still Intact🔸 1. Market Overview
After reaching a new all-time high at 4,383, gold saw a sharp drop to 4,278, losing over 100 USD/oz before recovering. The price is now sideways within the narrow range of 4,340 – 4,350, reflecting short-term consolidation after strong volatility.
Traders are awaiting further signals from the Federal Reserve (Fed) regarding rate cuts, while geopolitical tensions and safe-haven demand continue to support gold in the medium term.
📊 2. Technical Analysis
• Immediate Resistance: 4,355 – 4,370
• Major Resistance: 4,382 (all-time high)
• Near Support: 4,330 – 4,320
• Key Support: 4,278
The EMA 50–100 continues to trend upward, confirming that the main trend remains bullish.
RSI (H1/H4) has returned to a neutral zone, showing temporary balance between buyers and sellers.
💡 3. Outlook
Gold is consolidating after a correction, and if the price holds above 4,320, the uptrend may resume toward 4,380 – 4,400.
Conversely, a break below 4,320 could trigger further short-term profit-taking toward 4,278.
🎯 4. Suggested Trading Strategy
🔺 BUY XAU/US: 4,335 – 4,330
🎯 TP: 40 / 80 / 200 pips
🛑 SL: 4,327

XAUUSD Analysis todayHello traders, this is a complete multiple timeframe analysis of this pair. We see could find significant trading opportunities as per analysis upon price action confirmation we may take this trade. Smash the like button if you find value in this analysis and drop a comment if you have any questions or let me know which pair to cover in my next analysis.

Uptrend Intact: Gold Eyes 4,400 After Sharp Pullback1. Market Overview
After reaching a new all-time high at 4,382, gold experienced a sharp correction down to 4,279, a drop of more than 100 USD/oz in a short time. However, strong dip-buying demand quickly emerged, helping the price rebound and trade back around 4,375, indicating that bullish sentiment remains dominant in the market.
The main drivers are expectations that the Federal Reserve (Fed) will cut interest rates earlier than expected, along with rising geopolitical tensions between major economies — reinforcing gold’s status as a safe-haven asset.
2. Technical Analysis
• Immediate Resistance: 4,382 – 4,390 (all-time high)
• Near-term Support: 4,340 – 4,320
• Major Support: 4,279 (recent correction low)
• EMA 50–100: Still trending upward, confirming that the main trend remains bullish.
• RSI (H1/H4): The overbought condition has been temporarily relieved after the correction, suggesting room for a new upward leg if price holds above 4,340.
3. Outlook
Gold is currently consolidating after a correction phase. If the price remains steady above 4,340, it is likely to continue toward 4,400 – 4,420.
Conversely, a break below 4,320 may trigger short-term profit-taking pressure.
4. Suggested Trading Strategy
🔺 BUY XAU/USD: 4,348 – 4,342
🎯 TP: 40 / 80 / 200 pips
🛑 SL: 4,335
🔻 SELL XAU/USD : 4,425 – 4,428
🎯 TP: 40 / 80 / 200 pips
🛑 SL: 4,431