HYMC Surges 19% on Record Silver GradesTitle: HYMC Surges 19% on Record Silver Grades: Mining Revival or Dilution Danger? Full Breakdown 📈💎
Hello TradingView community! 👋
Today, let's dive into HYMC with a detailed analysis focusing on fundamentals, SWOT, and technicals. This isn't financial advice: just an in-depth look based on public data. 🔍
Current Snapshot : 📊
Price: 42.07
52-Week High/Low: 58.73 / 2.22
Market Cap: 3.493B
Fundamental Analysis (e.g., Intrinsic Value and Ratios) : 💹
Using methods like discounted cash flow (DCF) or comparable analysis, estimate intrinsic value with inputs like EPS (-1.54 TTM), book value per share (0.87), and debt-to-equity (282.69). For instance, DCF models might project a value range of $13-130 based on growth assumptions, incorporating projected resource expansions from high-grade silver discoveries and elevated gold/silver prices, with analyst targets varying widely due to speculative nature (e.g., median $13 suggesting downside, but some at $130 implying upside if mining resumes profitably).
Compare to peers for relative valuation: HYMC's Price/Book (73.56) is elevated compared to junior miners (often 1-5x for producers), reflecting hype but no current production. Key ratios: ROE (-374.61%), P/E (N/A due to losses), and EV/EBITDA (-0.81) highlight efficiency and valuation status (potentially undervalued on asset basis but overvalued on earnings, with negative cash flows emphasizing development risks). 📊
SWOT Analysis (Strengths, Weaknesses, Opportunities, Threats) : ⚖️
Strengths : Vast land holdings (over 64,000 acres in Nevada's Hycroft mine), recent high-grade silver discoveries (e.g., longest continuous intercept in Vortex zone), and resilient exploration amid record gold/silver prices driving revenue potential once operational. 💪
Weaknesses : No current revenue or production, ongoing losses (-$1.54 EPS), high debt levels, and history of dilution through stock offerings. ⚠️
Opportunities : Resuming low-cost heap leaching operations in 2026, resource updates from 2025-2026 drill program, and expansion in emerging high-grade zones amid silver price surge (up 160% in past year). 🚀
Threats : Volatility in precious metals prices, funding uncertainties (e.g., recent shelf filings for $163M), regulatory hurdles in Nevada mining, and insider selling signaling potential concerns. 🛑
Technical and Risk Insights : 📉
Incorporate non-repainting indicators like 200-day SMA (9.96) for support/resistance: current price well above signals strong bullish trend. Current RSI (57.02) signals neutral, with no immediate overbought conditions despite recent surge.
Risk factors : Volatility (beta 2.64), or factor exposure (e.g., to commodity prices). Consider performance attribution: recent return largely from sector-wide gold/silver rally (gold up 67%, silver 160% past year) and company-specific drill results, rather than broad market moves. ⚡
Historical Context and Examples : 📜
HYMC has shown explosive 1,652% returns over 1 year, with examples like the December 2025 surge (over 100% on silver price highs and drill results leading to new 52-week highs). This illustrates how methods like SWOT or DCF can inform decisions in real markets, identifying opportunities during commodity booms but cautioning on dilution post-rallies. 🔄
What do you think: does this align with your view on HYMC for 2026? Share your analyses or charts below! 💬
#HYMC #StockAnalysis #FundamentalAnalysis #InvestingEducation
Goldstocks

AGI, GOLD-Market GEM, Major EXTENSION Because of THIS Factor!Hello There!
Welcome to my new analysis about AGI, a major gold-market gem I recently spotted, and added to my watchlist because of the major underlying factors prevalent here. As I already pointed out the major gold-market gems that are going to emerge with epic growth rates similar to those seen in the gold rushes within the gold market history, the most important part in my analysis and watchlist is to distinguish the diverging gold stock categories.
Because the major gold-backed currency-system implementation acceleration is not going to affect all of the gold stocks in the same manner!
The implementation of a gold-back currency system is important for three categories of Gold Stocks I detected:
1.) Gold Stocks that will emerge with a massive bullish volatility increase no matter the size of the gold-backed currency system implementation.
2.) Gold Stocks that will emerge with a massive bullish volatility increase when the necessary technology and high-tech are backing the gold-backed currency system implementation.
3.) Gold Stocks that will only emerge with a massive bullish volatility increase when the gold-backed currency system is implemented in a big enough economic field together with the necessary technology and high-tech backing.
Now, with distinguishing the major categories of gold stocks within the gold stocks market it is necessary to spot primarily those stocks that have the most potential to move along with the important real-time developments in the actual gold-backed currency-system implementation. Because, when the gold-backed currency-system implementation is moving forward with a simultaneous acceleration of the actual technology and high-tech gold market stocks of all three categories will have a substantial potential to accelerate with heavy bullish volatility growth rates when the economic field of gold-backed currency-system implementation is big enough.
Therefore, as I have analyzed AGI the gold stock falls into the first category of gold stocks within the market as the major bullish wave is already established and the underlying factors are supporting this bullish wave expansion. The gold-backed currency-system implementation no matter the size of the economic field is going to accelerate this trend dynamics heavily and the already established trend is going to increase at a minimum of 8x faster pace. AGI is a typical gold stock of category 1 as it is emerging with the underlying technicals as well as gold market backing to emerge with this major price action acceleration.
When looking at my chart AGI already completed this massive descending channel formation with a huge upper boundary breakout above which it accelerated and now moved further to mark a major formation structure with the main diamond-continuation-formation that is building up above the breakout areas. Furthermore, AGI already established the main underlying price-action-trend-dynamic with the coherent wave-count that is going to unfold the full potential once the breakout above the upper boundary has emerged as it is seen within my chart. Also highly important here is the fact that AGI already completed the main bullish EMA crossover with the 35-EMA marked in orange crossing above the 65-EMA.
Taking all these factors into consideration AGI is on the verge of the most epic breakout development within the whole price-action chart. Especially as it is already rallying this rally will accelerate heavily on the upcoming gold-backed currency-system implementations. The target zone only for this current ongoing trend is as marked within my chart within the 100 level and especially with the further continuation of the gold-backed currency-system trend with the necessary technology high-tech backing there is also potential to move beyond this level. Nonetheless, in this case, it is also highly crucial that not a severe inflation wave shows up within the market or the potential recession accelerates to a major depression because this is going to reverse into a more bearish perspective.
Nonetheless, currently, there are more factors determining this historical gold-backed currency trend expansion to emerge and therefore it should be the prevalent considerable scenario. Therefore I am going to keep the gold market gem on my watchlist and adjust to the most determining factors with the changes emerging.
In this manner, thank you everybody for watching my analysis of AGI. Support from your side is greatly appreciated.
VP

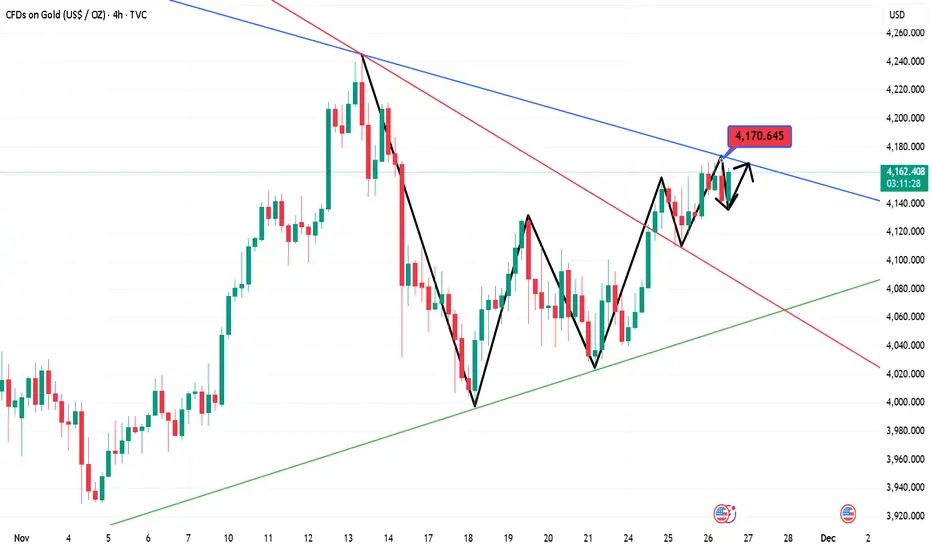
Gold Short-Term Trading GuideThe price action today has been generally above 4130. After breaking through to a high of 4173 in the European session, it entered a short-term consolidation phase, without a rapid pullback compared to previous periods. The US session is expected to see a pullback for consolidation. The strategy remains to buy on dips above 4110. Avoid chasing the price higher! Look for opportunities to buy on pullbacks.
Short-term Strategy
Buy gold above 4110, stop loss at 4100, target 4180-4200
Gold prices fluctuated on November 20th, awaiting the non-farm pThe 1-hour moving average for gold has started to turn upwards, and the overall trend remains one of upward fluctuation. However, the fluctuation is currently biased towards the upper end. Gold has tested the support area of 4050 multiple times in the past two days, and has basically managed to stabilize and continue rising. This indicates that the bulls still have significant support in the 4050-4000 area. If the support area of 4040 is not broken today, then gold can continue to be bought on dips. The road to the north is long, and patience is still required.

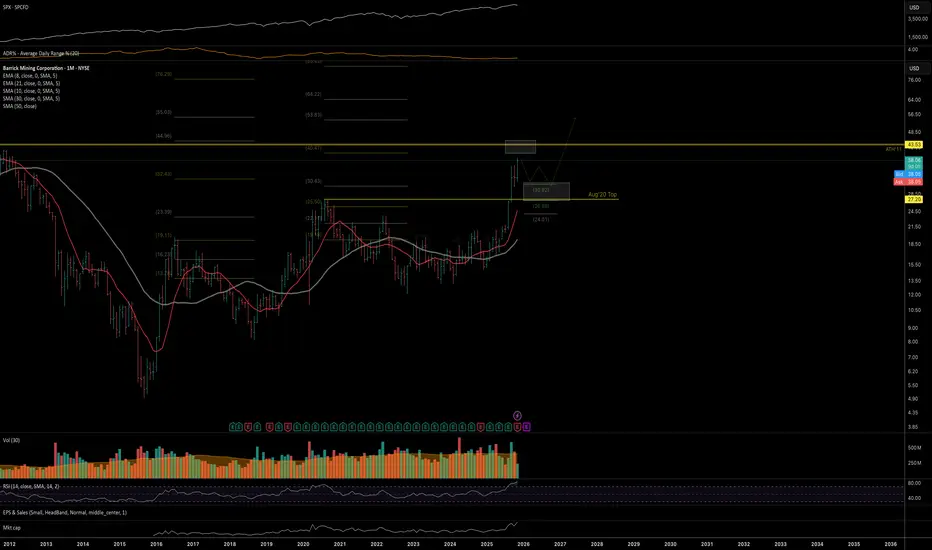
B: Macro trend-structurePrice may be approaching an important mid-term resistance in the low-40s, where a mid-term top formation is likely.
However, from the macro trend structure, any pullback into the 33–30 zone (retesting the Aug ‘20 highs) should provide a new buying opportunity, with the broader macro structure favoring a move above the 2011 ATH into 2026+.
Macro view (monthly chart):
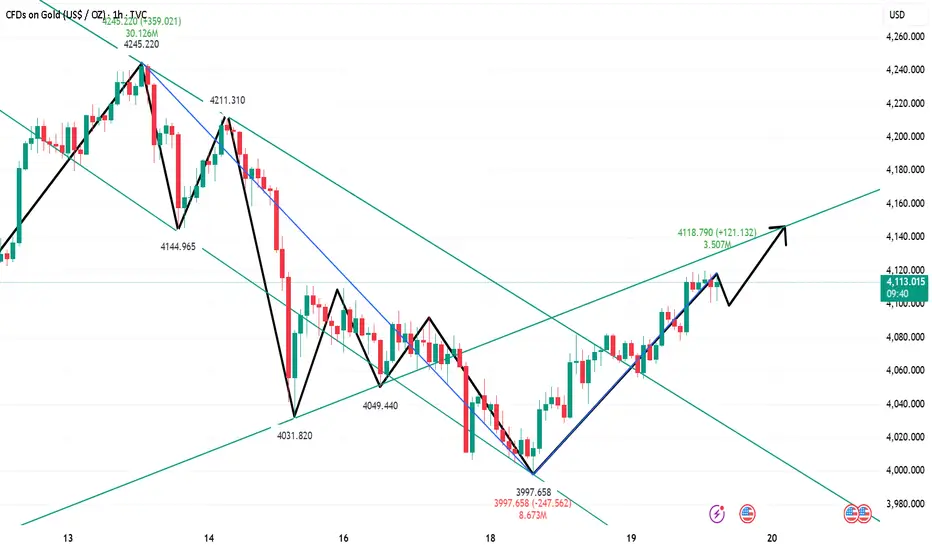
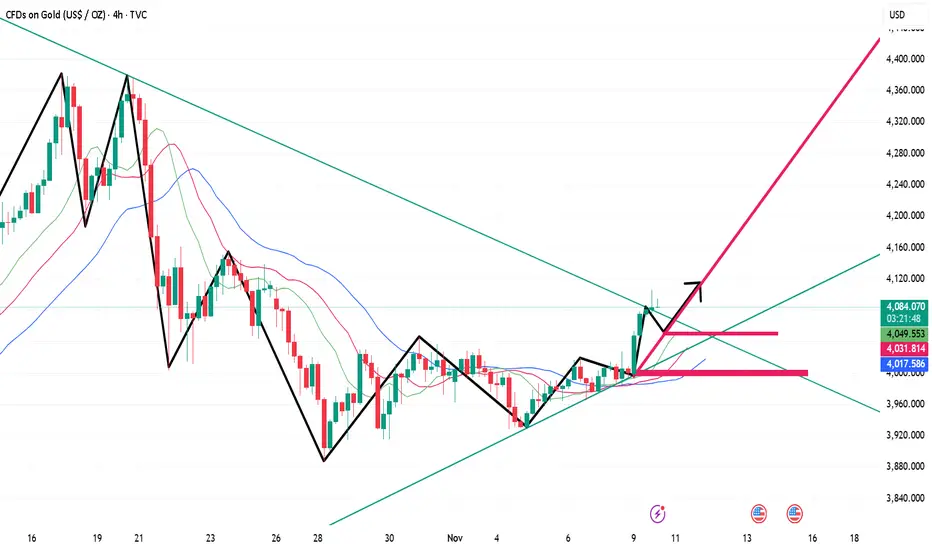
Gold pullback on November 19th: Buy on dips!The 1-hour moving average for gold has turned upwards, indicating continued upward momentum. After breaking through and stabilizing above 4100, gold is currently exhibiting a steady upward trend on the 1-hour chart. The 4090 area has formed short-term support, and buying on dips to this level presents a buying opportunity.
Gold: Buy at 4090, stop-loss at 4078, target 4150-4160;
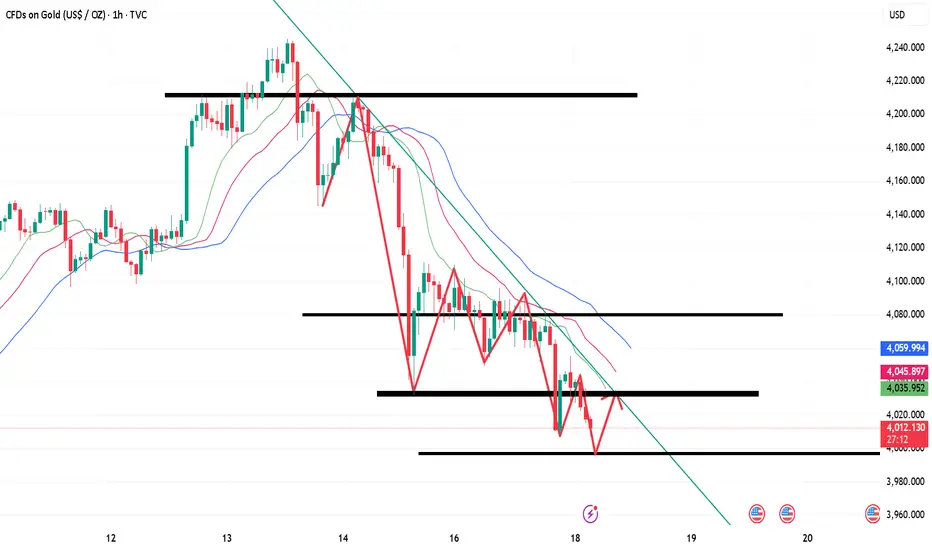
Gold Short-Term Trading Guide (November 18th)!!!The US released some unemployment claims data, and gold briefly broke through 4000 before experiencing a strong rebound. Is this rebound merely a flash in the pan due to the data, or will it help reverse the gold bullish trend?
First, we should note that gold is still generally weak. The 1-hour moving averages are still in a bearish crossover, indicating continued downward momentum. Gold is also still trading within a 1-hour downtrend channel. If gold continues to trade within this channel, the overall trend will likely remain one of oscillating decline. The upper resistance level of the 1-hour downtrend channel has now moved down to around 4068. If gold rallies below 4068, the strategy remains to sell on rallies.
Gold prices naturally fluctuate, just like the tides. Volatility creates opportunities. If gold cannot break through the 4068 level, the rebound may be short-lived. Until a break above 4068 is achieved, continue to sell on rallies.
US Session Trading Strategy:
Sell gold at 4060, stop loss at 4070, target 4000-3980;

Gold pullback on November 18th, expect a rebound.Gold prices are trading around 4015. For short positions, watch the 4050 level; a move to short at this level would be a good entry point. This level represents the low point of the initial upward move at the beginning of the week and has now become effective resistance. Hold this area for shorting. The 8-hour uptrend line provides support around 3993. If the price breaks below this uptrend line, the downtrend could accelerate, potentially reaching as low as 3924. Focus on shorting today; hold short positions below 4053 and prepare to maximize profits! Weak outlook! Specific and more winning entry points will be provided during the trading session! Take profits on the short positions!
#Intraday Strategy: Hold short positions below 4050 and maximize profits! Weak outlook!
Focus on the 3995-4005 range, a key support/resistance level!
Gold US Session Short-Term Technical Analysis Guide (November 13Gold is currently trending slightly higher on the 4-hour chart, maintaining a slightly bullish bias along the short-term moving averages. The price is currently trading near the previous resistance zone, but there hasn't been much room for a pullback. We should be wary of a potential continuation of the upward trend during the European and American sessions. On the hourly chart, after a second upward move from the highs, it's currently consolidating in a narrow range with insufficient momentum. We should watch for a pullback before a continuation of the upward trend. There's some divergence on the smaller timeframes; we should monitor the short-term correction and recovery.
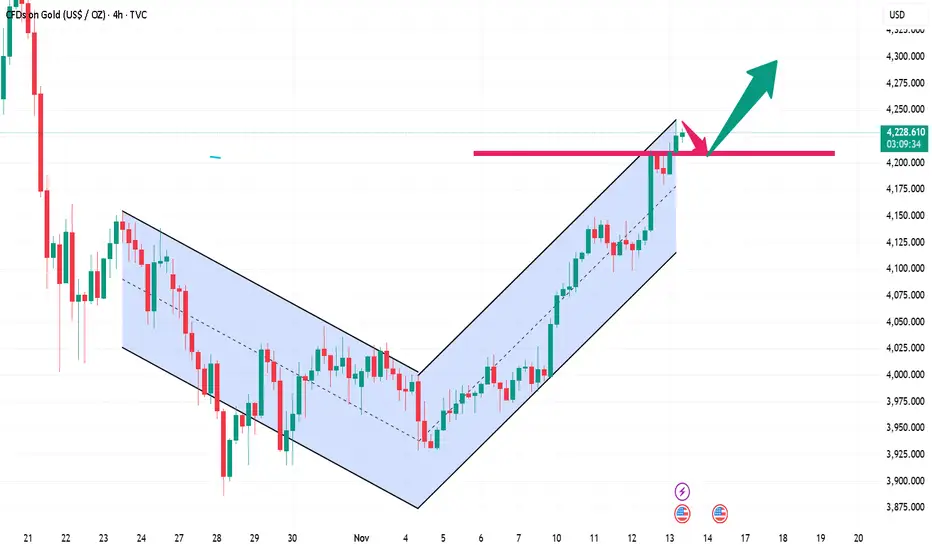
Gold is currently facing resistance in the 4140-4160 range.Gold # At the start of the week, gold experienced a long-awaited one-sided strong rally, surging nearly $110 intraday, a much stronger move than usual—even rare in the volatile months of September and October. The four-hour chart showed almost no pullback, maintaining an extremely strong upward trend throughout, perfectly matching our weekly prediction of a "full bullish candle," both unexpected and logical.
The daily chart closed with a long bullish candle with no upper or lower shadow, appearing within the current sideways consolidation pattern, typically indicating that the price is about to enter a 0.5 Fibonacci retracement level. Today, the key focus is on the 4140-60 resistance area, which coincides with the 50% Fibonacci retracement level of the previous high of 4385 to 3885, holding significant technical importance.
From a longer-term perspective, the gold price has retreated nearly $500 from the high of 4385 to 3885, confirming that the market has entered a high-level, wide-range consolidation phase. The current price rebound to around 4140 (a 50% retracement of the 4385-3885 range) can be considered a resistance level at the high point of the low-level consolidation range. The main trading range below this area is expected to be between 4160 and 3990.
Intraday Strategy:
Resistance Zone: Below 4140-60, a correction is expected; avoid chasing the price higher before a breakout.
Support Zone: 4100-4080 is the recent strong/weak dividing line; above this level, the structure remains strong.
Risk Control Point: If the price breaks below 4080-70, watch for a test of the 4040-30 support level.
Trading Strategy: Consider shorting at the resistance zone; if the price stabilizes at the support zone, focus on buying on dips.

Gold bulls are making a strong comeback; buy on dips and follow From the 4-hour chart, the current resistance level to watch is 4115-23, with a key resistance level at 4145. Short-term support is at 4060-68, with a key support level at the previous low of 4030-4035.
Gold Trading Strategy:
1. Buy gold on a pullback to 4063-68, add to the position on a pullback to 4047-55, stop loss at 4039, target 4100-4106, break above to 4120-28.
Gold continues to fluctuate; patiently await the onset of a downGold prices traded in a narrow range this week, fluctuating between 3925 and 4030. The overall volatility was not significant, indicating some market caution. However, since the second decline from 4381, gold prices have shown a pullback trend, oscillating around 4000. This pullback is a corrective move within a downtrend, suggesting further downside potential. The strategy of shorting on rallies remains unchanged. Continue to monitor the 4030-50 resistance level. If this level is not broken, the short-term bias will be bearish. Key support levels to watch are the 3950-60 and 3930-20 ranges. A break below these levels would lead to a break below the recent low of 3880. Conversely, a break above 4050 would require abandoning short positions and reassessing the market.

Gold prices are consolidating on November 7th, awaiting the non-Gold has completed its technical adjustment after a period of consolidation on the hourly chart. Short-term moving averages are starting to turn upwards, and the price is gradually rising above them, suggesting potential for further rebound in the short term. The key resistance level to watch is around 4020-30. On the 4-hour chart, short-term moving averages are largely flat and converging, indicating a potential breakout. The non-farm payroll data is unlikely to be released tonight. On the hourly chart, the price is gradually trending upwards along the short-term moving averages; monitor the short-term correction.
Trading Recommendation: Focus on the 4020-30 resistance zone and begin gradually establishing short positions.
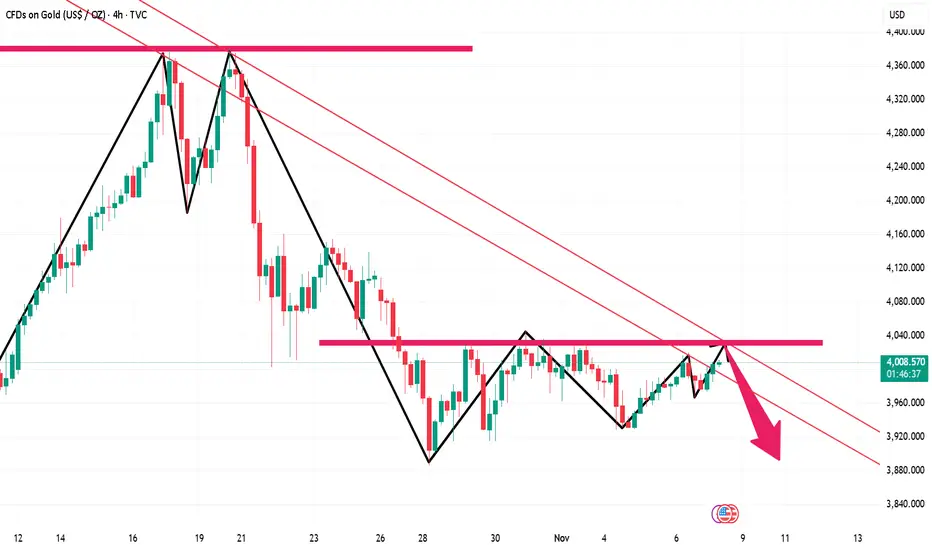
Gold prices fluctuated upwards on November 3rd, but bulls faced From the 4-hour chart, the current resistance level to watch is 4030-35, with a key resistance level at 4047-55. The short-term support level is 3965-70. The recommended strategy is to primarily sell on rallies, avoiding chasing the market and patiently waiting for key entry points. Specific trading strategies will be provided during trading hours; please pay close attention.
Gold Trading Strategy:
1. Sell gold on rallies to 4030-35, add to the short position on rallies to 4047-55, stop loss at 4069, target 3960-3965, hold if it breaks through.

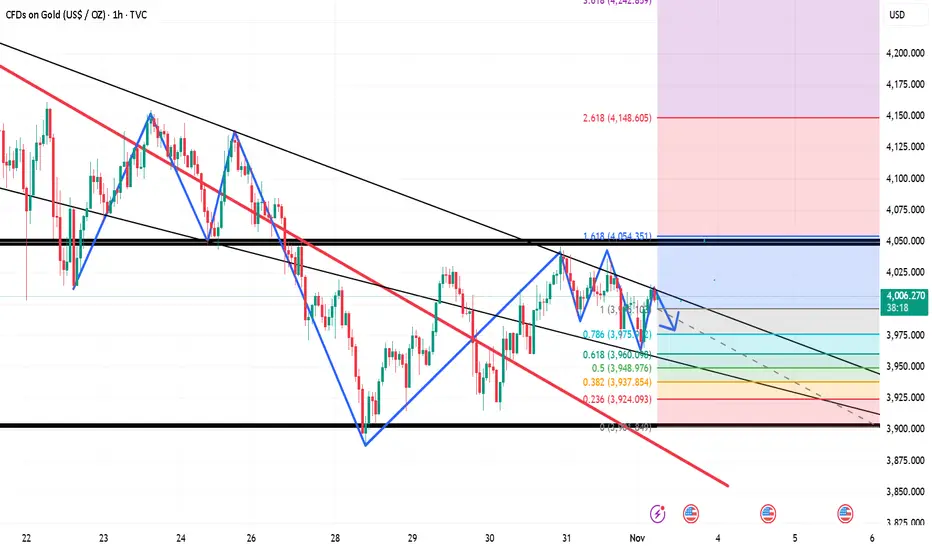
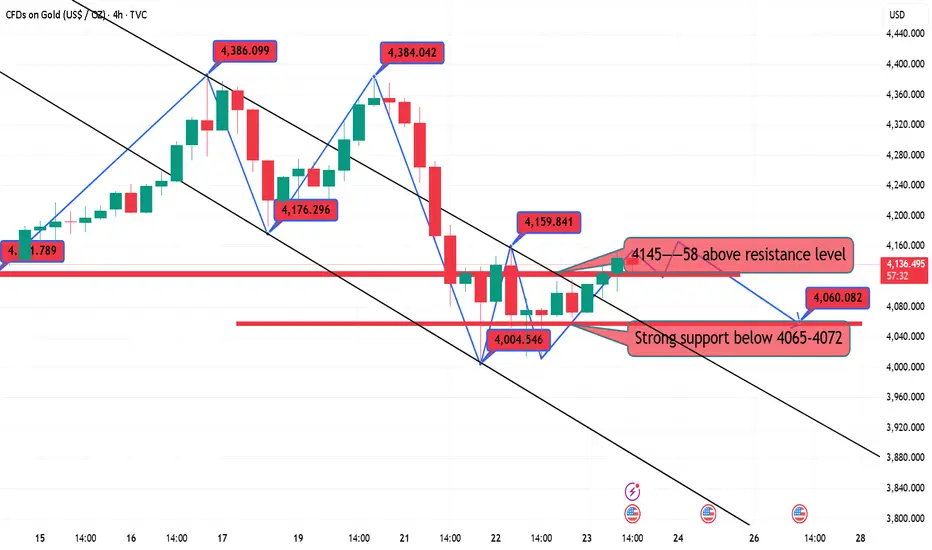
Gold Intraday Short-Term Analysis and Trading Strategies (NovembGold is currently oscillating between the 61.8% and 78.6% Fibonacci retracement levels (3945-4136), but trading volume remains weak. A further rise followed by a fall back to the 50% Fibonacci retracement level of 3811 cannot be ruled out. Stronger support lies nearby, at the 89-day moving average of 3753. This means the short-term correction is not yet over. Today, the key resistance level to watch is 4060-70, with a smaller resistance level at 4020.
Intraday Short-Term Trading Strategy:
Primarily sell on rallies, with buying on dips as a secondary strategy. Support levels to watch are 3979, 3936, and 3882.
October 31st Gold Intraday Short-Term Trading Guide!!!Gold prices retreated from around 4044-46 during the day, hitting a low of 3988 in the morning. Currently, it's oscillating within the 4000-4126 range. Today is the weekly and monthly close, potentially triggering a significant price movement. From a trend perspective, short-term gains remain limited. A further dip to 4000 is possible amidst the consolidation. A break below 3986/3960 could lead to a move towards 3920-3900. The recommended strategy is to sell on rallies, but be aware of the risks.
US Session Trading Strategy:
Sell near 40120-25, stop loss at 4035, target 4000-3990, continue to look for further downside if the price breaks through.
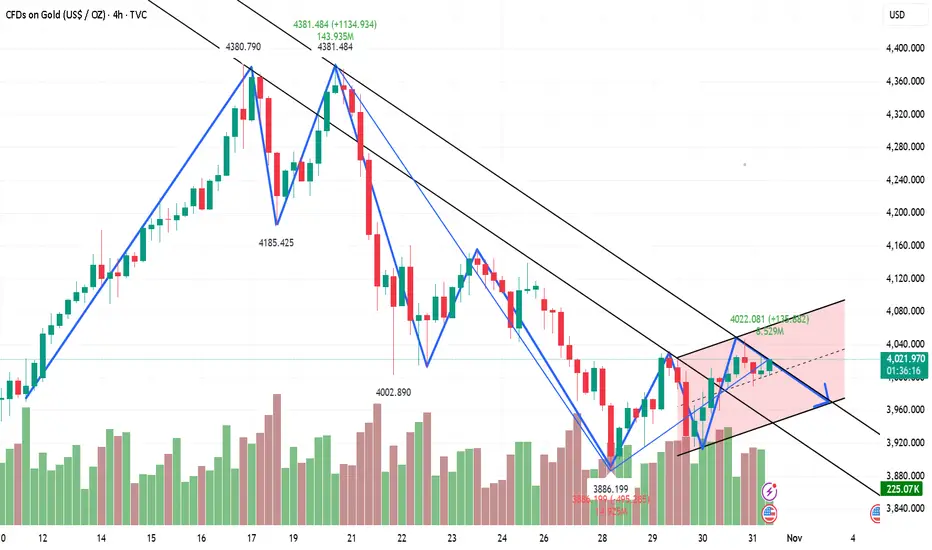
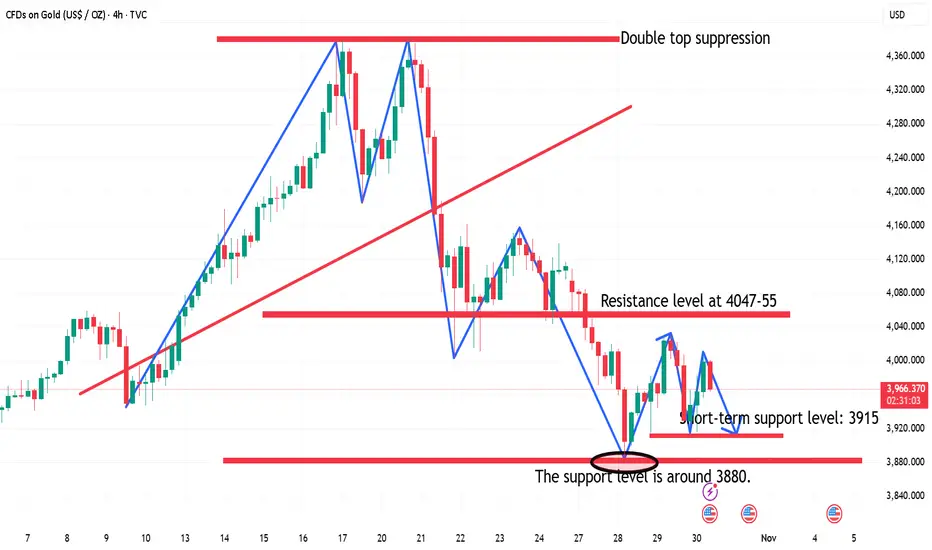
US session short-term trading strategy guidance at 10:30!From a 4-hour chart perspective, the current short-term resistance level to watch is 3978-85, with a key resistance level at 4047-55. Short-term support is at 3915-20. Trading should focus on range trading; avoid chasing the market and patiently wait for key entry points.
Gold Trading Strategy:
1. Sell gold at 3978-3985, stop loss at 4009, target 3880-3895, hold if it breaks through;
2. Buy gold at 3915-20, stop loss at 3896, target 3977-85, hold if it breaks through.
Gold finds support in the short term, target is 3950Gold has found support at 3886. A short-term rebound is expected around 3950-55. At this level, you can switch to short positions, with a focus on 3965. If it breaks through 3973 and breaks above the support level in the Asian session, abandon your short position and switch to a full long position. In the short term, we're looking for a rebound around 3950-55. Here, you can short, but be mindful of the risk.
October 28th Gold US Trading Strategy:
1. Buy around 3900-3910, stop loss at 3886, take profit at 3940-50.
2. Short around 3950, stop loss at 3965, take profit at 3910.

10.24 US market technical analysis!!!Gold hourly level: It stabilized and rebounded at 4105 overnight, and fell again in Asian session today, only rebounded from a double bottom at 4105 to 4144, and the price re-stood on the 66-day key moving average, because the Japanese and US sessions suppressed this moving average and fluctuated downward all the way; then after the positive line closed and broke through it, it was thought that if it held 4105, it could continue an upward trend. As a result, it consolidated for several hours and broke below 4100 in the afternoon, triggering a wave of decline, and hit the trend line of 4044 at the lowest, and got a certain rebound effect. After breaking through 4100, we will see the bullish trend, and the key support lies at 4150-4160.
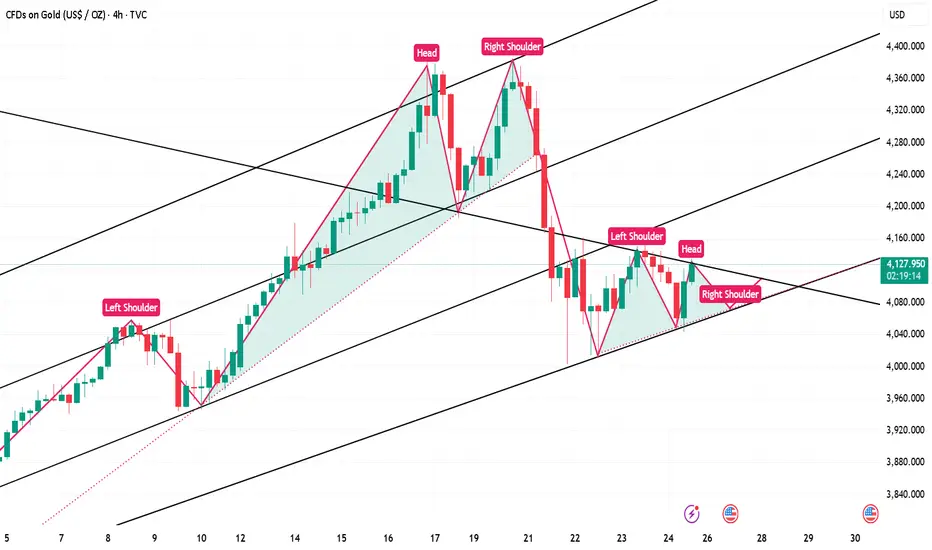
10.24 Gold US Trading Strategy, Bulls Bottom Out and Rebound as Looking at the 4-hour market trend, the current short-term resistance level at 4142-50 is being monitored on the upside, while the short-term support level at 4065-4070 is being monitored on the downside. Gold is under pressure and difficult to break through. For trading, the primary strategy is to go long on pullbacks. In the middle, be cautious and follow orders carefully, patiently waiting for key entry points. I will provide detailed trading strategies during the trading session, so please stay tuned.
Gold Trading Strategy:
1. If gold rebounds and doesn't break through the 4145-52 level, go short. Set a stop-loss at 4160, and target the 4015-4000 level. Hold if it breaks through!
2. If gold retraces to the 4085-93 level, go long. Set a stop-loss at 4073, and target the 4130-35 level. Hold if it breaks through!
Gold goes on a roller coaster ride. Continue to short below 4100Looking back at the price of gold since the beginning of the year, it has risen by over 50%, with an increase of over 25% in just two months. Those who bought in early on have made a killing, and at the first sign of trouble, they naturally want to sell to lock in profits. This concentrated sell-off can easily trigger panic. Leveraged margin calls exacerbate volatility: The recent surge has attracted many investors to leverage their positions. If prices fall rapidly, these leveraged positions will be forced to close, amplifying the decline like dominoes.
Returning to the one-hour gold chart, US gold will continue to fluctuate between 4100 and 4020. The current trend is volatile and weak, so adopt a high-sell strategy! Go short on a dip to 4080, with an eye on the 4000 area below!
Specific Strategy
Sell gold below 4100, stop loss at 4110, target 4000.

Barrick Gold Corp (B) – Riding the Gold SupercycleCompany Snapshot:
Barrick $B is a global gold and copper mining powerhouse, poised to thrive amid soaring gold prices and escalating macroeconomic uncertainty.
Key Catalysts:
Gold Bull Run Tailwind 📊
Spot gold is surging, with projections aiming for $2,700/oz. As a low-cost, large-scale producer, Barrick stands to gain significantly from margin expansion and free cash flow acceleration.
Global Diversification 🌍
Operations across North America, Africa, and Asia offer geographic balance—mitigating regional risk while ensuring strong production continuity.
Insider Confidence + Lean Costs 🔒
CEO Mark Bristow and other execs are actively buying shares, signaling deep conviction.
With industry-low all-in sustaining costs (AISC), Barrick boasts high operational leverage to gold’s upside, especially in an inflationary environment.
Investment Outlook:
Bullish Entry Zone: Above $18.00–$19.00
Upside Target: $28.00–$29.00, fueled by macro gold strength, disciplined execution, and insider alignment.
⛏️ Barrick is a prime gold cycle play, combining operational excellence with strategic global scale.
#BarrickGold #GoldStocks #GoldPrice #Commodities #InflationHedge #MiningStocks #InsiderBuying #AISC #PreciousMetals #MacroTailwinds #B

Jaguar Mining starting to ExplodeA brief pause in the gold run may be a good time to pick up some of these cheap miners I'm coming across. For those less risk tolerant (is that possible in the mining sector?), AEM , GDX, WPM and others are breaking to new highs. I see WPM at 75 within the next year or two and big moves from NEM from current levels. If you have nothing in gold/silver/miners sector, a 5% spec position in your portfolio will add to your 2025 gains!
