October 31st Gold Intraday Short-Term Trading Guide!!!Gold prices retreated from around 4044-46 during the day, hitting a low of 3988 in the morning. Currently, it's oscillating within the 4000-4126 range. Today is the weekly and monthly close, potentially triggering a significant price movement. From a trend perspective, short-term gains remain limited. A further dip to 4000 is possible amidst the consolidation. A break below 3986/3960 could lead to a move towards 3920-3900. The recommended strategy is to sell on rallies, but be aware of the risks.
US Session Trading Strategy:
Sell near 40120-25, stop loss at 4035, target 4000-3990, continue to look for further downside if the price breaks through.
Goldstrategy
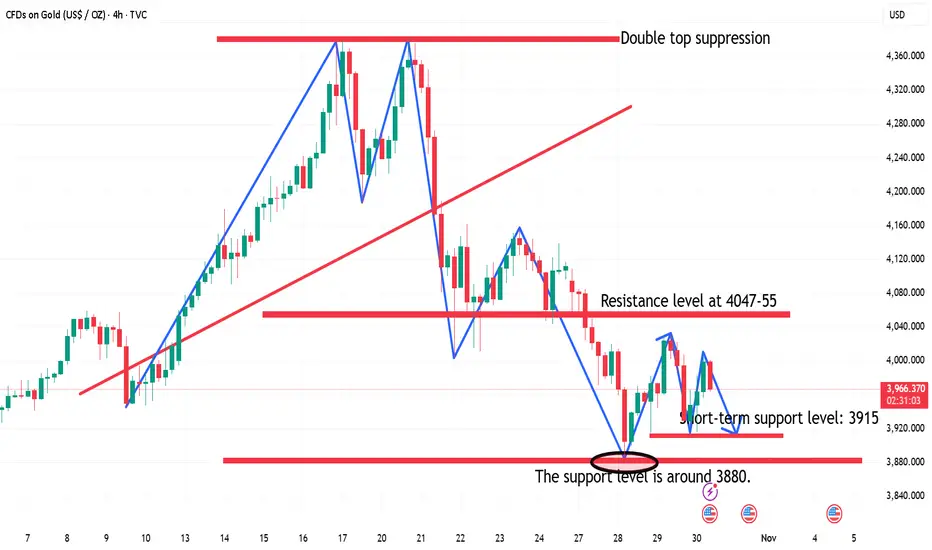
US session short-term trading strategy guidance at 10:30!From a 4-hour chart perspective, the current short-term resistance level to watch is 3978-85, with a key resistance level at 4047-55. Short-term support is at 3915-20. Trading should focus on range trading; avoid chasing the market and patiently wait for key entry points.
Gold Trading Strategy:
1. Sell gold at 3978-3985, stop loss at 4009, target 3880-3895, hold if it breaks through;
2. Buy gold at 3915-20, stop loss at 3896, target 3977-85, hold if it breaks through.
‘10.29 Buy first below 3900 and then sell!Technical Analysis:
The first resistance area above is 3960-70. Maintain a short position below this level. If the market unexpectedly breaks higher, focus on the 3995-4005 area, which remains bearish. If the market weakens, the 3945-50 area, previously the starting point for the rally, has become a source of pressure after breaking below it today.
Key support areas below are the 20-day moving average (SMA) at 3865-70 and the 50% level at 3840-45.
Trading strategy: Maintain a short position on rebounds.
Participate in the 3960-70 area, targeting a new low. After a new low, consider entering long positions based on the 20-day moving average and the 50% level.
Gold finds support in the short term, target is 3950Gold has found support at 3886. A short-term rebound is expected around 3950-55. At this level, you can switch to short positions, with a focus on 3965. If it breaks through 3973 and breaks above the support level in the Asian session, abandon your short position and switch to a full long position. In the short term, we're looking for a rebound around 3950-55. Here, you can short, but be mindful of the risk.
October 28th Gold US Trading Strategy:
1. Buy around 3900-3910, stop loss at 3886, take profit at 3940-50.
2. Short around 3950, stop loss at 3965, take profit at 3910.

THE KOG REPORTTHE KOG REPORT:
In last week’s KOG Report we said we would be looking at two levels as potential for the long trades and target for the short trades. We ideally wanted price to push upside and complete the long target before turning and then completing the short target. During the early part of the week, we activated short and gave caution on longs only to see the aggressive decline which hit our short target and completed our bias level and red box targets for the week.
All in all, a decent week in Camelot with Excalibur guiding and the EA hitting another full house of completed targets on Gold.
So, what can we expect in the week ahead?
We're pondering on this bearish move and it’s giving us hints of a swing low so for that reason we’ve given the red box bias level at 4095 which will need to break for us to see a continuation of the move. Above there, we have immediate support at 4104 which if held can give us another bounce in the early sessions giving us a move upside into the 4140-50 regions initially.
Above that level there is a level sticking out sitting at 4173 with the extension level 4192 which if targeted is the level to keep an eye on for us. A break above there and it’s likely we will attempt to swing high from a lot higher up which we will need to navigate level to level. But a RIP there would be ideal if it happens with a clean reversal.
On the flip, we do want to see lower pricing on gold as we feel it’s not only needed, but it will give buyers better opportunities to get in for better positioning to carry trades upside into the higher target levels we have active. As we approach the end of the month, it's going to be another whipsaw and we would hope to complete the move, or, we'll most likely see some sideways accumulation leading into the next week.
KOG’s bias for the week:
Bullish above 4095 with the ideal target 4274
Bearish below 4095 with the ideal target 4025
RED BOX TARGETS:
Break above 4115 for 4123, 4125 and 4140 in extension of the move
Break below 4095 for 4080, 4065 and 4050 in extension of the move
Please do support us by hitting the like button, leaving a comment, and giving us a follow. We’ve been doing this for a long time now providing traders with in-depth free analysis on Gold, so your likes and comments are very much appreciated.
As always, trade safe.
KOG

10.28 Gold continues to fall to 3970For the day, we will focus on the support at 3970. If it falls below, the price will continue to fall to 3950-3900-3850. In the short term, we will focus on the 4020 line and the resistance near 4060. After breaking through 4020, the price will continue to rebound and test the 4050-4060 line. However, the main strategy for the day is still to go short.
Strategy:
Go short near 4006-4010, defend 4021, and target 3970-3940-3900-3850
The second short position above is near 4054-4060, and the target position remains unchanged.
As for the long position below, it is at 3895 and 3870.

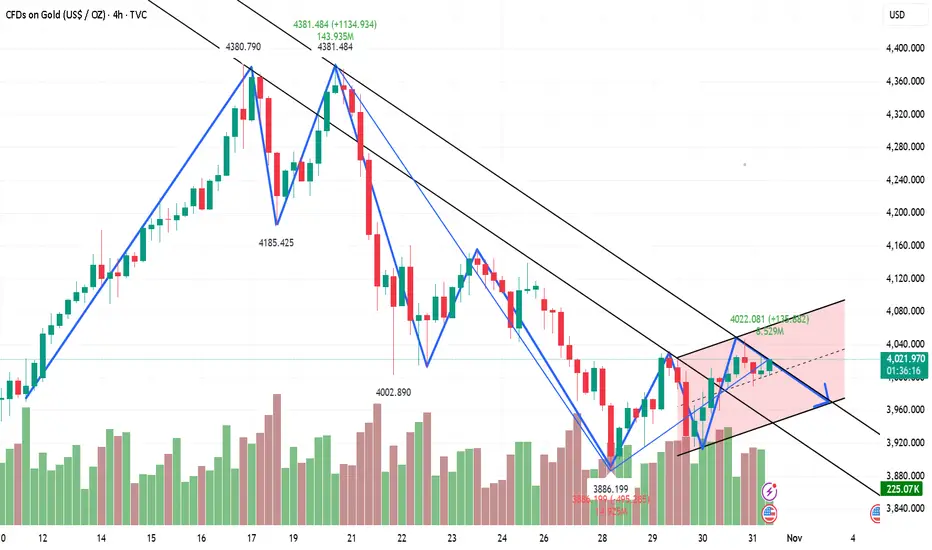
Gold shorts are coming, rebound under pressure and short sellGold hit resistance twice today and broke new lows again. Currently, the market is fluctuating at a low level, with resistance levels decreasing and the lows falling. The overall trend remains weak. Previous support at 4047-55 has become resistance. Focus on the downside: last week's lows of 4000-4004. The 4000 level will be the first barrier for bears to break through. Key resistance from above remains around the 4047-55 level we identified earlier.
Technical Analysis:
From the 4-hour market trend, short-term resistance at 4047-55 is currently under pressure. Gold is struggling to break through this resistance. Trading strategies should prioritize shorting on rebounds. In the intermediate range, be cautious and watchful, and wait patiently for key entry points.

How Smart Money Moves Gold (XAUUSD)🟡 Gold never moves randomly — it moves with intention.
Every spike, every fake breakout, every sharp reversal… it’s all part of a bigger plan by smart money (institutions) to trap emotional traders and collect liquidity.
Let’s break it down 👇
⚡ 1️⃣ Liquidity Grab (The Trap Phase)
Before any real move, gold sweeps stop-losses above highs or below lows.
Retail traders think it’s a breakout — but it’s actually a liquidity hunt.
Smart money fills large positions here while emotions run high.
⚡ 2️⃣ Market Structure Shift (The Clue)
After collecting liquidity, watch for a BOS (Break of Structure) or CHoCH (Change of Character) — these reveal when the real move is starting.
⚡ 3️⃣ Smart Money Entry (The Real Move)
Once the trap is set, gold often makes a strong impulsive push.
This is where institutions enter — and where smart traders follow with confirmation, not emotion.
⚡ 4️⃣ Emotional Traders Lose, Logical Traders Win
The market doesn’t hate you — it simply feeds on emotional reactions.
Be patient, wait for liquidity sweep ➜ structure shift ➜ confirmation entry.
🧭 Pro Tip:
👉 Stop chasing candles.
👉 Study liquidity and market structure.
👉 Let the chart show who’s trapped — and then trade against them.
💬 Remember:
“The market rewards patience, not panic.”
💎 Gold (XAUUSD) moves on liquidity — not luck.
#TradeSmart #ThinkLikeInstitutions #XAUUSD

10.19 Gold Monday short-term analysis guide!Gold closed near 4247 on Friday. Following five consecutive daily gains, the market closed with a bearish candlestick pattern. Technical analysis suggests that gold prices are poised for a period of volatile correction. Without news stimulus, gold is expected to fluctuate within a range. Given the pullback from Friday's large bearish candlestick, Monday's focus should be on whether the decline can be sustained. If this trend isn't sustained, bulls are poised to launch a counterattack. Otherwise, gold is poised to enter a range of rebound resistance.
From the 4-hour market trend, short-term resistance is currently at 4280-4293, with a focus on 4315-23. Support is at 4185-4193. If bulls fail to achieve a sustained breakout, a period of volatile correction is imminent. Trading strategies should prioritize range-bound trading. In the middle, adopt a cautious approach, cautiously follow orders, and patiently wait for key entry points.

XAUUSD is in buy area!Price level 4205.00 is a strong liquidity sweep showign up a momentum gain on GOLD to reverse from this long term support level gold has started to bounce off the level.
As daily and long term trend continue to be bullish price is highly likely to continue to remian upside with another momentum gain from this support level. A bullish trade is high probable from the long term support level.

Accurate sniping, gold is shorted all the way.Who else has continuously arranged short orders from above 4050 and gone down all the way. Before the market closed yesterday, we arranged in advance at 3990 and accurately set a limit short order. During the opening rebound, gold only touched 3994. After perfectly activating the limit short order, it quickly fell and hit the target near 3970 in one fell swoop, with a steady profit of 200pips on a single transaction. This wave of operations is not only a manifestation of technology, but also a perfect combination of rhythm and plan execution. It once again verifies our core concept of planned trading and strict risk control, precise analysis, advance layout, and steady cashing. Looking back at the entire market, since above 4050, we have clearly stated that there is a risk of periodic correction in gold, and have repeatedly suggested the idea of shorting on the rebound. Facts have proved that planning in advance and decisive execution are better than chasing ups and downs afterwards. The rhythm of this round of decline is clear, and the short-selling-dominated pattern is obvious. We decisively enter the market in the key interval. Every high-level short order is fast, accurate, and ruthless, and we win in a steady manner.
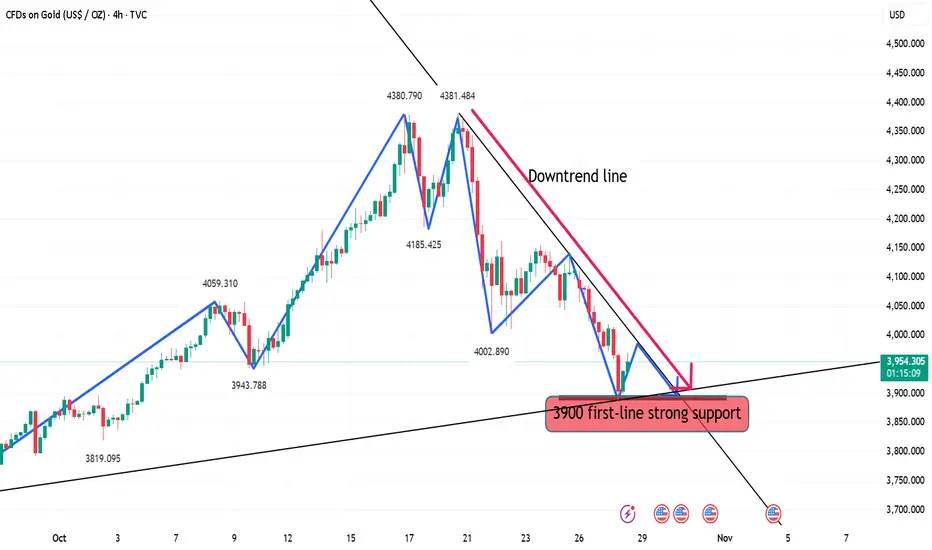
From a technical perspective, gold completed a structural breakdown at the 4000 mark. Short-term support is focused on the 3945-3940 area. If it continues to break down, it will open up downward space to the 3920 line. The upper pressure is focused on the 4000-4015 area. Rebound pressure is still the focus of shorting at rallies. The overall rhythm is still bearish, and short-term operations are mainly based on rebound shorting.
The market never waits for anyone. Profits belong to traders who have plans and execution capabilities. Congratulations to all my friends who are paying attention. Once again, I have steadily realized profits. Strength is not something that can be expressed with words, but is the result of precise implementation of each order. Next, I will continue to track the gold fluctuation structure and lead everyone to steadily grasp the next key market opportunity.

Gold short positions above 4050 have achieved another success!Today we have been emphasizing that gold may usher in a major adjustment. In the end, gold fell below the 4,000 mark. This position is exactly the important medium-term bullish and bearish turning point that we have been adhering to for a long time. Gold broke through and fell directly during the U.S. trading session. We participated in short orders throughout the process. Gold fell sharply as expected. At present, gold has fallen below the key mark. It is likely to be mainly adjusted in the short term. There is a lack of new positive news stimulation in the near future. The market may enter the bearish home court next. The gold 1-hour moving average has turned, indicating that the bullish momentum has weakened significantly and the rebound strength is limited. The trading ideas in the future are still clear. The rebound is under pressure in the 3985-4000 area, which are opportunities to short at highs. We never do stubborn longs or shorts. Once the long and short key positions are broken, the trend has turned. Only by following the trend can we be invincible.

Gold goes short first and then long, the rhythm is perfect!Gold has rebounded significantly after touching the key long position of the strategy near 4002 several times during the day, verifying the effectiveness of our previous layout ideas. The price rose rapidly after receiving strong support in the key support area, showing that the bulls still hold a dominant position. The short-term adjustment is more to accumulate momentum for an upward attack. Overall, the structure of a squat followed by a long jump is very obvious. From a technical perspective, the 4-hour cycle still maintains a bull-dominated pattern, the moving average system shows a good bullish arrangement, and the short-term price runs above the main moving average, indicating that the trend is still healthy. Although the MACD momentum column shows signs of contraction, it is still running above the zero axis as a whole, indicating that market momentum is still strong. In terms of operational thinking, we continue to maintain the bullish thinking. The key support is the 4000-3985 area. As long as this range is not effectively broken, short-term pullbacks are regarded as low-long opportunities. If the price effectively falls below the 3980 line, it means that the short-term bullish structure is destroyed and the market may enter a phased adjustment. The 4050-4060 area above is an important pressure zone. If the market encounters resistance and pressure again at this position, you can try to short gold with a light position in the short term. The target can first look at the 4020-4000 area. However, it should be noted that this short order is only a short-term gaming idea. Be sure to strictly control the position and take profit and stop loss, and do not blindly chase the short position. If the gold price can continue to break through and stabilize above 4060 in large volume, the upside space will be further opened, with the target pointing to the 4100 mark or even higher levels. Overall, the gold trend remains healthy, and a short-term pullback will not change the medium-term upward trend. The core of stable trading lies in rhythm and execution. Although the market is advancing in volatility, the direction remains clear. Be patient, strictly implement the plan, and wait for the market to give another opportunity for certainty. If there are structural changes in the subsequent market, I will update the strategy and synchronize it with you as soon as possible.
9.3 Gold awaits non-farm payrolls!!!Gold's daily candlestick chart continues to fluctuate slightly higher along its short-term moving average, with prices currently under pressure around 3900. Tonight's non-farm payroll data may not be released as expected, adding some uncertainty to the market. On an hourly chart, after a period of narrow range-bound trading, the technical pattern is gradually recovering. With prices slowly breaking through the previous resistance zone, there may be some short-term rebound potential. On a four-hour chart, the short-term moving averages are essentially flat, suggesting continued high-level fluctuations and repairs. Watch for short-term corrections.

Gold Adjusts After Hitting 3,895 USD Peak📊 Market Overview:
Gold reached a record high of 3,895 USD/ounce before correcting down to 3,866 USD/ounce. This adjustment occurred after a strong rally driven by safe-haven demand amid U.S. political uncertainty and expectations of a Fed rate cut.
📉 Technical Analysis:
• Nearest Resistance: 3,900 USD/ounce
• Farther Resistance: 3,950 USD/ounce → psychological level and previous strong selling zone; if surpassed, the uptrend may continue.
• Nearest Support: 3,850 USD/ounce
• Farther Support: 3,820 USD/ounce → key level in case of a strong pullback, likely to trigger significant buying.
• EMA: Price is above EMA 09 → bullish trend.
• Candlestick / Volume / Momentum: Bullish candlestick pattern with increasing volume indicates strong buying pressure, but watch price reaction near resistance 3,900–3,950.
📌 Market Outlook:
Gold may continue rising if buying pressure persists and the Fed cuts interest rates. However, if the price fails to hold 3,850, it could test the farther support at 3,820.
💡 Suggested Trading Strategy:
BUY XAU/USD : 3,850 - 3847
🎯 TP: 40/80/200 pips
❌ SL: 3,844 USD

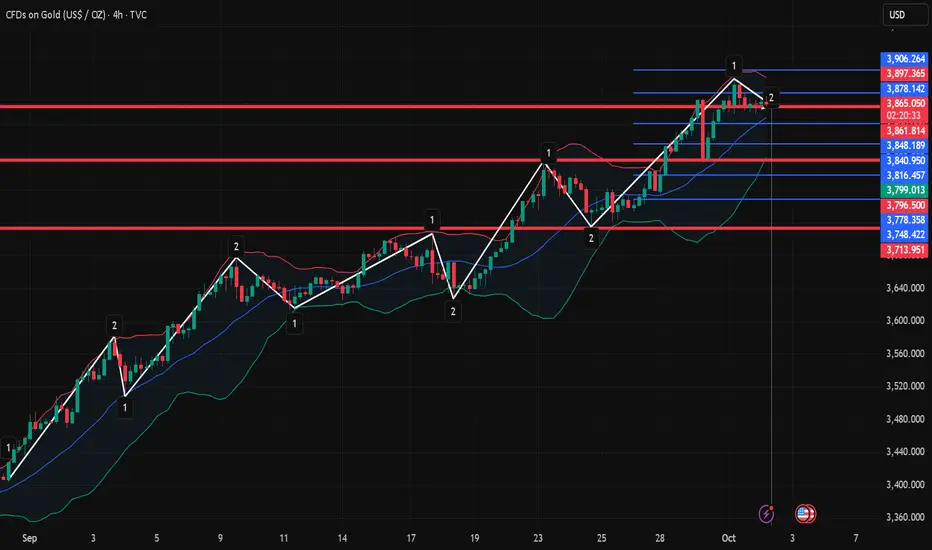
10.2 Gold fluctuates at a high level!!!Market Analysis:
① The daily MACD is forming a golden cross at a high level with high volume and volatility, and the STO indicator is overbought, indicating a high-priced trend. A candlestick chart with a hanging line after consecutive long-term bullish candlesticks indicates high-priced volatility, with the risk of a pullback. This is unless another long-term bullish candlestick pattern breaks yesterday's hanging line.
Therefore, today's upside focus is on yesterday's high of 3895. A break above this level could push the price towards the 4000 mark.
Current daily support lies near the MA5 and MA10 moving averages, corresponding to support levels of 3837 and 3787. However, the MA10 moving average has no chance of success, so the main focus for the day is support at 3837. This means the intraday range remains between 3837 and 3895.
② The 4-hour MACD is forming a high-level death cross, and the STO indicator's fast line is showing an upward curve, indicating a volatile trend in the 4-hour chart. Short-term support in the 4-hour chart lies near the middle line at 3844, but this is expected to gradually move up to around 3850 over time. We observe that the three Bollinger Bands on the 4-hour chart are currently narrowing, indicating range-bound fluctuations. The upper band is currently holding pressure at 3901, but it will likely move down to around 3890-95 over time.
③ On the hourly chart, the three Bollinger Bands are also narrowing, with the lower band and the MA60 moving average currently supporting the 3852-54 level. If the price falls below 3852, a downward trend is likely.
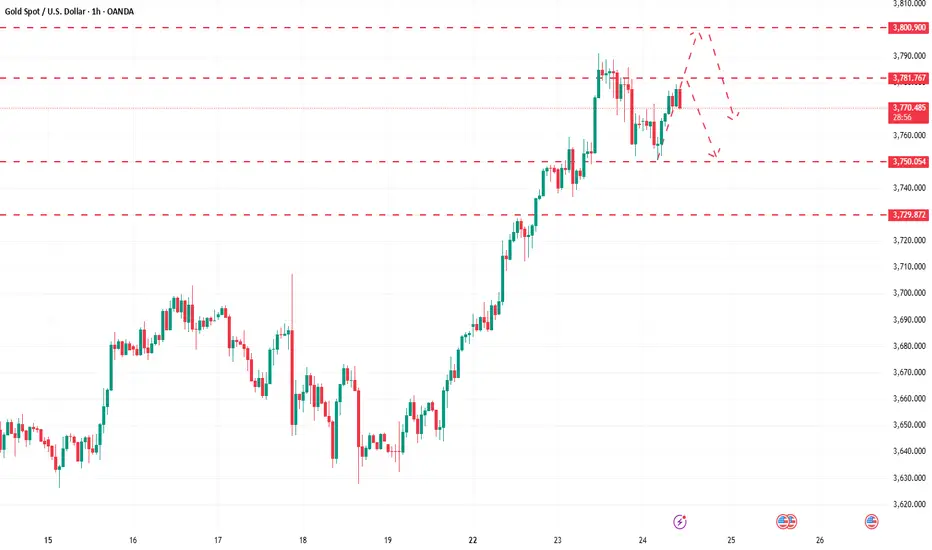
Gold Prices Plunge from Historic PeakGold Prices Plunge from Historic Peak
As shown by the XAU/USD chart, yesterday gold prices reached a new all-time high, surpassing the $3,870 level for the first time. This rise was supported by concerns over the high likelihood of a US government shutdown.
According to media reports:
→ Vice President J.D. Vance stated that the US is heading towards a government shutdown, blaming the Democrats.
→ “We have very large disagreements,” said Senate Minority Leader Chuck Schumer.
Fears over the potential impact of a shutdown boosted demand for safe-haven assets, including gold. However, today XAU/USD has dropped sharply. What might this mean?
Technical Analysis of the XAU/USD Chart
In our previous analysis of gold prices, we drew an ascending channel, which remains intact.
Within the context of this channel, it is worth noting that each time the price exceeds its upper boundary, this tends to trigger a correction, a consequence of the market being overbought (in most cases confirmed by the RSI indicator).
Yesterday, during heightened activity in the US trading session, gold prices moved significantly above the upper boundary of the channel, leaving the market vulnerable to a correction. For this reason, today’s decline during the European session can be explained by traders reassessing risks, as well as profit-taking after a rise of more than 11% since the start of the month.
Note the speed of the decline — it indicates strong conviction among the bears. Overall, yesterday’s rise combined with today’s sharp fall can be interpreted as a bearish engulfing pattern. This strengthens the case for a deeper correction towards the psychological $3,800 level, where the median of the channel lies (possible support levels are marked in purple).
Therefore, it is possible that bulls exhausted their momentum yesterday, and for an upward trend to resume, another consolidation period with the formation of a “bull flag” pattern may be required.
This article represents the opinion of the Companies operating under the FXOpen brand only. It is not to be construed as an offer, solicitation, or recommendation with respect to products and services provided by the Companies operating under the FXOpen brand, nor is it to be considered financial advice.

How to accurately grasp gold trading opportunities?The market keeps falling, but we have no worries about taking profits. 3720 is the key short-term support level. Once it is effectively broken, gold is expected to accelerate its downward trend. For two consecutive days, we publicly suggested to arrange short orders near 3780 and 3760. Now the market has fallen sharply to the 3725 line, and we have achieved steady profits again. For two consecutive days, we accurately arranged short orders at the intraday high and steadily realized profits.
At present, gold is no longer in a unilateral upward trend, and the technical side has entered a repair stage. The operation idea is mainly to follow the trend, and the focus is on grasping the rhythm of bulls and bears. The most frequently asked questions recently are whether a big drop has begun and whether gold has peaked. From a structural point of view, although the daily line has been under pressure continuously, it closed in the negative yesterday and even formed a tombstone K-line pattern on the previous trading day, indicating that the short-term has encountered obvious suppression, but this cannot directly determine that the major trend has peaked. The weekly line is still dominated by bulls, and the short-term repair market has not destroyed the overall upward trend.
In terms of operation strategy, we still insist on shorting on rebound and long on pullback as a supplement. The lower support of the 4-hour chart focuses on the 3715-3700 area, and the upper pressure focuses on the 3760-3770 range. It is not advisable to blindly chase orders at the middle oscillation position. It is recommended to watch more and do less, and wait patiently for the key points to be confirmed before entering the market to seize the high winning rate opportunities.

Gold's rise encountered resistance and launched adeep correctionGold maintains high-level fluctuations at the daily level, but the short-term trend shows weakness. The price on the 4-hour chart has fallen below the previous fluctuation range and is currently obviously constrained by the 3760-3770 pressure zone. The K-line continues to run below the short-term moving average. The overall structure shows a weak and volatile pattern. The recent rebound has approached the previous key pressure area. It is expected that the downward trend will most likely continue after the rebound repair is completed. Although a V-shaped reversal has formed in the smaller cycle, the price has stagnated near the pressure zone. The technical indicators show a top divergence signal, indicating that the short-term momentum is gradually weakening and there is a tendency to turn to adjustment again. The comprehensive technical aspect shows that gold faces downside risks in the short term. It is necessary to focus on the adjustment strength and the performance of the key support level below. The operation suggestion is to short on rallies. Focus on the rebound resistance of 3760-3770 on the top and the support of 3715-3700 on the bottom.

How to seize the certain opportunities in the gold market?Yesterday, gold continued its record-breaking rally, achieving its sixth consecutive week of gains and further entering an unknown price range. The core driving force behind this round of gains lies in the market's continued rise in dovish expectations for the Federal Reserve to further implement loose policies before the end of the year. Although the 25 basis point interest rate cut last week has been digested by the market, investors are increasingly expecting two more interest rate cuts in October and December, providing strong support for gold prices. In addition, ongoing geopolitical tensions, increased gold holdings by various countries and strong inflows of funds into gold ETFs have together constituted the multiple pillars of this bull market. Under the interweaving of risk aversion and loose expectations, gold has risen by more than 40% this year, highlighting its strong appeal.
From a technical perspective, the daily chart shows that gold prices closed with a large real body positive line, and the trend is extremely strong. The MACD indicator double lines sent a golden cross signal, confirming the short-term bullish trend. However, the indicator has deviated seriously into the overbought area, suggesting that there is a large risk of technical correction in the later period. Strategy analysis needs to focus on the support role of the MA5 moving average below. If it falls below, it may trigger a deeper adjustment. It is recommended to remain cautious in operation. You can consider light positions and try to arrange short orders on rallies. The upper resistance focuses on the 3780-3800 range, and the lower support is around 3745-3730. Although the current market trend is upward, we need to be vigilant against the risk of high-level corrections.
Gold breaks through strongly, seizing opportunities is the key!Gold continued its strong rally from last week yesterday, hitting new all-time highs, reaching a high near 3759, sending the market into a frenzy once again. Since its initial rise from 3311, the overall gain has reached nearly $450, a rare and impressive rise in recent years. However, amidst this upward trend, market sentiment is inevitably wary of rising prices.
From a technical perspective, bulls still have upward momentum, but a reversal could lead to a significant pullback. The previous pullback did not reach key support, so the correction remains limited. Short-term pressure is focused on the 3760 area, which is crucial for further gains in the European session. If the European session lacks momentum, the probability of new highs in the US session will decrease. Support below this level is around 3730, with the watershed still near 3700. A break below 3700 would signal the end of the bull market.
Therefore, for intraday trading, it is advisable to try to position yourself based on the initial top. While there are certain risks, the potential for blindly chasing long positions at this level is already limited. It is recommended that if gold touches around 3760-3765, you can consider placing short orders at the right time, and first look at the retracement space below.

Gold rebound encountered resistance, bears may exert force againGold continued its decline yesterday, extending the previous day's downward trend. It hit a low near 3633 before rebounding, peaking at 3672 before falling under pressure again. The US market quickly dipped to around 3627, another sign of bearishness. After breaking through the high, the upward move did not continue, but instead continued to rebound during the day, leaving room for short-term market volatility. Strong upward pressure currently persists around 3670, which also served as a barrier to yesterday's high. While prices have rebounded, the probability of reaching this level is low. A successful breakout could signal the end of the bearish correction. Yesterday, after initially reaching around 3660, the price quickly retreated. While the decline was limited, it provided a clear technical warning. Key support remains at 3620. If this fails, a direct drop below 3600, or even to around 3580, is possible. On the whole, the daily line is still biased towards a bearish retracement pattern. It is recommended to wait patiently for a pullback. If gold pulls back to the 3660-3670 area first, continue to arrange short orders on rallies, with the target first looking at the 3645-3630 area.

XAUUSD Analysis todayHello traders, this is a complete multiple timeframe analysis of this pair. We see could find significant trading opportunities as per analysis upon price action confirmation we may take this trade. Smash the like button if you find value in this analysis and drop a comment if you have any questions or let me know which pair to cover in my next analysis.
