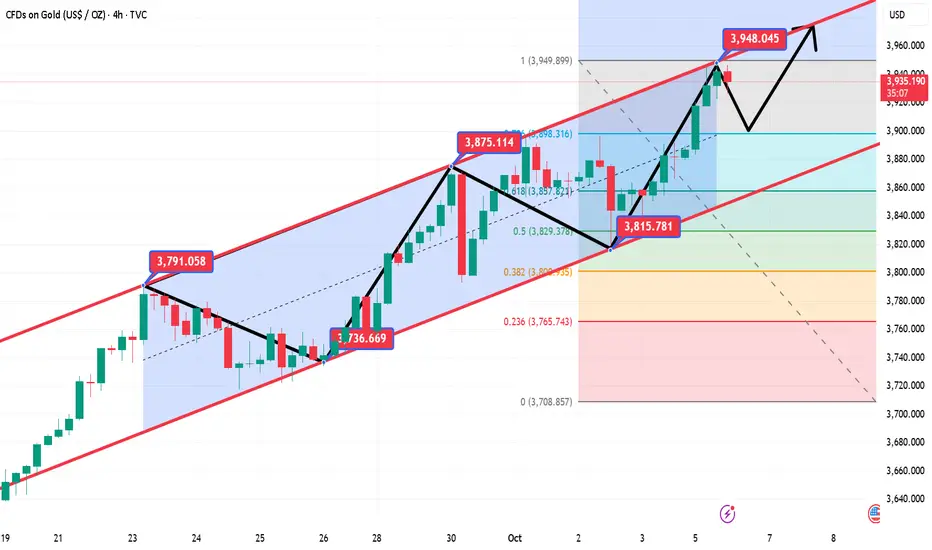
10.14Gold bulls continue to exert their strength!!!Gold is currently stabilizing after a broad range-bound consolidation on the 4-hour chart. It experienced an unexpected intraday plunge, but the momentum has been minimal. A rapid intraday rise followed by a sustained decline could present an opportunity for a short position. The price has rebounded after retracing to previous support levels, and the K-line charts are still trading above the short-term moving average, suggesting a relatively strong trend in the short term. There are currently no significant technical patterns on the hourly chart. On the smaller timeframes, pressure is building on the short-term moving average, maintaining a weak trend. There may be some room for correction in the short term. Focus on the support level around 4005 in the short term.
Goldtechnicalanalysis
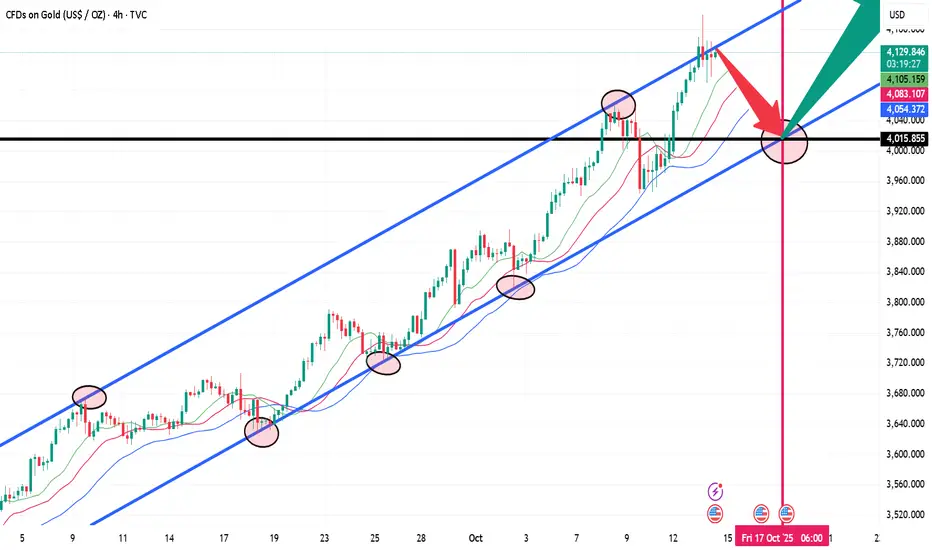
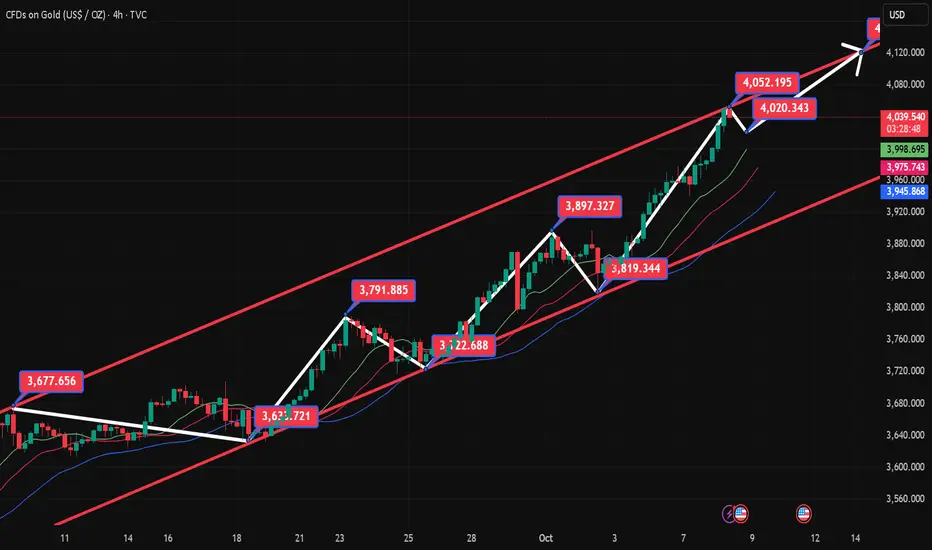
10.14 Tariffs and interest rate cut expectations resonate!Judging from the current 4-hour chart:
4100 is essentially the current hurdle for gold.
It's also the most important support level today.
Gold opened today in the 4100-4110 range. Although it recently retreated to around 4090, the real-world price still closed above 4110.
If we analyze the trend from last week's low of 3950 to the current 4180 level, we can see that the 618 support level is precisely around 4090.
4090 also happens to be the low point of the recent retracement.
According to wave theory, if the retracement does not exceed 618, new highs are inevitable. If it breaks through 4180 again, the next target may be around 4230.
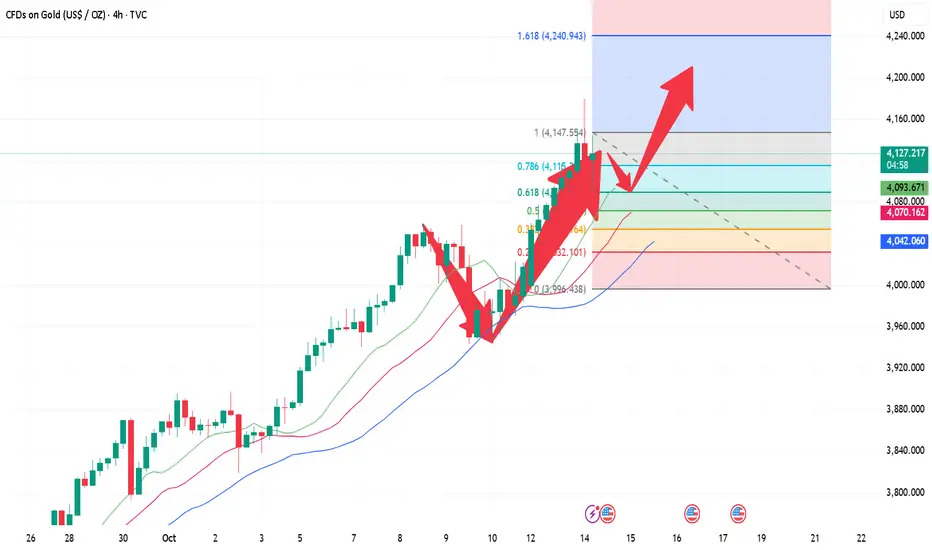
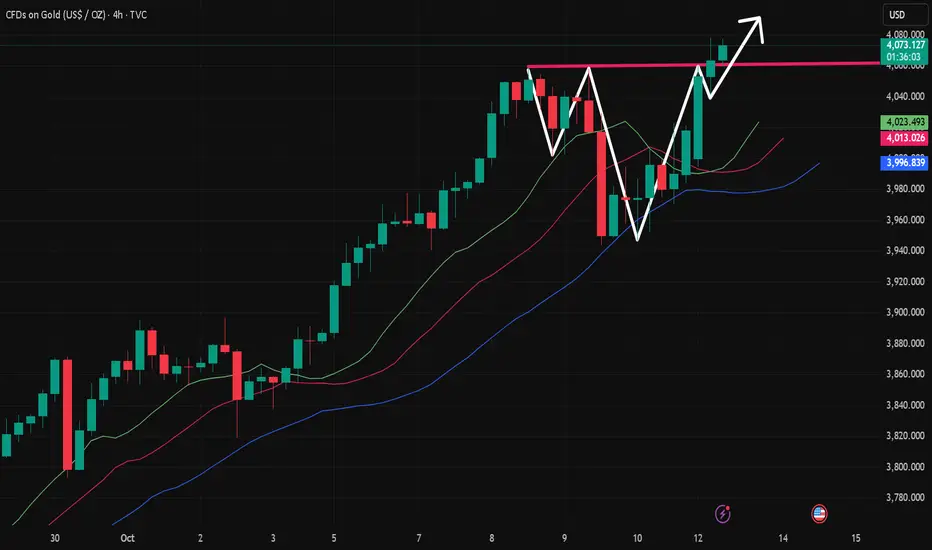
Gold breaks out to new all-time high!!!After breaking through the previous resistance band on the 4-hour chart, gold's candlestick chart continues to maintain a strong upward trend along the short-term moving average. There are still no signs of a peak in the short term, so focus on the support band around 4080. Currently, a purely technical correction in gold is unlikely to lead to a significant decline. The most likely scenario is a sudden sell-off or a rapid surge and then a decline to release bullish pressure, which may lead to some decent short-selling opportunities. On the hourly chart, the candlestick chart maintains a slight upward trend along the short-term moving average. Intraday pullbacks do not provide much room for improvement. Watch for short-term corrections in the closing market. Consider long positions around 3080-1.
Monday's US gold market focus on short-term adjustmentsOn Friday, we emphasized the importance of the daily close. Gold's late-day rally on Friday disrupted the previous downward trend following the engulfing high. Instead, it continues to fluctuate along its short-term moving average, maintaining a relatively strong trend on the daily chart. On the 4-hour chart, gold has broken through the previous resistance band, and the K-line continues to maintain a relatively stable upward trend along the short-term moving average. In the short term, watch for a second upward pull after a pullback. On the hourly chart, after a series of small upward movements, the price is currently fluctuating in a narrow range at a high level. The current divergence in the short-term chart suggests that there may be room for adjustment in the short term. Keep an eye on this short-term correction.

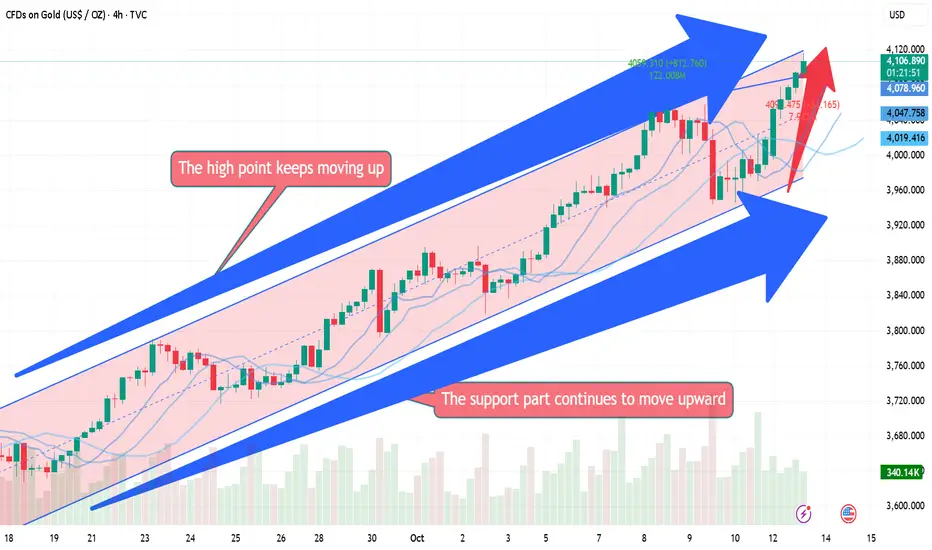
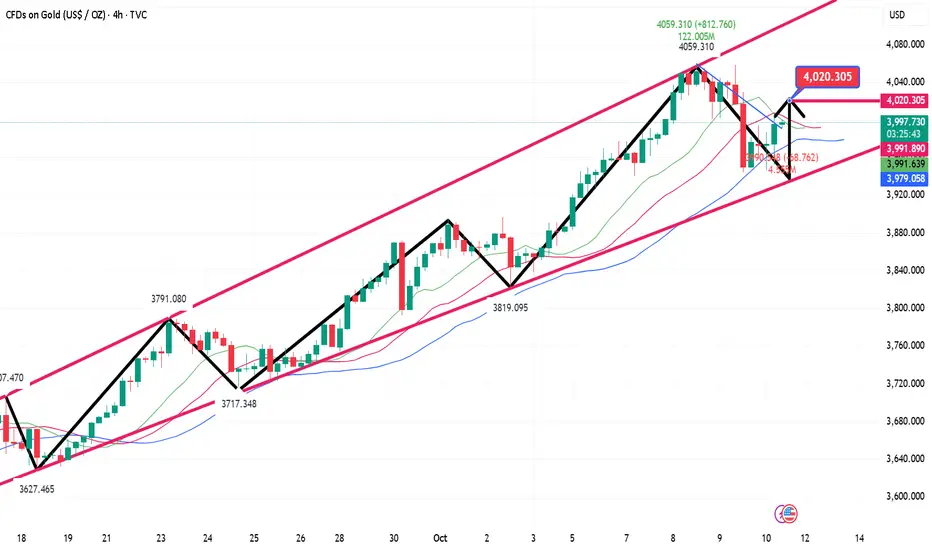
Monday's Gold Operation Analysis Guide!!!Gold has broken through its previous high, which is a standard continued upward trend and V-shaped reversal. The original horizontal pressure of 4060 has become a thing of the past. We can only focus on the expected decline opportunity of the trend line to buy!!!
Gold will continue to rise at the end of the week!!!Gold is currently consolidating at a high level on the daily chart, nearly forming an engulfing pattern at a high level, making today's daily close crucial. On the 4-hour chart, prices are currently fluctuating at a low level, finding support around 3950. On the hourly chart, after continuous fluctuations, the technical pattern is gradually adjusting. The short-term moving average is gradually diverging upward, and the K-line chart is slowly crossing the short-term moving average. The short-term trend is gradually strengthening, suggesting further upside potential. Keep an eye on the resistance zone around 4010.
Trade Recommendation: Buy around 3975-6, with a stop-loss at 3966.
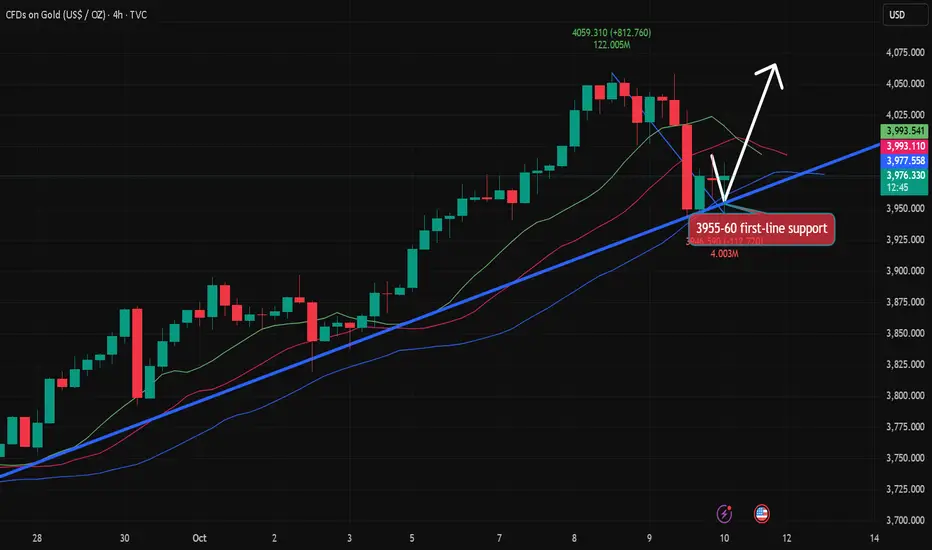
10.10 Gold pullback continues to be bullish!!!Looking at the 4-hour market trend, watch for the important support level at 3957-3960. The bulls are rising strongly and there's no end in sight. Trading strategies should prioritize buying on dips. In the middle, be cautious and watchful when buying.
Gold Trading Strategies:
1. Go long on gold at 3957-3960, with a stop loss at 3948 and a target of 4015-4020. Hold if it breaks through!
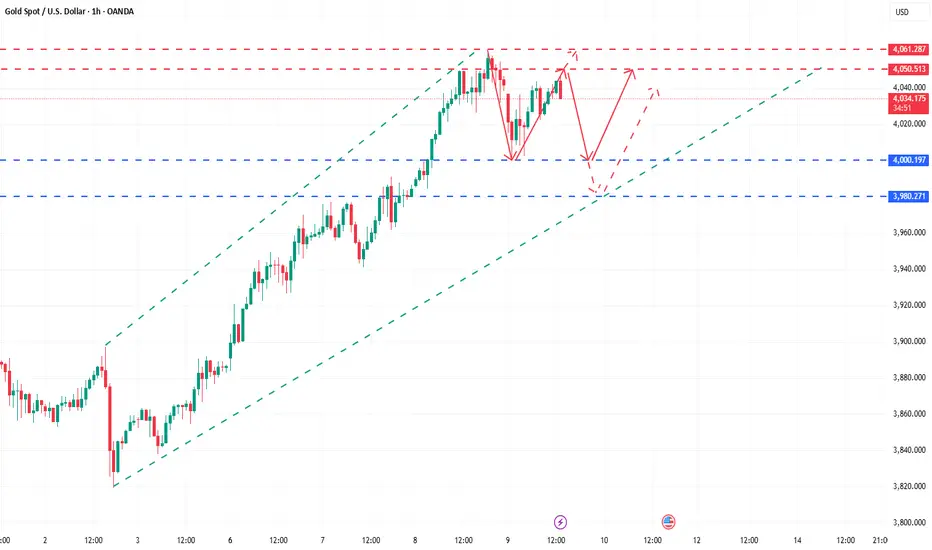
Gold’s Pullbacks Reveal Bearish Strength — 3960 in Sight!After gold retreated from around 4060, it encountered resistance and fell back frequently during the rebound. Although gold still maintained an overall bullish trend, the bullish momentum has obviously weakened, and the short-term gold market has entered a high-level fluctuation stage. Currently, the highest level of gold has reached around 4060. According to the current structure and rebound momentum, if gold cannot effectively break through the recent high of 4060, then gold is likely to form a secondary high point during the oscillation process and form an M-shaped double top structure with the recent high point.
Therefore, although gold is in an overall bullish trend, we still cannot ignore the considerable risk of a pullback in the short term before it effectively breaks through the high of 4060. At present, gold is testing the 4000 mark under the pressure of technical patterns. If the 4000 mark cannot withstand the test, gold may continue to retreat to the area around 3960.
Therefore, in short-term trading, we can still consider waiting for gold to rebound to the 4030-4040 area and try to short gold, first aiming at the retracement target area: 3990-3980; followed by 3960-3950!

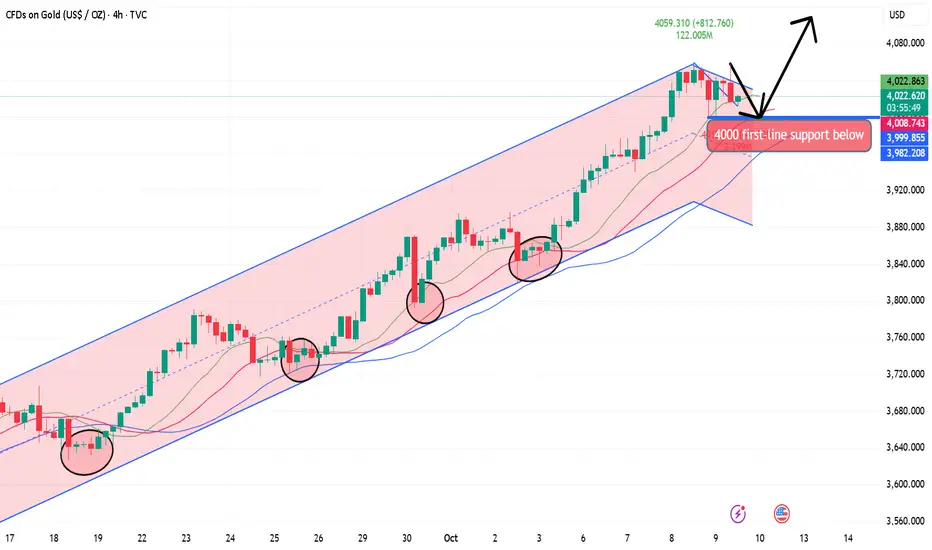
10.9 Gold US Market Operation Guide!!!Looking at the 4-hour market trend, watch for the important support level of 3990-4000 below, and the bull-bear watershed of 3980-85. The bull market is rising strongly and there is no end in sight. Trading strategies should focus on buying on pullbacks. In the middle, be cautious about following orders.
Gold Trading Strategies:
1. Buy gold at 4000-4010, and add to long positions if it retraces to 3985-3993. Set a stop loss at 3977 and target 4045-4050.
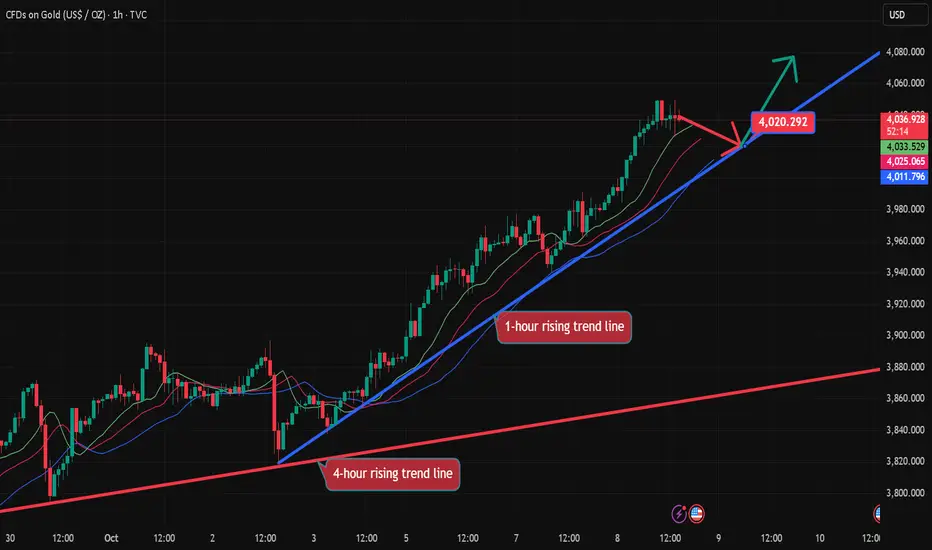
Gold goes short first and then long, the rhythm is perfect!Gold has rebounded significantly after touching the key long position of the strategy near 4002 several times during the day, verifying the effectiveness of our previous layout ideas. The price rose rapidly after receiving strong support in the key support area, showing that the bulls still hold a dominant position. The short-term adjustment is more to accumulate momentum for an upward attack. Overall, the structure of a squat followed by a long jump is very obvious. From a technical perspective, the 4-hour cycle still maintains a bull-dominated pattern, the moving average system shows a good bullish arrangement, and the short-term price runs above the main moving average, indicating that the trend is still healthy. Although the MACD momentum column shows signs of contraction, it is still running above the zero axis as a whole, indicating that market momentum is still strong. In terms of operational thinking, we continue to maintain the bullish thinking. The key support is the 4000-3985 area. As long as this range is not effectively broken, short-term pullbacks are regarded as low-long opportunities. If the price effectively falls below the 3980 line, it means that the short-term bullish structure is destroyed and the market may enter a phased adjustment. The 4050-4060 area above is an important pressure zone. If the market encounters resistance and pressure again at this position, you can try to short gold with a light position in the short term. The target can first look at the 4020-4000 area. However, it should be noted that this short order is only a short-term gaming idea. Be sure to strictly control the position and take profit and stop loss, and do not blindly chase the short position. If the gold price can continue to break through and stabilize above 4060 in large volume, the upside space will be further opened, with the target pointing to the 4100 mark or even higher levels. Overall, the gold trend remains healthy, and a short-term pullback will not change the medium-term upward trend. The core of stable trading lies in rhythm and execution. Although the market is advancing in volatility, the direction remains clear. Be patient, strictly implement the plan, and wait for the market to give another opportunity for certainty. If there are structural changes in the subsequent market, I will update the strategy and synchronize it with you as soon as possible.
10.9 Gold Short-term Intraday Operation Guide!!!Technical Analysis:
The 4-hour chart shows support at the middle line and near the MA30 moving average, corresponding to 3986 and 3947, respectively. The Bollinger Bands have also begun to narrow, indicating a volatile, compressed, and retest pattern in the 4-hour chart. Focus is currently on the upward pressure of 4032, near the MA5 moving average.
The 3-hour chart saw a rapid drop to 4001 this morning before bottoming out near 4008 and rebounding to 4036. The MACD formed a dead cross with high volume, and the STO indicator is trading at a low level, indicating weak 4-hour volatility. The high point of the morning rebound, the middle line of the hourly chart, has become the current resistance point at 4036. Meanwhile, support between 3999 and 4000 is a key focus today.
On the daily chart, focus on yesterday's highs and lows, 4059, and 3984. For the daily chart to rise, it must not fall below yesterday's lows but must break above yesterday's highs. However, considering the current volatile decline in the 4-hour chart, it is obvious that it will be difficult to go up in the morning session, so 4032 and 4050-59 become today's shorting points; and for the time being, we will focus on the morning low of 4001 and yesterday's low of 3984.
The US market fluctuates at a high level, and long orders fall bGold prices continued to fluctuate at high levels in the early stages of the U.S. trading session on Wednesday (October 8), with the potential for further gains. At the same time, the current price increase has already reached a large extent. Pursuing long positions at the current price is not the best opportunity. Waiting for a pullback to trade long positions at support points, with small stop-loss orders and a large expected profit range, spot gold broke through the $4,000 mark during the day, reaching a record high of $4,049.43 before retreating slightly. The current rise in gold prices is driven by strong safe-haven demand, driven by factors including the U.S. government shutdown, falling Treasury yields, and political turmoil in Europe and Japan.
Golden opportunity has arrivedGold has continued its strong upward momentum since breaking through the 4000 mark, reaching a high of around 4049. The market has hardly made any decent corrections, market sentiment has continued to be high, and bullish confidence has been infinitely magnified. However, the more emotional the stage is, the more we need to remain calm and rational. Structurally, gold has entered the end of an accelerated upward trend, and short-term indicators are obviously overbought. Although prices have hit new highs, momentum has not increased simultaneously, and there are signs of slight divergence, indicating that the upper space is gradually narrowing. Combined with the 4-hour structure, the 4050-4060 area is a period of strong pressure, and it may face a technical correction in the short term. In terms of operational thinking, you can consider shorting with a light position in the 4050-4060 area, and first target the 4020-4000 area. Conservative people can wait for the confirmation of the pullback before participating, and do not blindly chase the long position. Although gold is strong at present, it is not a mindless rise stage. The larger the bullish space, the deeper the adjustment will often be. At this time, risk control should be the core and planning should be the basis. Short-term short positions should only participate in structural corrections, and should not make impulsive trades that blindly fight against the trend. Steady execution, position control, and maintaining rhythm are the key to remaining invincible in extreme markets.If your recent operations are not ideal, or you are confused about how to grasp the rhythm, you are welcome to communicate with me at any time. I hope I can help you avoid detours and steadily improve your trading thinking and execution.

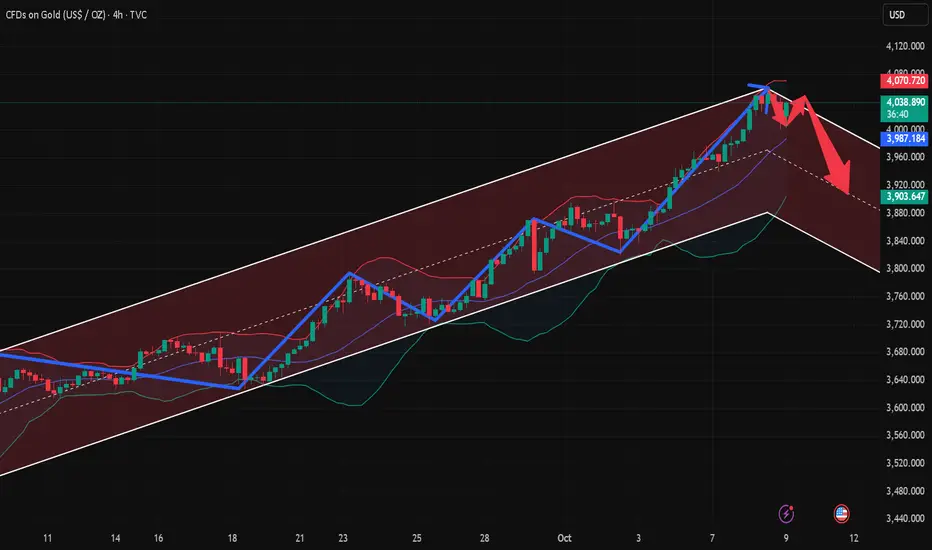
Gold’s Swings Offer Bears a Profitable EdgeGold has currently reached a high of around 4050, but after reaching this area, the upward trend has been suppressed, and the upward momentum has weakened. Gold needs to retreat in the short term. Gold is currently under pressure in the 4050-4060 area. If gold shows obvious signs of stagflation in this area, then gold may usher in a good pullback at any time.
However, because gold is currently in a strong upward trend, its structure and form are in an obvious bullish trend. Therefore, even if the gold market pulls back, the pullback is not expected to be too large in the short term. We should first focus on the support area below, 4000-3990.
Therefore, in volatile markets, even if gold is in a strong bullish trend, gold shorts still have good profit opportunities due to volatility. So in the short term, we can consider trying to short gold in the 4050-4060 area, first aiming at the target area: 4010-4000 area.
If you're short gold like me, we must be among the first to reap the benefits of a market correction. If you'd like to continue following my trading strategies and signals, be sure to follow me!

10.8 Gold Daily Short-Term Operation Guide!!!In the 1-hour chart, the Asian session continues to rise with $3985 as support. A quick pullback would be an opportunity to buy in. Unless the Asian session decline continues in the European session and then in the US session, or if the Asian session breaks the bottom in the European session and fails to continue in the US session, don't try to bet on a pullback; instead, follow the trend.
Secondly, give up on speculating on the top. Currently, the strong upward trend remains unchanged on both the daily and 4-hour charts. Even after breaking through $4000 in the short term, there's still no sign of an end. While bullish, be wary of pullbacks. In other words, be prepared for a pullback and avoid chasing orders.
If the pullback approaches the $4000-3980 range, buy long. If the European session's strength doesn't offer opportunities, and there are further pullbacks before the US market opens, keep an eye on $4030-4050.
10.7 The bullish trend of gold remains unchanged! Follow the treCurrent Market:
1: Technical Analysis - The bullish trend remains unchanged, so follow the trend. Trading Methods - Follow sideways trading and pullbacks! Avoid headwinds and avoid heavily shorting! Focus on following the trend!
2: Fundamentals - The probability of an October Fed rate cut continues to increase! The Russo-Ukrainian war remains stalemated! The outlook for the Middle East remains uncertain! Global central banks continue to increase their gold holdings! The overall fundamental environment is bullish for gold.
To sum up: From both a technical and fundamental perspective, gold is primarily bullish!
US Trading Timeframe:
1: 1-hour trading, sideways resistance at high levels, with support near 3940; the Stochastic and MACD lines are temporarily blunting!
2: 4-hour trading, the Stochastic has formed a death cross, and the MACD lines are blunting! From a morphological perspective, the short-term top-bottom reversal support level is around 3940.
3: In the daily K-line, the stochastic indicator blunted and retraced to a golden cross, signaling a bullish trend. The MACD double lines continued to cross upward, indicating a bullish trend.

Gold is rising as expected, with the US market eyeing 4000!!!After gold retreated to around 3940, it began to rally. The strategy for the future remains to buy on dips. Short-term long positions near 3942 can be reduced, with a target of 3980 still in sight. Be mindful of the risks. Short-term investors can consider buying around 3954, with a stop-loss at 3946, and targeting a range between 3980 and 4000. Be mindful of the risks.
October 7th US Gold Trading: For those holding positions near 3942, reduce positions and hold with a profit and loss at 3946. Target resistance near 3980, and a breakout to 4000.
Short-term investors can consider buying further near 3954, with a stop-loss at 3946 and a profit target of 3980-4000. Be mindful of the risks.
10.7 Gold Intraday Short-Term Operation Guide!!!Gold typically enters a correction phase on Tuesday after a strong rally on Monday. Maintain a bullish outlook for the day, with the primary support area being the 3955-60 range (which encompasses the early morning low, opening price, and high trading volume). Bulls are expected to mount a counterattack here. Today's market will not simply replicate Monday's unilateral surge, but will likely exhibit a pattern of "high-level fluctuations, false breakouts, and subsequent declines, followed by a test of the bottom and subsequent upward movement." Trading strategies should be abandoned in favor of buying at the bottom of the market fluctuations.
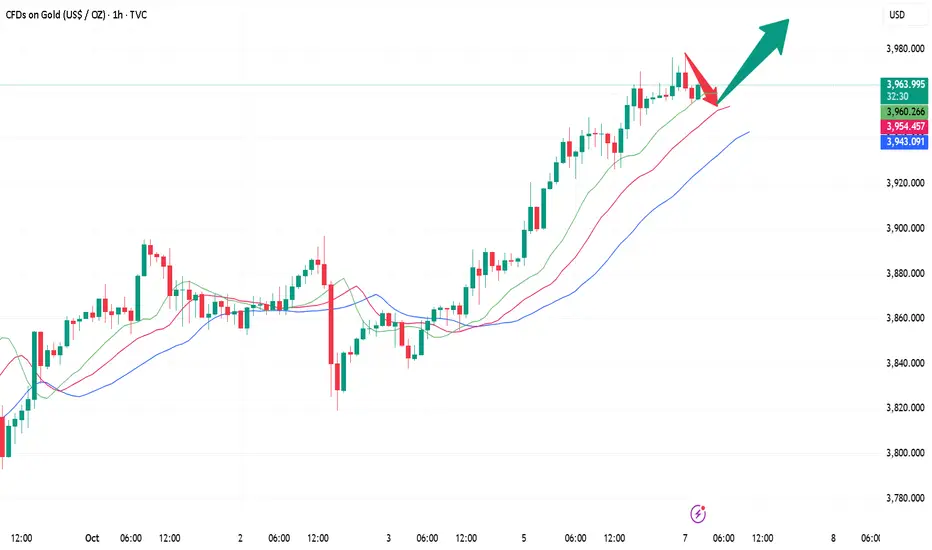
Ride Both Sides:Short Now, Long Later!Gold continues to rise and hit new highs, and the current high has reached around 3977. There is no doubt that the current gold market maintains a strong bullish trend. From the perspective of market sentiment, the only high point worth paying attention to in the short term is the 4,000 mark. There are currently no other high points that can be used as an effective reference. However, given the extreme highs, caution is advised regarding the current rally, and be wary of signs of profit-taking at market highs.
Two key support areas of note are currently located between 3930 and 3920, and between 3905 and 3895.If gold cannot effectively fall below these two key support areas, gold will continue to maintain a strong bullish trend and may hit 4000 in a short period of time; once gold falls below the above two key support areas during the retracement process, gold may continue to repair the retracement trend to the 3880-3860 area.
Therefore, in terms of short-term trading, because gold will fall back every time it hits a new high, remember not to go long on gold directly at a high level. You should grasp the rhythm of gold fluctuations. You can consider shorting gold in the 3965-3975 area, and then wait for gold to retreat to the area around 3930-3920 before considering going long on gold appropriately.

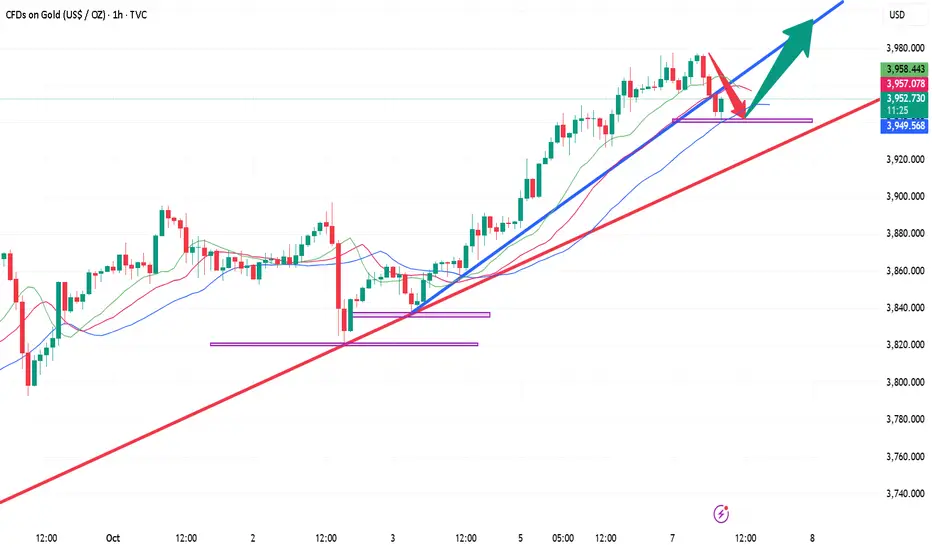
10.7 Gold has no ceiling!!!The one-hour pattern of gold, the golden cross of the moving average continues to radiate upward, maintaining strong bullish momentum. Pay attention to the short-term support below 3930-3920, which was the springboard for gold to accelerate yesterday. The upper resistance level should focus on the 3980 line. Every time the gold price reaches a new high, it will fall back to accumulate power. Just remember not to chase highs. For intraday operations, we can continue to maintain low-long participation!
Smart Money Strategy: Short Now, Go Long LaterAs I expected, gold touched around 3950 during the rise. According to the current structure, gold is currently in a very strong bullish trend, the market has a strong bullish consensus, and gold still has room to continue to rise. If gold can break through 3950 during the rise, it may open up space to higher levels.
However, it should be emphasized that when market sentiment is high and gold prices continue to rise, volatility may increase significantly and the risk of chasing the rise will increase significantly. From the current perspective, the short-term upward trend has been suppressed, and there is obvious pressure near the 3950 level, so gold may show signs of pullback in the short term.
To be honest, although gold prices have risen sharply, there have not been many opportunities to enter the market and go long on gold during the rise. So I have already shorted gold in the 3930-3950 area according to the previous trading strategy. First aim for the retracement target: 3920-3910 area.

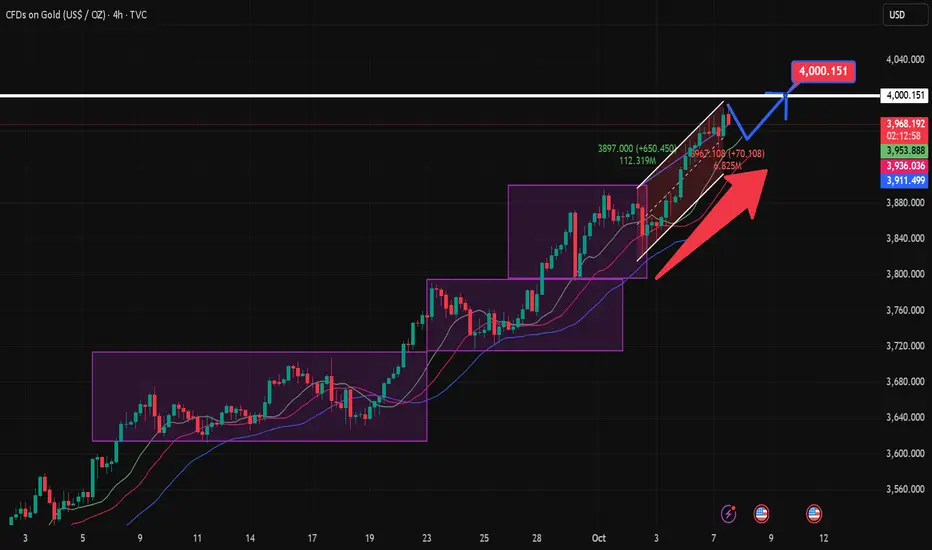
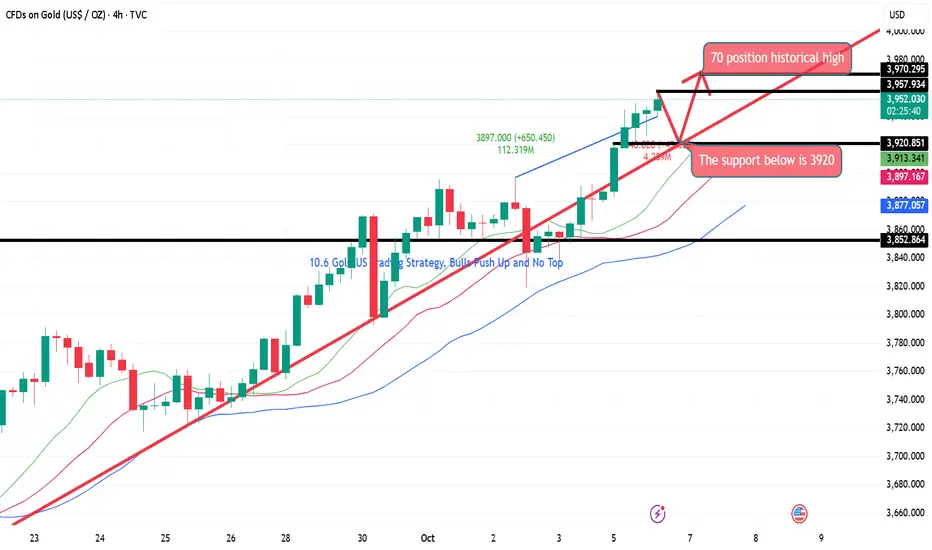
10.6 Gold US Trading Strategy, Bulls Push Up and No TopLooking at the 4-hour market trend, we are watching for short-term support at 3920, with a focus on the 3895-3900 support level. The bulls are rising strongly and there is no end in sight. Trading strategies should focus on buying on pullbacks. For intermediate positions, we should be cautious in chasing orders and patiently wait for key entry points. I will provide detailed trading strategies during the trading session, so please pay attention.
10.6 Gold's callback is small and it may continue to riseAfter breaking through a previous resistance zone on the 4-hour chart, gold is continuing its upward trend along its short-term moving average. Intraday pullbacks have been mild and sustained, and there are still no signs of a peak in the short term. On the hourly chart, after a surge, gold is maintaining a high-level correction, but recent high-level corrections have ultimately evolved into secondary gains, and today's pullbacks were not significant. On the short-term chart, the candlestick chart is gradually coming under pressure, maintaining a weak trend along the short-term moving average. Some short-term correction is possible. If the correction in the US market is not significant, it may even rebound to the current price after a minor correction. Further upward movement is expected after the open!!!