Gold, risks are looming!The current gold market is booming, surging forward with overwhelming momentum. After opening with a gap on Monday, it quickly filled the gap, touching a low of around 4989 before resuming its upward trend. Last night, it rapidly broke through the resistance level of 5110 and surpassed the 5200 mark, currently reaching a high of 5247. The price movement in the short term is dazzling. The current rise is mainly due to renewed geopolitical risks, coupled with growing market expectations of a Fed rate cut, leading to a reckless surge by the bulls. From a technical perspective, gold is at a dangerously high level, with major indicators showing signs of severe overbought conditions. There is upward pressure for a pullback, but the ultimate destination remains uncertain. Market movements often end in a frenzy, and yesterday's and the initial surge after the opening may be the last gasp from the bulls. I personally predict that gold may show signs of topping out today. Coupled with the interest rate decision, the current rapid rise may be a premature release of bullish energy. At this point, support and resistance levels are not important; it's more about psychological factors. Given this unclear pattern, we can only try small, high-risk strategies and avoid wishful thinking. Light, tentative trades are the best approach. Intraday, we can consider shorting around 5245-5260, carefully managing our position size.
Goldtrader

After gold broke through $5,000, risks and opportunities coexistGold touched a low of around 4990 yesterday, in line with analysis expectations. After the pullback, it successfully stabilized and rebounded, and the overall structure remains in an uptrend. Today's trading strategy continues to focus on buying on pullbacks, avoiding chasing highs and following the crowd. Currently, bullish sentiment in the market is clearly heating up, but it is necessary to be wary that after gold broke through the 5000 mark, its overall performance is somewhat weak, and the high-level market carries hidden risks, significantly increasing the difficulty of trading. The key resistance level to watch is the 5090-5100 range, where a short-term pullback is possible. On the downside, the key support level to watch is the 5010-4990 range. As long as this area is not broken, the overall strategy remains to buy on dips. Yesterday, we clearly advised patiently waiting for a pullback confirmation in the 5010-4990 range. Today's strategy continues this logic. We will continue to focus on the support level of 5010-4990. When the price approaches this level, we can consider placing long orders in batches. It is particularly important to note that if 4990 is broken effectively, we should be wary of gold further testing the cycle trend line near 4900. Once this level is broken, a short-term shift in the bullish/bearish structure may occur, entering a new adjustment cycle. The current market is filled with voices advocating for buying, but in reality, risks and opportunities coexist. When viewing market trends rationally, timing is always more important than direction. If you're interested in gold but don't know where to start, or if your recent trading hasn't been going well, feel free to come and discuss it with us.

How to position for both long and short positions?Gold Price Analysis for Next Monday: Looking ahead, the factors supporting gold's upward trend remain intact. Central banks are still increasing their gold reserves, and safe-haven demand hasn't subsided. However, it's important to note that gold is currently at historically high levels and a short-term pullback is possible. For example, it fell by about $110 on January 22nd. Therefore, avoid chasing the price higher.
Gold Technical Analysis: Gold encountered resistance around 4967 this afternoon, reaching a low of around 4900 during the European session before stabilizing and rebounding. During the US session, gold prices continued their strong upward trend. Looking at the daily chart, gold is showing a series of large bullish candles, with indicators in a bullish alignment and providing support below the price. The outlook remains bullish, but indicators have shown oversold signs, so caution is advised. Gold has rebounded after its recent decline, indicating strong bullish momentum. Technically, the 4-hour MACD shows a golden cross, and the price is trading above the Bollinger Middle Band. A buy-on-dips strategy is recommended for gold. The support level has reached 4888, and the gold price can maintain an upward trend as long as it stays above this level. The hourly support level has also been raised to 4900. In addition, everyone should be wary of the 5000 level, which is a historically significant psychological barrier and may experience a sharp drop. We are not speculating, but just being aware that if a drop occurs, do not go long again and do not be overly bullish! Beware of profit-taking! In summary, the recommended trading strategy for gold is to primarily sell on rallies and secondarily buy on dips. The key resistance level to watch in the short term is around 4900-5000, while the key support level is around 4900-4880. Please keep up with the market's pace.

Gold continues to hit new all-time highswhere is the next targetGold prices rose to around 5111 today before encountering resistance and pulling back. Currently, the overall market is still in a correction and consolidation phase. It's not recommended to blindly chase the price higher at this level. A short-term pullback is a normal adjustment, and the technical indicators still need some room to correct the structure. The key support level to watch in the short term is the 5065-5050 range. The trading strategy remains bullish, focusing on buying on pullbacks and patiently waiting for entry opportunities after the correction. It's important to note that a pullback does not equate to a market reversal; it's more of a change in the pace of the uptrend. Maintain a consistent trading strategy, avoid emotional judgments, and participate cautiously. For those interested in gold but unsure where to start, or whose recent trading has been less than ideal, feel free to contact me. At this stage, adhere to the core strategy of buying on pullbacks and wait for the market to offer more cost-effective opportunities.

Gold is consolidating at high levels; will it go up or down?Gold opened higher yesterday, reaching a high of around 4690. During the European and American sessions, it fluctuated between 4680 and 4660 for an extended period. However, it rallied again at the open today, currently maintaining a strong upward trend, reaching a high of around 4751. The short-term bullish momentum is unstoppable, driven by safe-haven demand, potentially leading to a capital inflow into the market. News is significantly positive for gold, and the current trend is entirely bullish, with all indicators showing a bullish alignment and no signs of pullback. However, reversals often occur when prices are seemingly unassailable. Currently, gold is consolidating near its historical high, which could push it even higher. However, indicators also suggest that the short-term market is overbought. As the market approaches a frenzy, we need to remain calm and maintain a balanced perspective. The current high is around 4751, while the key support below is likely to remain in the 4700-4690 area, which is also likely to form a top-to-bottom reversal. The price broke through this level today and continued to accelerate upwards. Although the upward trend is currently intact, there is a lack of courage to continue chasing the rally. Therefore, conservative traders should choose to observe selectively, while aggressive traders can gradually try shorting with small positions. For gold, we will first try shorting around 4750-4760, with a target of around 4720-4700. If there are signs of stabilization around 4700-4690, we can continue to go long.

The gap in gold prices urgently needs to be filled!Gold Price Trend Analysis: From a technical perspective, looking at the daily chart, gold rebounded last week to fluctuate around 4600. On Friday, influenced by fundamental news, it experienced a rollercoaster ride, with a sharp drop to around 4536 near the 10-day moving average, followed by a rapid rebound to around 4600. The daily candlestick ultimately closed as a bearish doji with a long lower shadow. Today, gold is expected to face resistance around 4700, the upper limit of the daily trading range, while support is seen around 4620 near the 5-day moving average. The gap is located in the 4620-4600 area. Short-term technical predictions are difficult to make, and the current market is highly dependent on fundamental factors, so it is crucial to pay close attention to the impact of fundamental news.
Looking at the 4-hour chart for gold, the Bollinger Bands haven't fully widened, indicating a potential need for consolidation after a strong upward surge. Therefore, given the significant price increase at the open, chasing the price higher is not advisable. If the price retraces during the day, the key support level to watch is around 4620-4600. On the hourly chart, the price is currently maintaining a narrow range at high levels. After continuous consolidation, the technical pattern is showing signs of weakening, with short-term moving averages starting to diverge downwards, suggesting potential for some short-term correction. Pay close attention to the short-term trend. Overall, today's gold trading strategy is to primarily buy on dips and secondarily sell on rallies. Key resistance levels to watch are around 4680-4700, and key support levels are around 4620-4600. Please follow the trend closely.

The rebound is weak, so continue to short at higher levels.Gold Price Analysis: Today is Friday again, and whether it will be a "Black Friday" remains to be seen. However, Fridays are often prone to market reversals. The key now is that the current range will eventually be broken, and the choice of direction and the subsequent trading strategy will be crucial. From a structural perspective, the market is currently consolidating at a high level. The daily chart shows that this high-level fluctuation is still quite risky. However, yesterday's trading volume was relatively high, and the daily candle closed negative, indicating that the bears still have some strength. This is a possibility for further declines. However, as long as the price doesn't break down, we shouldn't be too stubborn about shorting. It's not too late to short when a high-level signal is given, or when the price breaks down. This decline is likely to be quite significant. This decline is likely to be quite significant.
The pattern becomes even clearer on the four-hour chart, with continuous consolidation and fluctuations, somewhat resembling a rounded top. Gold is currently maintaining a high-level range-bound consolidation on the daily chart, with the price temporarily compressed between 4580 and 4640. On the 4-hour chart, the price is currently facing resistance around 4620-4630. Short-term moving averages are starting to turn downwards and diverge, and the candlestick chart is slowly under pressure from the short-term moving averages, maintaining a somewhat weak trend. This suggests that there may be room for further downward adjustment in the short term. On the hourly chart, the price center of gravity is gradually shifting downwards, and the price is slowly breaking through the short-term support zone. On smaller timeframes, the candlestick chart is currently maintaining a relatively weak downward trend along the short-term moving averages. Intraday, the key focus should be on whether the support zone around 4580 can hold. In summary, today's gold trading strategy is to primarily sell on rallies and secondarily buy on dips. The key resistance level to watch in the short term is around 4620-4640, while the key support level is around 4560-4550. Please follow the recommendations carefully.

How to grasp the rhythm of entering the market?Gold Price Analysis: Gold experienced a slight decline during the day. The short position suggested in the strategy around 4610-20 yielded some profit. Currently, gold is maintaining a high-level range-bound consolidation on the 4-hour chart, with the price temporarily compressed between 4580 and 4630. The short-term moving averages are currently in a relatively flat and converged state, suggesting a likely consolidation trend in the short term. However, after a drop on the hourly chart, the price has gradually stabilized, and the short-term moving averages are starting to turn upwards. The candlestick chart is slowly rising above the short-term moving averages, and the price is gradually breaking through the short-term resistance zone, indicating potential for a continued rebound in the short term.
Gold Technical Analysis: Intraday support is seen at the 4580 level, which was tested this morning. This level is currently not crucial in determining the future trend. The key support level to watch is the previous support/resistance level of 4560. Furthermore, rapid pullbacks generally require secondary confirmation; if the weakness continues, the decline could accelerate. The primary resistance level remains around 4620-4630, a key point for the bulls to maintain their position. Given the repeated resistance above, we consider shorting in the short term. If there's a rebound to the 4620-4630 area, consider shorting. In summary, today's gold trading strategy is to primarily sell on rallies and secondarily buy on dips. The key resistance level to watch is 4620-4630, and the key support level is 4560-4550. Please follow the trend closely.

Gold is expected to fall further; continue shorting.Yesterday, gold prices hit a new all-time high, reaching around 4642. Before the US session, prices quickly fell back to around 4600 before rebounding to around 4642 again. Surprisingly, gold prices fell sharply at the open, breaking through the psychological level of 4600. This recent rise in gold prices is likely driven by fundamental factors and geopolitical influences. If these tensions ease, gold prices could fall sharply. On the daily chart, yesterday's close was a large bullish candle, and the moving average system remains in a bullish alignment, consistently above the 5-day moving average. Short-term support is seen around 4580, which was tested once after the open. This level is not yet crucial in determining the future trend. The key support level to watch is the previous support/resistance level around 4560-4650. Furthermore, a rapid decline typically requires a second confirmation during the European session. If the European session remains weak, the US session may accelerate the decline. The primary resistance level remains around 4605-4620, which is also a key level for the bulls to maintain their position. Given the repeated resistance above, I am considering continuing to try short positions in the short term. If the price rebounds to around 4605-4620 during the day, I will continue to short in batches.

Gold is forming a triple top; continue shorting!Gold prices opened higher today, accelerating to around 4639 after breaking through 4630 before stalling and falling back. For two consecutive days, gold prices have broken new highs, but the momentum has been very limited. Yesterday saw a pullback of over $50, indicating some divergence in direction around the 4640-4650 level. Options data also shows a gradual decrease in call options, suggesting a possible correction this week. Although the daily chart shows a new high, it closed with a bearish candle. While the overall trend remains strong, the possibility of a correction is something we need to be aware of. Currently, we can consider a short position around 4640-4650. If the pullback is successful, the key support level is around 4600, where we can consider a long position. The key support level is around 4570. If it breaks below 4570, we should abandon long positions for now, as a sharp drop is possible. If it unexpectedly breaks through 4650, even if there is a short-term rally, the upward momentum should be limited.

How long can the gold bull market continue its run?Gold Price Analysis: After a surge in the previous trading day, gold corrected and closed with a large bullish candlestick with an upper shadow. Gold once again refreshed its historical high to around 4630. While the daily new highs have become somewhat numbing, some short-term pressure is now visible after the initial rise. The first resistance level is at 4610, followed by the high of 4630. Given the significant gains this week, a pullback is possible. Therefore, trend trading may require patience, waiting for a rebound before making a decision. Chasing highs and lows is prone to losses. Currently, after breaking through the previous resistance zone on the daily chart, the candlestick continues its downward trend along the short-term moving averages. The daily chart has now shown three consecutive bullish days, indicating strong overall market performance. In terms of indicators, the 5-day and 10-day moving averages have formed a golden cross and continue to rise, maintaining a bullish moving average system. The focus on the daily chart is whether there will be a pullback followed by a second upward move.
Gold Technical Analysis: On the 4-hour chart, after the close, the price experienced a continuous pullback and is currently consolidating at a high level. Short-term focus is on the support zone around 4570. The candlestick chart is slowly breaking through short-term moving averages, which are gradually flattening out from their previous upward divergence. The short-term trend may remain in a high-level consolidation phase. Intraday support is initially expected around 4560-4550. 4560 is the low point after yesterday's initial break above 4600, while 4550 is a previous high. The potential for a breakout above this level to retest its support/resistance potential is crucial. On the upside, initial resistance is around yesterday's high of 4630. A decisive break above this level could lead to further resistance in the 4650-4660 area. This area, formed by connecting the highs of November 13th and December 26th, 2025, represents a key resistance zone at the current stage. While the overall bullish trend remains unchanged for today's trading, a short-term shorting strategy is still possible. The primary focus today is on entering long positions near the first resistance level of 4630, waiting for a pullback. If shorting opportunities are limited, long positions can be initiated directly. In summary, today's gold trading strategy is to primarily buy on dips and secondarily sell on rallies. The key resistance level to watch in the short term is around 4630-4650, while the key support level is around 4570-4550. Please keep up with the pace of the market.

While maintaining the correct directionexecution must beflexibleGold Price Analysis: After successfully breaking through the previous historical high of 4550, the bulls continued their strong performance, and the overall trend remains bullish. The market moved quickly this morning, and I was unable to participate in time. However, the market is never short of opportunities. Missing a move doesn't affect subsequent strategies. With the high-level structure gradually showing pressure, we patiently waited for the rebound to reach its target before executing short-term short positions. Today, we achieved our target three times in a row by shorting on rebounds, securing a three-game winning streak. Even the fastest market needs a pullback; even the strongest trend has its rhythm. True trading isn't about chasing every wave, but about waiting for your own opportunity. Maintain discipline, respect the structure, and remember that opportunities always favor the prepared.
Gold is currently showing a slightly bullish trend on the 4-hour chart, with the candlesticks continuing to oscillate at high levels along the short-term moving averages. There are still no signs of a top in the short term. The key support level to watch is around 4600-4580. On the hourly chart, after a pullback and correction, the short-term moving averages are continuing to turn upwards, and the candlesticks are maintaining a slightly bullish trend along these moving averages. The smaller timeframes are almost showing a V-shaped reversal. If the price breaks through the highs at the end of the session, the probability of continued upward movement is relatively high. After a single bearish candle on the hourly chart, the price broke through to new highs, followed by a rapid decline to complete a short-term correction before returning to a strong uptrend. In this situation, don't expect a sharp drop tonight. We can see that the lows of the pullbacks are constantly rising, and today marks the first break above 4550. This strong upward trend is likely to continue for at least several trading days. The short-term watershed is 4580; above this level, the bullish momentum is extremely strong. Even if there's no further rise tonight, and the price maintains a high-level consolidation at the close, there's still room for an upward surge at the open tomorrow. Watch the 4640-4650 range above. In summary, today's gold trading strategy is to primarily buy on dips and secondarily sell on rallies. The key resistance level to watch in the short term is around 4640-4650, and the key support level is around 4600-4580. Please follow the trend closely.

Is it still possible to short gold given its strong upward trendGold Price Trend Analysis: After breaking through the 4500 mark last Friday, gold opened slightly higher and continued to rise, currently testing the 4600 mark at its highest point, before undergoing a slight correction. Intraday, pay attention to the support level around 4550, which has now become a key support level. For trading, consider shorting at higher levels and look for opportunities to go long during the European and American sessions if the price retraces and stabilizes. Gold is currently hitting a new historical high on the daily chart, and the candlestick pattern continues its upward trend along the short-term moving averages. Intraday, watch for a potential pullback followed by a second upward move. Short-term support is expected around 4550-60.
Gold Technical Analysis: On the four-hour chart, after a rapid rise, the short-term deviation rate is slightly large, making it unlikely that the upward trend will continue in the short term. It is more likely that there will be some adjustments in the short-term trend. We will see whether the price consolidates at a high level or falls back to complete the technical pattern repair during the day. On shorter timeframes, prices have begun to stabilize slightly. Pay attention to the short-term correction and recovery. Currently, there seems to be no end in sight for gold. Stimulated by news and with the bullish pattern still intact, the fear of further gains and risk aversion doesn't necessarily indicate the arrival of a downtrend. The trend remains extremely strong. The European session continued its upward cycle, and given the current position, the probability of continued upward movement today is high. The current pattern is still very strong, giving the market a feeling of being very bullish, making long positions hesitant, but prices just won't fall, maintaining a strong momentum. It's undeniably strong. Today's market movements, especially short-term price fluctuations, won't affect the upward trend. Therefore, a further breakout and continuation of the upward trend is just a matter of time. It's recommended to go long at lower levels, aiming for new highs. As always: use stop-loss orders, keep positions small, avoid floating trades, and don't be greedy. In summary, today's gold trading strategy is to primarily buy on dips and secondarily sell on rallies. The key resistance level to watch in the short term is around 4600-4610, while the key support level is around 4560-4550. Please keep up with the pace of the market.

Gold breaks 4500 as confidence in US data gets testedUS jobs data for December delivered a messy, two-way market reaction.
According to the Bureau of Labor Statistics, total nonfarm payrolls rose by 50,000 in December. On its own, that headline looks like an economy that is still adding jobs, but at a very slow pace.
Although, prior months were also revised down, including November to 56,000 from 64,000, and October to -105,000 from -173,000.
Gold pushing through the 4,500 level has added to the sense that markets are struggling to settle on a clean interpretation of the data.
Beyond the payrolls report, reporting in Japan has pointed to a possible snap election in February 2026, which can matter for yen pricing.

XAUUSD (H1) – Bullish channel intact, short pullback...Market context
On January 7, spot gold and silver both saw short-term selling pressure.
Spot gold slipped toward 4450–4455 USD/oz after a recent rally.
Spot silver dropped below 79 USD, reflecting broader short-term profit-taking across precious metals.
This pullback looks technical and corrective, rather than a reversal of the broader bullish trend. The macro backdrop remains supportive: geopolitical risks, long-term central bank demand, and expectations of easier monetary policy continue to underpin precious metals.
Technical view – H1 (Lana’s perspective)
Price is still respecting a rising price channel, showing healthy trend structure despite the current retracement.
Key observations from the chart:
The ascending channel remains valid; higher highs and higher lows are intact.
Price has reacted from the upper half of the channel, triggering short-term selling into sell-side liquidity.
The dotted midline and channel support are acting as dynamic reaction zones.
The recent drop appears to be a liquidity sweep / correction, not a breakdown.
This kind of pullback is common after strong impulsive legs and often provides better positioning for trend continuation.
Key levels to watch
Sell-side reaction (short-term pressure)
Near the channel midline and upper resistance, price may remain choppy.
Expect volatility while sell-side liquidity is being absorbed.
Buy-side interest zones
4458 – 4463: First reaction zone inside the channel.
4428 – 4400: Stronger support aligned with channel base and prior structure.
Acceptance above these zones favors bullish continuation.
Fundamental angle
Short-term weakness in gold and silver is driven mainly by profit-taking after recent highs.
Broader fundamentals remain constructive:
Ongoing geopolitical uncertainty
Strong central bank demand
USD valuation and global risk sentiment
These factors suggest that dips are more likely to be corrective opportunities, not trend-ending signals.
Lana’s trading mindset 💛
Avoid chasing price during pullbacks.
Respect the channel structure and wait for price to come into value.
Look for clear confirmation at support zones before engaging.
As long as the channel holds, the bullish bias remains valid.
This analysis reflects a personal technical view for educational purposes only. Always manage risk carefully.

xauusd1st of all very very happy new year to all of you and specially to those who been profitable on 2025, and big congrets to those who loss and still dont give up, because if you give up you will never be their where you want to be, trading takes a time and patient.
i look at gold and consider if its a breakout or not.// so waiting for aconfirmation and some risk on pullback. my 1st trade will be on monday. i have draw a some line which may help to understand easy in my opinion. let me know what you think about a gold is still bullish or it will fall a bit more before go more higher.

XAUUSD Long Setup – Scaling into ~4250 PullbackGold’s holding strong above 4300, and I’m eyeing a high-probability long setup on XAUUSD with a pullback to the ~4250 demand zone. Here’s my plan to scale in and target 4500:
Setup:
Entry Zone: Waiting for a pullback to ~4240–4260, a high-volume support area (confirmed by volume profile) with strong past buyer activity.
Confirmation: Looking for bullish signals in the zone (e.g., pin bar, absorption, or momentum divergence on lower timeframes).
Entry Strategy:
Machine-Gun Style: Scaling in with hundreds of micro-position buy limit orders (0.01–0.02 lots) across 4240–4260 to capture the reversal. Total risk capped at 1–2% of account.
Risk Management: Stops below 4220. If the setup fails (e.g., daily close below 4220), I’ll pause adding orders, close some positions to reduce exposure, or hedge with other pairs (e.g., EURUSD shorts) while keeping margin free.
Exit Plan:
Target: Targeting 4500, a key psychological level with potential resistance.
Profit Management: At +1% basket profit, move stops to breakeven +0.5% (securing a 0.5% win if stopped out). Trail stops to 4500, closing all positions at target.
Hedge Option: If momentum fades (e.g., daily close below 4220), I’ll consider hedging or cutting exposure to protect capital.
Market Context:
Gold’s bullish above 4300, fueled by USD weakness after the Fed’s December rate cut and ongoing safe-haven demand (recent highs near 4366). The 4240–4260 zone aligns with historical support from November 2025 consolidation. With daily volatility at 100–150 points, this setup offers a solid risk-reward for disciplined scaling.
Risk Warning: High-frequency scaling and hedging involve risks. Maintain strict risk control and ensure margin for multi-pair strategies. Trade your plan!
What’s your take on XAUUSD? Drop your setups or thoughts below!
#XAUUSD #Gold #Forex #Scalping #PriceAction

ChatGPT đã nói: Gold May Climb on a Weaker USD and Fed Cut Hope📊 Market Overview:
• Spot gold is currently trading around $4,224.65/oz.
• The bullish momentum is supported by expectations of Fed rate cuts, a weaker USD, and renewed safe-haven demand.
• Market sentiment remains “risk-off,” making gold a preferred defensive asset.
📉 Technical Analysis:
• Key resistance: $4,270–4,280
• Strong resistance: $4,300
• Nearest support: $4,200
• Strong support: $4,155–4,160
• EMA: Price is holding above the EMA → bullish trend remains intact.
• Candlestick / momentum: Upward momentum is stable with no strong reversal signals. A breakout above 4,280 may push gold toward 4,300.
📌 Outlook:
Gold is likely to continue rising in the short term if USD weakness persists and Fed rate-cut expectations remain firm.
However, strong US economic data that lifts bond yields could pull gold back to 4,200 or even the strong support at 4,155–4,160.
💡 Trading Strategy:
🔺 BUY XAU/USD: 4,155–4,158
🎯 TP: 40 / 80 / 200 pips
❌ SL: 4,152
🔻 SELL XAU/USD: 4,303–4,306
🎯 TP: 40 / 80 / 200 pips
❌ SL: 4,309

GOLD (XAUUSD): Road to ATH
As I predicted earlier, Gold successfully bounced to 4215.
The market closed, testing a key daily resistance.
Next week, I suggest looking for its breakout to buy.
Your confirmation will be a daily candle close above 4245.
With a high probability, the market will rise to a resistance
based on a current ATH.
❤️Please, support my work with like, thank you!❤️
I am part of Trade Nation's Influencer program and receive a monthly fee for using their TradingView charts in my analysis.

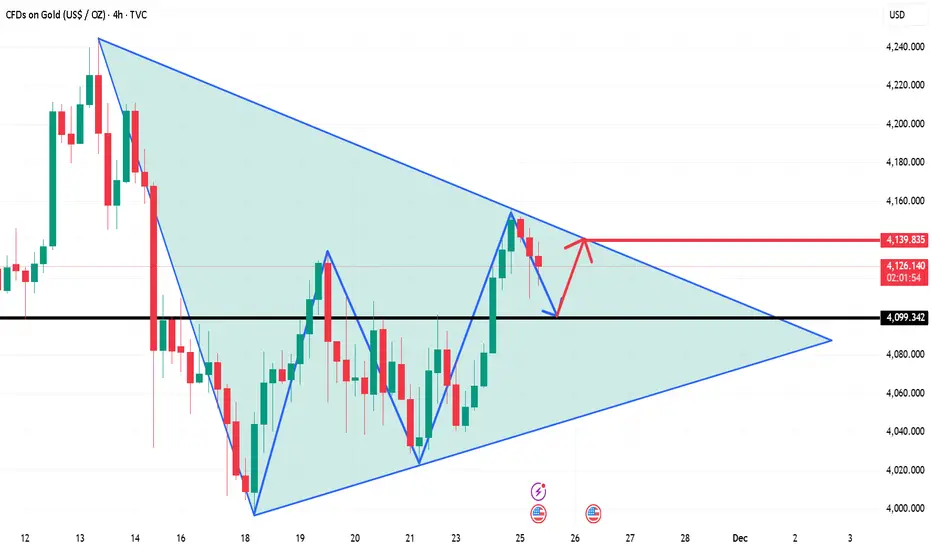
On November 26th, consider buying gold again after it retraces tOn the 4-hour chart for gold, the moving averages continue to trend upwards, maintaining a bullish alignment. Reviewing the intraday gold price movement, the overall trend remains upward, with a short-term pullback from the 415-4160 area. It's important to note that gold has seen minimal pullbacks throughout its upward breakout. The pullback in the European session only tested the 4110 level before continuing its upward climb. The short-term upward trend is expected to continue, and during the US session, buying on dips above 4100 is recommended.

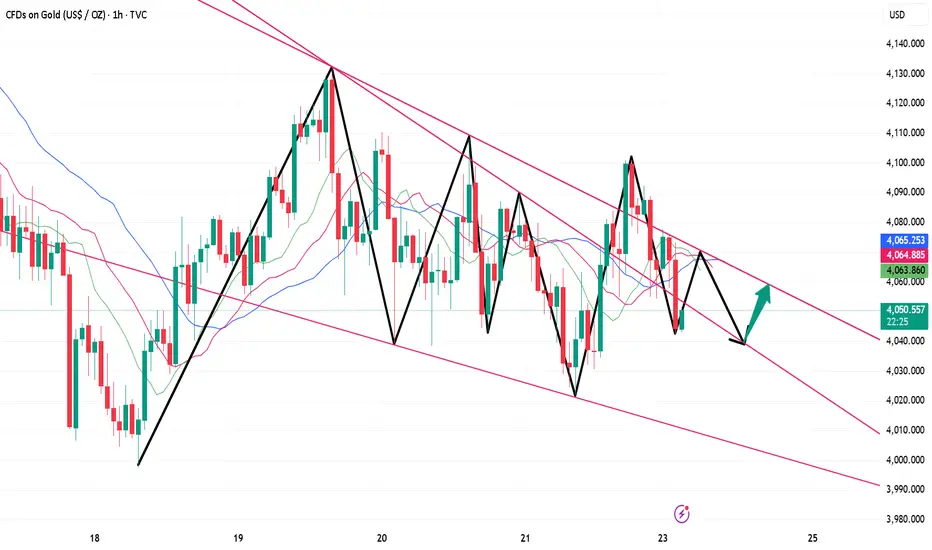
Gold US Session Short-Term Hourly Chart Analysis Guide (NovemberGold hourly chart: Overnight, it rose steadily, and in the Asian session today, it initially continued its upward trend, reaching a high of 4156. However, due to the recent period of consolidation, the continuity of gains has been relatively weak. The initial rise suggests a potential pullback in the afternoon or European session, with a likely scenario of a correction based on the 4150-4160 resistance zone. This prediction ultimately materialized, with the price falling to a low of 4109, close to the 38.3% Fibonacci retracement level of yesterday's gains at 4111. The European session saw a further decline, breaking below the Asian session low. Any subsequent rebound should not be viewed as a bullish trap. Furthermore, based on today's high and low points, 4138 represents the 61.8% Fibonacci retracement level, currently acting as resistance. The best option for the US session is to wait. The next move will likely be a second downward pressure, either stabilizing at 4109 to form a double bottom, or breaking through it to confirm the 4104 annual moving average, or stabilizing at 4097 (50% retracement support) for a bullish move. These two levels also correspond to the short-term 5-day and 10-day support levels on the daily chart. Resistance is at 4138-4140. A break above this level would mean holding above the 10-day moving average, making further declines less likely and potentially pushing higher to test the 4150-4160 high. The key level is 4097. Trading above this level suggests a slightly bullish bias, while trading below it would indicate a weaker bias and a higher likelihood of wide-ranging price swings.
Buy gold on dips on November 24th.In the short term, the daily chart is currently showing signs of weakness, with moving averages turning downwards and the price breaking below the daily mid-band. Therefore, the intraday outlook is likely to be a decline followed by a rise, and our strategy should follow this pattern: short first, then long. For support, we still expect entry around 4025, with a stop-loss at 4005. Upside targets are 4050-80 and 4100. For shorting, we can wait for a rebound to around 4075 before entering, with a stop-loss above 4090. Pay close attention to the strength of the European session. If the European session is strong, buy on dips before the US session; if the European session is weak, sell on rallies before the US session, targeting a bottoming out and rebound.
XAUUSDbased on tecnical only the breakout and creating new low or high will have the new confirmation what gold really up to? considering as an this week gold had played side ways and din break the inside resistent and support. lets see how gold close as weekly candle.
clear draw on the chart so take a good look and understand.
what you think leave a your comment below.
