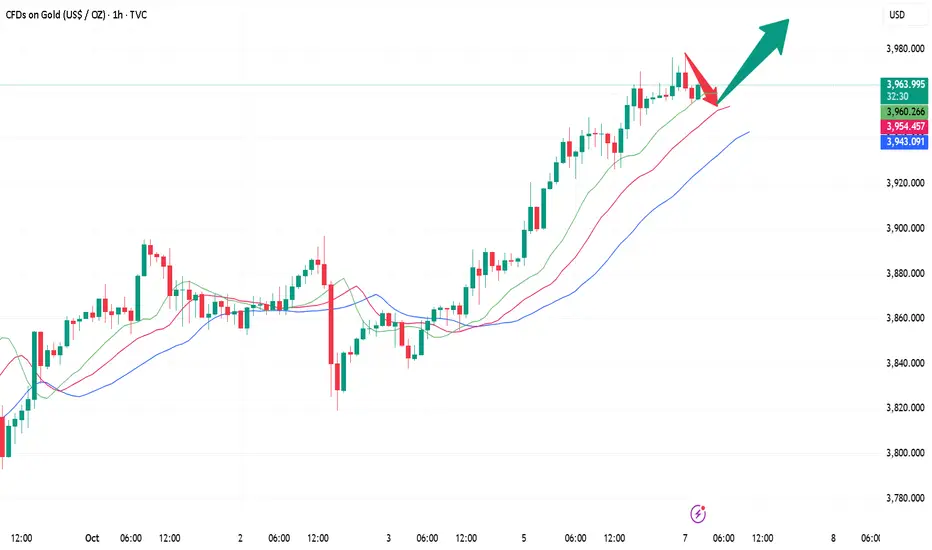
Gold is rising as expected, with the US market eyeing 4000!!!After gold retreated to around 3940, it began to rally. The strategy for the future remains to buy on dips. Short-term long positions near 3942 can be reduced, with a target of 3980 still in sight. Be mindful of the risks. Short-term investors can consider buying around 3954, with a stop-loss at 3946, and targeting a range between 3980 and 4000. Be mindful of the risks.
October 7th US Gold Trading: For those holding positions near 3942, reduce positions and hold with a profit and loss at 3946. Target resistance near 3980, and a breakout to 4000.
Short-term investors can consider buying further near 3954, with a stop-loss at 3946 and a profit target of 3980-4000. Be mindful of the risks.
Goldtrading
Gold Price Analysis – Bullish Above $3910Gold price is currently showing a mild correction after testing the upper trendline of the ascending channel. The chart suggests a possible short-term pullback toward the $3925–$3913 zone, which aligns with the 0.382–0.618 Fibonacci retracement levels. As long as price holds above $3910, the bullish structure remains intact, and a rebound toward $3976 and possibly $4016 can be expected. A break below $3900 would weaken bullish momentum and could extend the decline toward $3875 support.
Support: $3925 / $3910 / $3875
Resistance: $3976 / $4016
Bias: Bullish above $3910; correction possible before next leg up.
Note
Please risk management in trading is a Key so use your money accordingly. If you like the idea then please like and boost. Thank you and Good Luck!

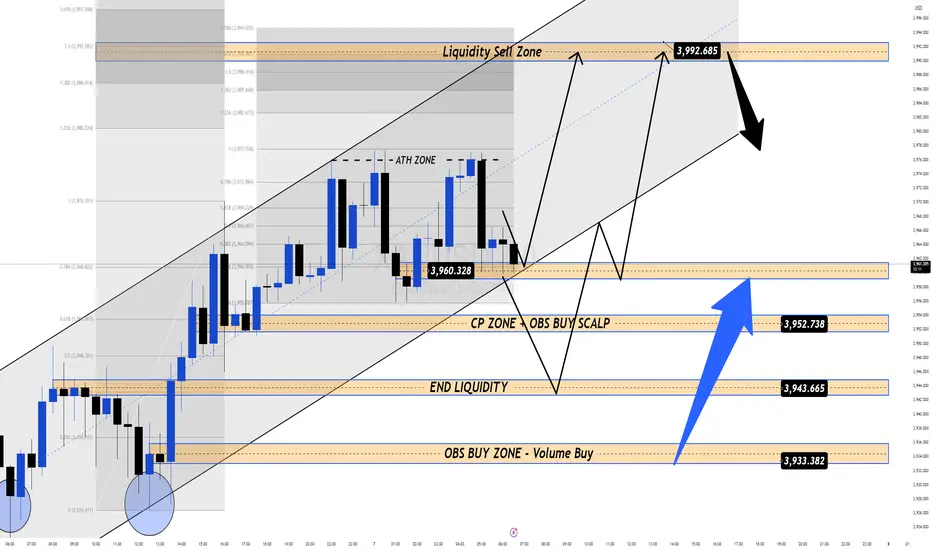
Gold Nears $4000, BofA Warns of Mid-Cycle Correction 🚀 XAUUSD – Daily Trading Plan| MMFLOW TRADING
📊 Market Context
Gold is pushing toward the $4,000/oz milestone, but a fresh warning from Bank of America has traders on alert. Strategist Paul Ciana points out that gold is currently trading 20% above its 200-day moving average — a level that historically preceded sharp corrections (2008, 2011, 2020, 2022).
That said, mid-term forecasts from Goldman Sachs, UBS, and even BofA still project gold could reach $4,200–$4,900/oz in the coming year. The long-term bullish trend remains intact, but in the short term, the risk of sudden corrections is high as the market shakes out FOMO-driven buying pressure.
🔎 Technical Analysis (H1/H4)
Price is consolidating near the ATH Zone and major liquidity levels around 3990–4000.
Buy Zone: 3935–3933 (CP zone & FVG reaction) – attractive area to reload long positions.
Sell Zone: 3993–3995 (Liquidity Zone) – a potential trap area as gold tests the $4000 psychological mark.
🔑 Key Levels
BUY Zones: 3935–3933, with main support at 3910.
SELL Zone: 3993–3995 (watch liquidity reaction).
Psychological resistance: 4000.
📈 Trading Scenarios & Plan
✅ BUY ZONE 1: 3935–3933
SL: 3927
TP: 3940 - 3945 - 3950 - 3960 - 3970 - 3980 - ???
✅ SELL ZONE: 3993–3995
SL: 4000
TP: 3988 - 3984 - 3980 - 3970 - 3960 - ???
⚠️ Risk Management Notes
The 3990–4000 zone is a heavy liquidity cluster — expect false breakouts before reversals.
Only enter trades with clear price action confirmation; avoid chasing FOMO near the highs.
Adjust position sizing carefully, as volatility may spike while markets debate the risk of a “mid-cycle correction.”
✅ Summary
Gold remains in a long-term bullish trend, but traders must respect short-term risks. MMFLOW prioritises buys at 3935–3933 while keeping a cautious eye on the 3993–3995 sell zone near the $4000 mark. Upside targets point toward 3980+, with potential for higher extensions if momentum holds.
📢 Stay tuned with MMFLOW TRADING for real-time updates and BIGWIN setups as gold tests historic highs!
XAUUSD Analysis todayHello traders, this is a complete multiple timeframe analysis of this pair. We see could find significant trading opportunities as per analysis upon price action confirmation we may take this trade. Smash the like button if you find value in this analysis and drop a comment if you have any questions or let me know which pair to cover in my next analysis.

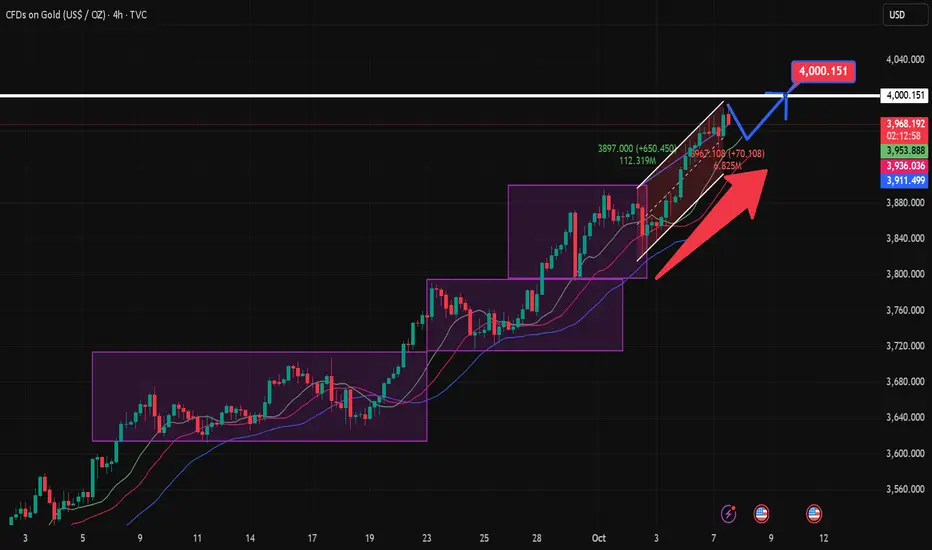
GOLD (XAUUSD): 4000 Soon?!
Gold was strongly bullish on Monday, updating the ATH again.
The next psychological resistance is 4000.
I think that the price will reach that soon.
We will probably see a pullback first.
You can consider the underlined supports, especially Horizontal Support 1
and a Vertical Support 1 for buying after a pullback.
❤️Please, support my work with like, thank you!❤️
I am part of Trade Nation's Influencer program and receive a monthly fee for using their TradingView charts in my analysis.

XAUUSD | Sustainable Price Rise: Where’s the Next Optimal Entry?Hello TradingView community! 🚀
Gold (XAU/USD) is in an extremely sustainable upward structure. Instead of lengthy analysis, let's dive straight into the action plan: Where is the optimal entry point and what target is Gold aiming for? Check out the details below.
1. Market Structure Analysis: The Strength of the Bulls 🐂
Looking at the chart, the first thing that catches our eye is a series of "BoS" points (Break of Structure).
Every time Gold breaks a previous peak, it not only creates a Higher High but also confirms that the uptrend is very strong and sustainable. This indicates that buying power is completely dominant and shows no signs of weakening. Smart Money is continuously pushing the price higher, and our job is to ride this "wave."
2. Potential Buying Zones - Where to Catch the Wave? 🧐
To optimize profits and minimize risks, finding a beautiful entry point after a price correction is crucial. Based on the chart, we have 2 notable potential buying zones:
Buying Zone 1 - Fibonacci Confluence ($3885): This is an extremely ideal "Buy Zone," coinciding with the golden Fibonacci ratio of 0.618. In technical analysis, this is a very strong support level where prices tend to reverse and continue the main trend. Professional traders always hunt for pullbacks to this zone.
Buying Zone 2 - Exploiting FVG ($3914 - $3933): Slightly higher, we have the FVG (Fair Value Gap) area at $3914 and the "Buy Scalping" zone at $3933. These are "price gaps" created by supply-demand imbalances when prices rise too quickly. The market tends to return to fill these gaps before continuing its journey. This could be an opportunity for those wanting to catch an earlier wave.
3. Conquest Target - What's Gold's Next Destination? 🎯
Once we have a buying position, where will our target be?
Short-term target: The "Sell Scalping FVG" zone around $3969 could be a minor resistance point where some traders will take profits.
Main target: The ultimate destination this structure is aiming for is the "Sell Gold Liquidity" zone at $3998. This is a critical "liquidity" area, concentrating many stop-loss orders from the Sellers. Prices are often attracted to these zones like a "magnet" to sweep liquidity before making further moves.
Summary & Advice
Main trend: UP.
Primary strategy: Buy on dip when prices correct to key support zones.
Potential buying zones: $3885 (Fibonacci) and $3914 - $3933 (FVG).
Price targets: $3969 (short-term) and $3998 (main target).
Always remember, risk management is the key to surviving in the market. Set reasonable Stop-loss for every trade.
WHAT DO YOU THINK ABOUT THIS PLAN?
Will Gold retrace to the Fibonacci zone $3885 or react right at the FVG zone $3914? Leave your thoughts and perspectives in the comments below. Let's discuss together to find the best opportunities!
👇 Don't forget to Like 👍 and Follow my TradingView channel to not miss daily Gold analysis!

10.7 Gold has no ceiling!!!The one-hour pattern of gold, the golden cross of the moving average continues to radiate upward, maintaining strong bullish momentum. Pay attention to the short-term support below 3930-3920, which was the springboard for gold to accelerate yesterday. The upper resistance level should focus on the 3980 line. Every time the gold price reaches a new high, it will fall back to accumulate power. Just remember not to chase highs. For intraday operations, we can continue to maintain low-long participation!
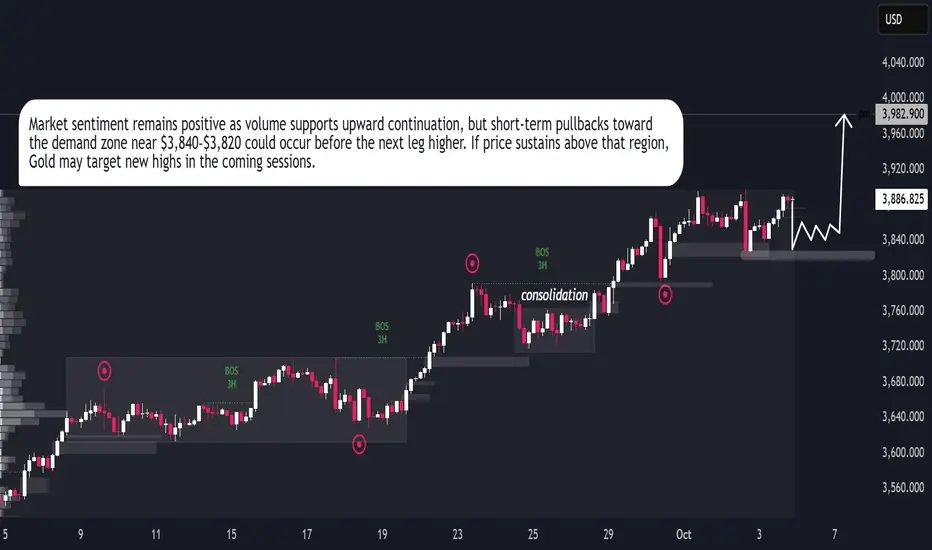
GOLD → Structural Rebalance Before Next Bullish LegGOLD → Structural Rebalance Before Next Bullish Leg
Gold remains in a strong bullish structure, showing consistent higher highs and steady momentum after each correction. The market has been consolidating above the $3,800 zone, where buyers continue to absorb liquidity and prevent deeper declines. This zone acts as a solid base for potential upward expansion. Current market behavior indicates controlled accumulation, suggesting that institutional buyers are maintaining dominance. If gold holds above $3,840–$3,820, the next bullish leg may target the $3,960–$4,000 region. A short-term retracement could occur, but overall momentum favors continuation. The price structure and volume behavior both support further upside, reflecting strong buyer control and stable sentiment in the market.
10.6 Gold US Trading Strategy, Bulls Push Up and No TopLooking at the 4-hour market trend, we are watching for short-term support at 3920, with a focus on the 3895-3900 support level. The bulls are rising strongly and there is no end in sight. Trading strategies should focus on buying on pullbacks. For intermediate positions, we should be cautious in chasing orders and patiently wait for key entry points. I will provide detailed trading strategies during the trading session, so please pay attention.
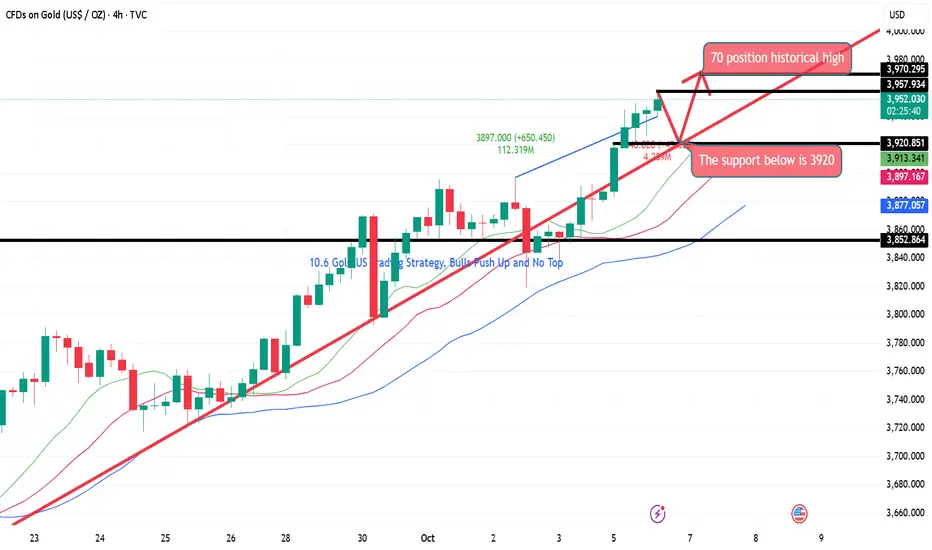
10.6 Gold's callback is small and it may continue to riseAfter breaking through a previous resistance zone on the 4-hour chart, gold is continuing its upward trend along its short-term moving average. Intraday pullbacks have been mild and sustained, and there are still no signs of a peak in the short term. On the hourly chart, after a surge, gold is maintaining a high-level correction, but recent high-level corrections have ultimately evolved into secondary gains, and today's pullbacks were not significant. On the short-term chart, the candlestick chart is gradually coming under pressure, maintaining a weak trend along the short-term moving average. Some short-term correction is possible. If the correction in the US market is not significant, it may even rebound to the current price after a minor correction. Further upward movement is expected after the open!!!
Gold Breaks $3900: Safe-Haven Demand Soars & Fed Fuels the Rally📊 Market Context
Gold has smashed through the psychological $3,900 barrier, reaffirming its dominance as the ultimate safe-haven asset.
US government shutdown → drives defensive capital flow into gold.
Fed expected to cut rates by 0.25bps → further strengthens gold’s appeal as a non-yielding asset.
Data gap due to the shutdown → traders now rely on private reports, adding uncertainty and keeping gold in the spotlight.
👉 With the USD under pressure, capital fleeing risky assets, and FOMO from buyers intensifying, gold is well-positioned to target the 3950–3990 zone in the short term.
🔎 Technical Analysis (H1/H4)
Primary trend: Strong uptrend, price holding above the ascending channel.
BUY ZONE 1: 3904–3902 → CP Volume Zone, strong support for continuation.
BUY ZONE 2: 3885–3883 → Retest of old ATH breakout zone.
SELL Zone: 3949–3950 → Liquidity Zone, possible false breakout/trap.
Extended Target: 3994 (Fib 3.618).
🔑 Key Levels
BUY Zones: 3904–3902, 3885–3883
SELL Zone: 3949–3950
Resistance: 3950, 3994
Support: 3900, 3880
📈 Scenarios & Trading Plan
✅ BUY ZONE 1: 3904–3902
SL: 3898
TP: 3910 - 3915 - 3925 - 3935 - 3945 - ???
✅ BUY ZONE 2: 3885–3883
SL: 3878
TP: 3895 - 3905 - 3920 - 3935 - 3945 - ???
⚠️ SELL ZONE (scalp/trap): 3949–3950
SL: 3955
TP: 3940 - 3935 - 3925 - ???
⚠️ Risk Management Notes
Price may sweep liquidity above 3950 before pulling back → wait for confirmation price action.
Avoid chasing highs – priority remains buying dips into key support zones.
Keep position sizing moderate ahead of unexpected Fed comments or policy shocks.
✅ Summary
Gold is in its “golden phase” of bullish momentum: political uncertainty + dovish Fed + safe-haven demand = BUY remains the core strategy. Preferred entries sit at 3904–3902 and 3885–3883, with upside potential stretching toward 3950–3990. Short-term SELL setups only valid as liquidity traps near resistance.
📢 Follow MMFLOW TRADING for real-time updates and BIGWIN setups every session!

10.6 Gold European Short-term Technical Analysis!!!Gold has been rising for several consecutive weeks, breaking through the upper Bollinger Band on the weekly chart, and the RSI has reached the overbought zone, suggesting further upward movement. Friday saw a small bullish close, and today's Asian session saw further gains. The daily RSI has again reached the overbought zone, and the 4-hour chart is above the upward trend line, breaking through the ascending triangle.
Trade Recommendation: BUY: 3920 Target: 3940 3950
10.6 Gold falls back and continues to go longGold prices are currently moving out of a narrow range of highs on the daily chart. The K-line chart continues to maintain a relatively stable upward trend along the short-term moving average. Watch for any pullbacks on the daily chart to confirm a secondary upward trend. Focus on the support zone around 3900 in the short term. On the 4-hour chart, the price broke through the previous resistance zone, and the short-term moving average began to diverge upward, indicating a relatively strong short-term trend. On the hourly chart, the intraday pullbacks were neither strong nor prolonged, and the K-line chart continues to maintain a relatively strong trend along the short-term moving average. Some divergence is showing on the short-term chart, so watch for short-term adjustments.
Trading Strategy:
BUY: 3910 TP1:3925 TP2:3940
SELL: 3940 TP1:3910 TP2:3900
GOLD 1H CHART ROUTE MAP UPDATE & TRADING PLAN FOR THE WEEKHey Everyone,
Please see our updated 1h chart levels and targets for the coming week.
We are seeing price play between two weighted levels with a gap above at 3907 and a gap below at 3880. We will need to see ema5 cross and lock on either weighted level to determine the next range.
We will see levels tested side by side until one of the weighted levels break and lock to confirm direction for the next range.
We will keep the above in mind when taking buys from dips. Our updated levels and weighted levels will allow us to track the movement down and then catch bounces up.
We will continue to buy dips using our support levels taking 20 to 40 pips. As stated before each of our level structures give 20 to 40 pip bounces, which is enough for a nice entry and exit. If you back test the levels we shared every week for the past 24 months, you can see how effectively they were used to trade with or against short/mid term swings and trends.
The swing range give bigger bounces then our weighted levels that's the difference between weighted levels and swing ranges.
BULLISH TARGET
3907
EMA5 CROSS AND LOCK ABOVE 3907 WILL OPEN THE FOLLOWING BULLISH TARGETS
3937
EMA5 CROSS AND LOCK ABOVE 3937 WILL OPEN THE FOLLOWING BULLISH TARGET
3965
EMA5 CROSS AND LOCK ABOVE 3965 WILL OPEN THE FOLLOWING BULLISH TARGET
3993
EMA5 CROSS AND LOCK ABOVE 3993 WILL OPEN THE FOLLOWING BULLISH TARGET
4019
BEARISH TARGETS
3880
EMA5 CROSS AND LOCK BELOW 3880 WILL OPEN THE FOLLOWING BEARISH TARGET
3848
EMA5 CROSS AND LOCK BELOW 3848 WILL OPEN THE FOLLOWING BEARISH TARGET
3819
EMA5 CROSS AND LOCK BELOW 3819 WILL OPEN THE SWING RANGE
3683
3654
EMA5 CROSS AND LOCK BELOW 3654 WILL OPEN THE SECONDARY SWING RANGE
3781
3743
As always, we will keep you all updated with regular updates throughout the week and how we manage the active ideas and setups. Thank you all for your likes, comments and follows, we really appreciate it!
Mr Gold
GoldViewFX

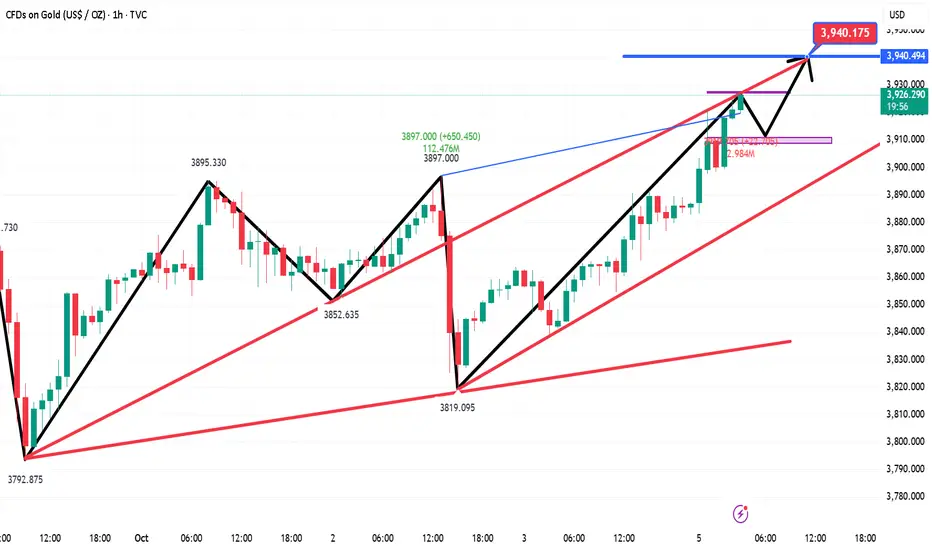
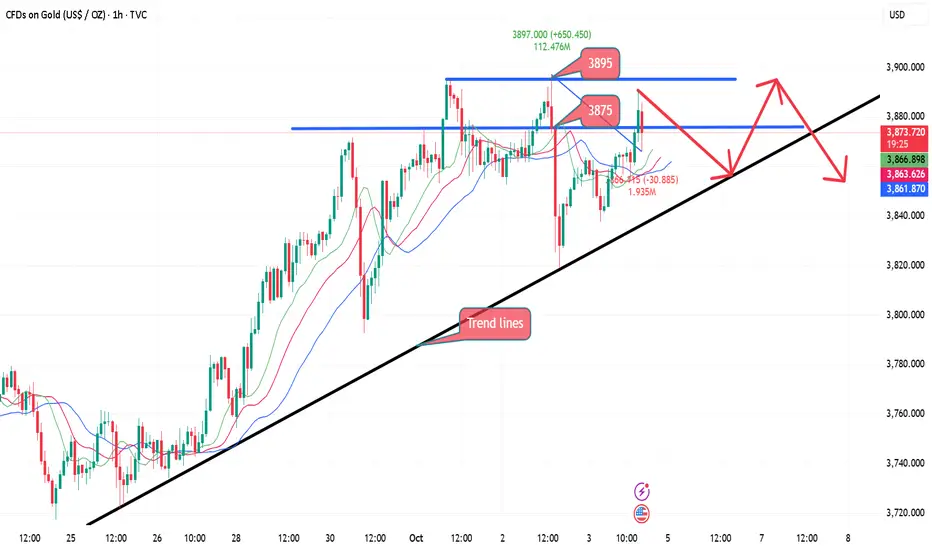
GOLD (XAUUSD): Get Ready For Breakout
Gold closed, approaching a strong horizontal resistance based on a current
All-Time High.
Following a bullish accumulation, there is a high chance that the underlined
structure will be broken, and the price will go higher.
Wait for a 4H candle close above 3897 as a confirmation,
expect a bullish continuation to 3920 then.
❤️Please, support my work with like, thank you!❤️
I am part of Trade Nation's Influencer program and receive a monthly fee for using their TradingView charts in my analysis.

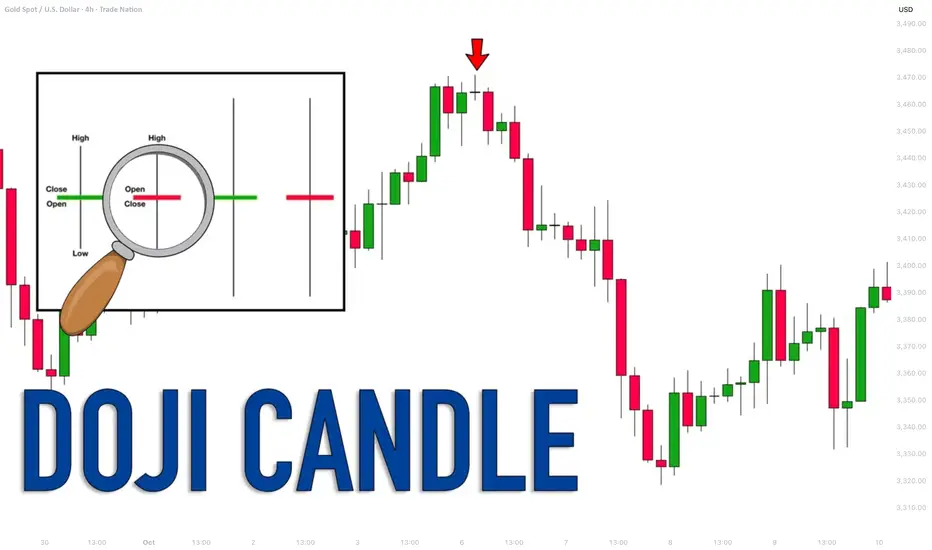
Learn Profitable Doji Candle Trading Strategy (GOLD, FOREX)
In the today's post, I will share my Doji Candle trading strategy.
This strategy combines the elements of multiple time frame analysis, price action and key levels.
Step 1
Analyze key levels on a daily time frame.
Identify vertical and horizontal supports and resistances.
Here are the key structures that I spotted on AUDUSD.
Step 2
Look for a formation Doji Candle on a key structure.
This rule is crucially important: we will trade only the Doji candles that are formed on key levels.
From key supports , we will look for buying , and we will look for shorting from key resistances .
Look at this Doji Candle that was formed on a key daily support on AUDUSD.
Step 3
Look for a horizontal range on a 4h/1h time frames.
Doji Candle signifies indecision . Quite often, you will notice the horizontal ranges on lower time frames when this candlestick is formed.
Here is a horizontal range that was formed on a 4H time frame on AUDUSD after a formation of Doji.
Step 4
Look for a breakout of the range.
To sell from a key resistance, we will need a bearish breakout of the support of the range. That will be our bearish confirmation.
To buy from a key support, we will need a bullish breakout of the resistance of the range. It will be our bullish signal.
Here is a confirmed breakout of the resistance of the range with a 4H candle close above. That is our bullish confirmation on AUDUSD.
Step 5
Buy aggressively or on a retest.
After you spotted a confirmed breakout of the range, open a trading position aggressively or on a retest.
Personally, I prefer trading on a retest.
If you sell, a stop loss should be above the high of the range and your target should be the closest key daily support.
If you buy, your stop loss should be below the low of the range and a take profit will be on the closest daily resistance.
On AUDUSD, a long position was opened on a retest. Stop loss is lying below the lows. Take profit is the closest resistance.
Here is how this great strategy works!
Always patiently wait for a confirmation! That is your key to successful trading Doji Candle.
❤️Please, support my work with like, thank you!❤️
I am part of Trade Nation's Influencer program and receive a monthly fee for using their TradingView charts in my analysis.
USDCHF Breakdown – Eyes on 0.7920Price couldn’t hold inside the rising structure and has broken below the trendline. That confirms sellers are taking control again. The rejection from the supply area above (0.8000 zone) added more weight to this bearish setup.
👉 My expectation is for price to drop toward 0.79200 – that’s the level I’ve marked on the chart.
This aligns with the 1.618 fib extension and sits just before deeper liquidity levels.
⚡ For me, this is a clean short opportunity as long as price stays below the broken support line.
If bulls want to reverse, they need to close back above 0.7980. Until then, I’ll stay with the bearish side.
Plan:
- Targeting 0.7920.
- If price reaches there, I’ll check for reaction (possible bounce or
continuation).
- No long entries for now – only watching sellers.
Patience is the key again here, waiting for price to complete the move into my expected zone.

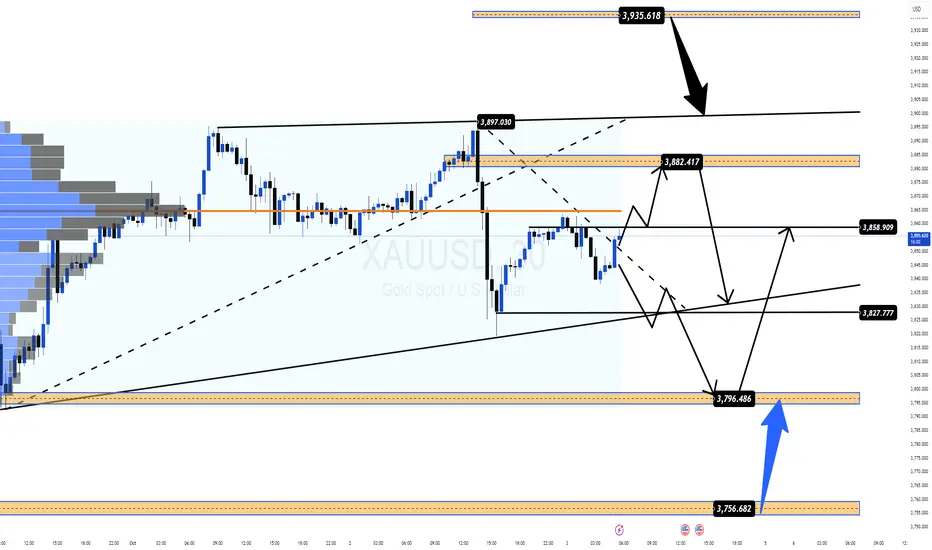
10.3 Gold US Market Technical Analysis!!!Our overall judgment on gold in October is "bumpy", that is, the market has turned from the steady slow bull market in September to a fluctuating rise. There will be a tug-of-war between long and short positions, and there will be a tug-of-war between highs and lows and a rapid rebound. However, this does not mean the end of the bull market, but only a change in the rising rhythm. We should pay attention to this pattern change in the short term. We will still view it as a strong rhythm during the day. After the volatile upward trend in the Asian and European sessions, we will choose to follow up with a bullish trend after a pullback. Pay attention to the suppression around 3874 and 3895 on the upside. At the same time, due to the uncertainty of the non-farm payroll results, whether it is announced or not will have a greater impact on today's operations.
Daily Plan: Gold Targets 7th Straight Weekly Gain📊 Market Context
Gold holds firm above $3,850, aiming for its 7th consecutive weekly gain.
🔥 Main driver: Risks from a prolonged U.S. government shutdown.
📉 54% probability of the shutdown lasting 29 days (Polymarket) → directly impacting gold sentiment.
🛡️ Safe-haven demand & BUY-side FOMO keep fueling momentum.
⚖️ Still, profit-taking at higher resistance zones could trigger sharp swings before the next directional move.
🔎 Technical Analysis (H1/H4)
📈 Main trend: Bullish, but consolidating near 3,850.
🚧 Key Resistances: 3882–3884 & 3934–3936 (Liquidity Sell Zones).
🏦 Key Supports: 3797–3795 & 3756–3754 (Buy Zones).
🎯 Key Levels: 3850 – 3880 – 3900.
📈 Trading Scenarios & Plan
✅ SELL ZONE 1: 3882–3884
SL: 3890
TP: 3878 – 3874 – 3870 – 3865 – 3860 – 3850 – 3840 – ???
✅ SELL ZONE 2: 3934–3936
SL: 3940
TP: 3930 – 3925 – 3920 – 3910 – 3900 – ???
✅ BUY ZONE 1: 3797–3795
SL: 3790
TP: 3800 – 3810 – 3820 – 3830 – 3840 – ???
✅ BUY ZONE 2: 3756–3754
SL: 3750
TP: 3760 – 3770 – 3780 – 3790 – 3800 – ???
⚠️ Risk Management Notes
🌀 U.S. shutdown headlines may spark unexpected volatility.
🕵️♂️ Focus on BUY setups at support, avoid chasing FOMO at highs.
❌ Consider SELL only if clear rejection signals form at resistance zones.
✅ Summary
Gold remains supported by safe-haven flows, eyeing a 7-week winning streak.
🎯 Strategy:
BUY setups: 3797–3795 & 3756–3754.
SELL setups: 3882–3884 & 3934–3936.
📢 Follow MMFLOW TRADING for real-time updates & BIGWIN setups!
9.3 Gold awaits non-farm payrolls!!!Gold's daily candlestick chart continues to fluctuate slightly higher along its short-term moving average, with prices currently under pressure around 3900. Tonight's non-farm payroll data may not be released as expected, adding some uncertainty to the market. On an hourly chart, after a period of narrow range-bound trading, the technical pattern is gradually recovering. With prices slowly breaking through the previous resistance zone, there may be some short-term rebound potential. On a four-hour chart, the short-term moving averages are essentially flat, suggesting continued high-level fluctuations and repairs. Watch for short-term corrections.

Gold Market Outlook – Bullish Trend Building MomentumGold continues to follow a structured bullish cycle, where each consolidation phase has been followed by a breakout and expansion. Market behavior shows liquidity being collected in sideway ranges, then released to fuel upward momentum.
At the current stage, price is trading around $3,870, showing signs of a potential short-term pullback to gather liquidity from the mid-zone. Once this corrective move stabilizes, the chart suggests a renewed bullish impulse with a projected upside target toward the $3,965 level.
This pattern highlights that the market remains in a controlled bullish phase, where temporary retracements are acting as setups for continuation rather than reversal. The underlying flow still favors higher levels as long as buyers maintain activity after corrections.

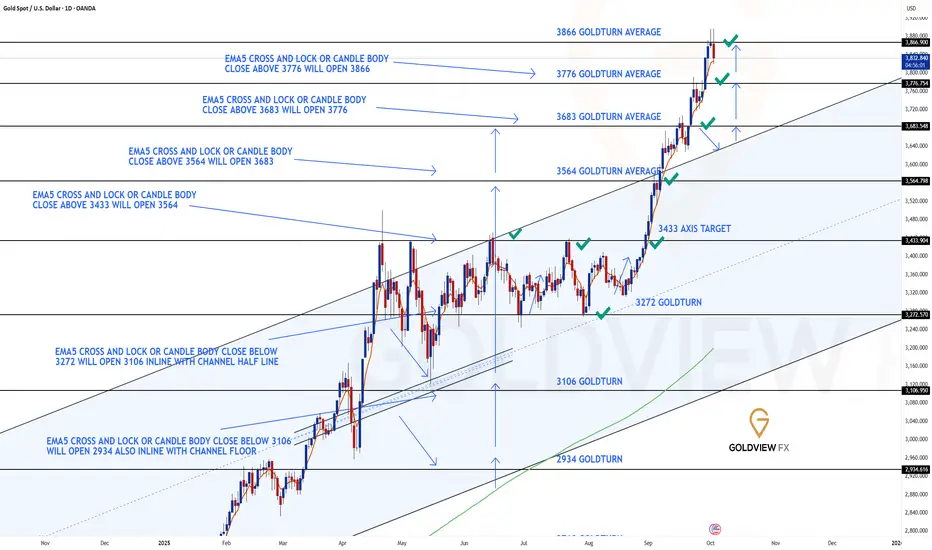
DAILY CHART UPDATEHey Everyone,
Another great day on the charts with all our chart ideas now complete. Please see update on our Daily chart idea, which is now respecting the final target.
✅ 3776 & 3866 Targets Achieved!
Our chart ideas played out perfectly — 3683 → 3776 → 3866 final daily target completed.
Now the focus is on what’s next:
Breakout Scenario: A clear close above 3866 = continuation higher.
Rejection Scenario: Failure to close above = rejection, which we’re already starting to see now. Resistance is holding, and we may get the first leg of a correction.
Let’s see if momentum picks up enough to test the lower Goldturns for support and bounce.
Key Levels
📉 Support: 3776 / 3683
📈 Resistance: Above 3866 (on confirmed breakout)
Stay tuned for the next update as this plays out.
Mr Gold
GoldViewFX
(XAU/USD) – Gold to reach $4,000/oz: Where is the best buy point1. Price Structure & Main Trend
On the H1 timeframe, gold still maintains a bullish structure with higher highs and higher lows.
After the Break of Structure (BoS), price retraced to test the Buy Zone around 3,862 and bounced back up.
Currently, price is trading above both EMA34 and EMA89, confirming that the uptrend remains dominant.
2. Key Zones
Buy Zone: 3,862 – 3,865. Short-term support, aligned with the previous BoS. If price holds above this zone, the bullish scenario is strengthened.
Order Block (OB) 1: 3,806 – 3,810. Next support zone if the Buy Zone is broken.
Order Block (OB) 2: 3,763 – 3,770. Deeper support, activated only in case of a strong correction.
Sell Scalping Zone (Fibo): around 3,912. A potential short-term resistance where profit-taking may occur.
Sell Zone / ATH: 3,933 – 3,935. Breaking above this area may lead gold to a new all-time high.
3. Trading Scenarios
Bullish (Main Scenario):
Look to buy at 3,862 – 3,865 if price retests.
SL: Below 3,850 (under Buy Zone and EMA89).
TP1: 3,912 (Sell Scalping Zone).
TP2: 3,933 – 3,935 (new ATH).
Bearish (Defensive Scenario):
If price breaks below Buy Zone and closes under 3,860, it may test OB 3,806 – 3,810.
In a worse case, if OB1 is also lost, short-term bullish momentum could weaken, pushing gold to OB 3,763 – 3,770.
4. Summary
Gold on H1 maintains strong bullish momentum after breaking structure. The optimal plan is to prioritize buying at key support, manage risk tightly, and gradually take profit at resistance zones. If price surpasses 3,933, gold may enter a new all-time high phase.
