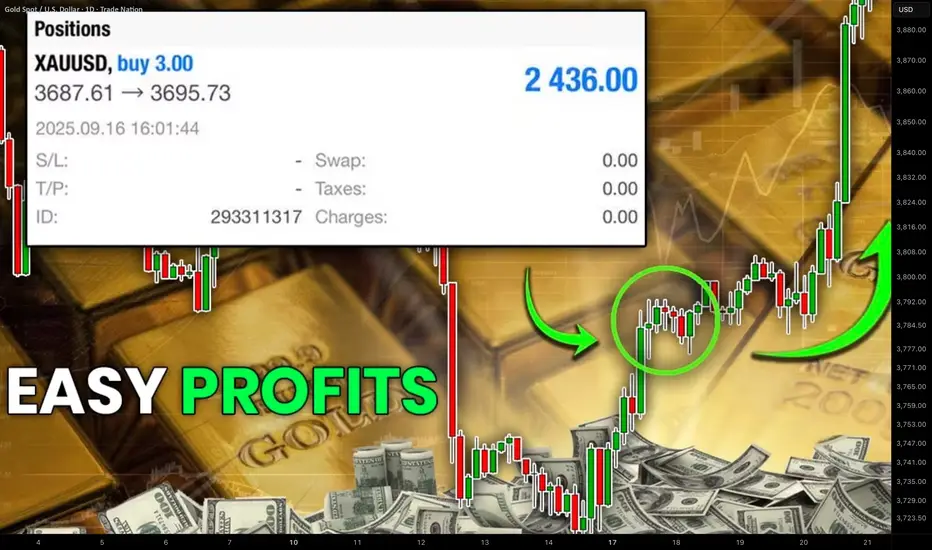
Profitable Gold XAUUSD Indicator Trading Strategy Explained
To profitably trade a massive bullish rally on Gold , you don't need a complicated system.
In this article, I will teach you an easy indicator strategy for trend-following trading XAUUSD.
It is based on 2 default technical indicators that are available on any trading platform: Mt4, Mt5, TradingView, etc.
You will get a complete trading plan:
exact entry signal,
smart stop loss placement,
trade management rules.
The first indicator that you will need to trade this strategy is Moving Average.
We will use a combination of 2 Moving Averages: Exponential Moving Average EMA with 20 length and a Simple Moving Average SMA with 9 length.
Our entry signal will be a crossover of 2 MA's on a 4H time frame.
SMA and EMA should meet first.
SMA should break through EMA to the upside to confirm a bullish signal.
With a high probability, Gold price will rise significantly then.
The main nuance of this strategy is to wait for a confirmed crossover and avoid the traps.
Patiently wait for a touch of 2 moving averages first.
After that, you will need to wait for a close of one more 4H candle to make sure that SMA stays above EMA.
You can see that though 2 Moving Averages met, SMA failed to break through EMA.
That is how a valid buy signal looks: SMA stays above EMA after a close of the next 4H candle.
After you identified a valid crossover, it is your signal to open BUY trade on Gold .
Your entry should be exactly after a close of a 4H candle.
Stop loss will be based on another popular free indicator - Average True Range ATR with default 14 length settings.
Your safe stop loss should be 2 ATR from the entry.
In our example, ATR is 145 pips.
2 ATR will be 190 pips.
That will be our stop loss.
With this trading strategy, we will not use a fixed Take Profit TP and use trailing stop loss instead.
It will help us to catch extended bullish waves on Gold.
Once the market starts rising, updating the highs, trail your stop loss based on EMA and keep it 1 ATR below that.
Make sure that you move your stop loss only when EMA and Gold price are rising . Once Gold price or EMA start moving in sideways or go down, do not lower your stop loss.
Using this strategy consistently, you will be able to catch significant bullish waves.
In Autumn trading season of 2025, this strategy provided, 3100+ pips entry signal.
What I like about this strategy is that being very simple, you can easily backtest that and measure its objective trading performance.
Easy entry, confirmation, and trade management rules make this strategy appropriate for beginners in Gold trading and will help to not miss a current extraordinary trend.
❤️Please, support my work with like, thank you!❤️
I am part of Trade Nation's Influencer program and receive a monthly fee for using their TradingView charts in my analysis.
Goldtrading
The Market Is Still in Distribution, but Smart Money Moves QuietGold is trading around $3,990, recovering slightly after last week’s sharp sell-off. However, from a Smart Money Concept (SMC) perspective, the market structure continues to show clear bearish intent — with lower highs, unmitigated supply zones, and descending liquidity still controlling price flow.
💭 1️⃣ Market Structure – The Bearish Flow Remains Intact
After several BOS (Break of Structure) and CHoCH (Change of Character) confirmations, the bullish attempts are getting weaker.
Price remains capped under a clean descending trendline, showing how sellers are gradually stepping in at every premium retracement level.
The current market is operating within a distribution phase, where Smart Money continues to build short positions above liquidity zones while trapping late buyers inside minor pullbacks.
The key level 4,043 – 4,050 stands out as the nearest Bearish Order Block (OB) and strong short-term supply. Until this area is decisively broken, Gold remains technically bearish.
🩶 2️⃣ Supply Zones – Where Smart Money Left Their Footprints
Karina is currently watching three critical supply layers:
4,043 – 4,050: Active supply zone aligning with trendline confluence – ideal for short-term sell setups.
4,149 – 4,160: A deeper liquidity pocket where Smart Money previously distributed heavy positions.
4,221 – 4,359: Major macro supply zones – where institutional orders were likely built during October’s highs.
Price is still well below these regions, suggesting that any rally remains corrective rather than impulsive.
🧭 3️⃣ Liquidity Context – The Path of Least Resistance
Below current price, 3,884 – 3,890 forms the next liquidity magnet — a cluster of equal lows and inefficiency gaps that Smart Money might target next.
Above, resting buy-side liquidity around 4,050 gives institutions a perfect opportunity to engineer a small push up before resuming the main downtrend.
This is the same pattern we’ve seen repeatedly: liquidity grab → displacement → continuation.
🌙 4️⃣ Trading Scenario – Flow With the Institutions, Not Against Them
As long as the structure remains below the trendline, Karina maintains a bearish bias.
If price retests 4,043 – 4,050 and shows rejection through a bearish engulfing or sharp rejection wick, short setups will align with SMC logic.
Entry: 4,043 – 4,050
Stop Loss: 4,060
Take Profit: 3,884 – 3,890
The setup offers a clean 1:4 R:R, based purely on structure and liquidity flow — no indicators, no noise.
🌷 5️⃣ Reflection – When Silence Speaks Louder Than Volatility
Gold’s current rhythm is calm yet calculated. Every retracement feels like a whisper from Smart Money — testing patience, not conviction.
For Karina, this is the phase where discipline matters most.
While many chase impulsive moves, Smart Money quietly prepares for the next wave, and the charts tell their story to those patient enough to listen. 🌙
This analysis reflects Karina’s personal view and is not financial advice.
What do you see in today’s Gold structure? Is this retracement a calm before another drop, or the beginning of accumulation? Let’s discuss below 💬

Gold Rebuilds Structure Above $3940, Eyeing $4030 Liquidity Pool
🔍 Market Context
Gold is attempting to regain bullish momentum as safe-haven demand remains supported by rising geopolitical tensions and uncertainty around the upcoming US ADP employment data.
The market continues to oscillate between risk aversion and rate expectations — with the Fed’s hawkish tone keeping the Dollar capped but steady.
At the same time, capital flow rotation from equities into defensive assets is quietly supporting the metal’s structural recovery, with gold holding above key liquidity levels despite intraday volatility.
📊 Technical Analysis (H1–H4)
After forming a double-bottom structure near $3,938, XAU/USD has reclaimed the 38.2% retracement zone (3,974–3,975) from its previous bearish leg.
This area now acts as a pivot zone, separating short-term bullish continuation from potential retracement.
The chart reveals a classic liquidity cycle shift:
Phase 1: Sweep of downside liquidity below 3,930, marking an internal structural low.
Phase 2: Expansion leg reclaiming short-term FVGs, signaling a potential smart money accumulation phase.
Phase 3: Repricing toward upper liquidity targets aligned with Fibonacci extensions.
Key Technical Zones:
• 💎 Liquidity Base: 3,938 – 3,950 (recent demand re-entry area)
• 🎯 Rejection Zone 1: 3,974 – 3,999 (previous inefficiency block)
• ⚙️ Target Zone: 4,033 – 4,045 (1.272–1.618 Fibo extensions, liquidity pool)
• ⚠️ Invalidation: Break below 3,920 would shift structure back to distribution.
🎯 MMFLOW Scenario
If gold sustains above the 3,950 support cluster, buyers are likely to extend the retracement toward 3,999–4,033 where resting liquidity sits.
A clean rejection from 4,000 could trigger an intraday pullback — but as long as price holds above the 3,938 OB base, the bullish recovery structure remains intact.
The short-term narrative favors controlled accumulation, suggesting that smart money is building positions into liquidity zones before the next impulsive move.
⚜️ MMFLOW Insight:
“Liquidity isn’t random — it’s engineered. Every move leaves a footprint, and gold is tracing its next one above $3,950.”

XAUUSD – PRIORITIZE BUYING, TARGET 4040XAUUSD – PRIORITIZE BUYING, TARGET 4040 🎯
🌤 1. Overview
Hello everyone 💬
My perspective on gold today is still to prioritize buying, as there hasn't been a clear deep decline.
The price is currently consolidating in a narrow range, needing more time to build momentum before breaking out.
I will wait to buy again at the OB area – where there is high liquidity, this is a zone likely to see strong price reactions.
The best scenario today: the price may sell off slightly at FVG, then drop to OB to trigger the buy setup.
💹 2. Technical Analysis (ICT Perspective)
💜 Price Structure: Gold still maintains a short-term uptrend, the main trend hasn't been broken.
💎 Liquidity: Liquidity is concentrated below the 3940 area – a potential buying OB.
💫 FVG: The 3975–3980 area is a zone where a slight bearish reaction may occur.
⚙️ Order Block (OB): 3938–3945 is a crucial support zone, with the potential for a strong price rebound from here.
📈 Main Target: 4040 – a high liquidity zone, coinciding with a large frame FVG.
🎯 3. Reference Trading Scenarios
💢 Short SELL (scalping)
Entry: 3980 | SL: 3988
TP: 3972 – 3960 – 3940
💖 Main BUY (priority)
Entry: 3940 | SL: 3932
TP: 3952 – 3968 – 3990 – 4012 – 4035
✨ 4. Important Notes
🔹 Observe price reactions at FVG and OB before taking action.
🔹 If the price exceeds 3988, the bearish scenario is temporarily invalidated.
🔹 The main direction is still to buy according to the Smart Money trend – only consider short selling when confirmed.
🌷 5. Conclusion & Interaction with LanaM2
Gold is still following the Smart Money Flow trajectory,
patiently waiting for the price to reach a favorable zone to act 💪
This is not an investment recommendation, just a personal perspective based on the ICT method.
If you find it useful, please 💛 like – 💬 comment – 🔔 follow LanaM2
to stay updated with the latest gold insights every day.

Gold prices fell back during the US session on November 5th.From the 4-hour chart, the current short-term resistance levels to watch are 3965-70 and 4020-55. Short-term support is at 3918-20, with a key support level at the previous low of 3888-90. The strategy is to sell on rallies.
Gold Trading Strategy:
1. Sell gold at 3980-70, add to the short position at 4020-25, stop loss at 4039, target 3940-3930.

GOLD 1H CHART ROUTE MAP UPDATE & TRADING PLAN FOR THE WEEKHey Everyone,
Please see our updated 1h chart levels and targets for the coming week.
We are seeing price play between two weighted levels with a gap above at 4042 and a gap below at 3992. We will need to see ema5 cross and lock on either weighted level to determine the next range.
We will see levels tested side by side until one of the weighted levels break and lock to confirm direction for the next range.
We will keep the above in mind when taking buys from dips. Our updated levels and weighted levels will allow us to track the movement down and then catch bounces up.
We will continue to buy dips using our support levels taking 20 to 40 pips. As stated before each of our level structures give 20 to 40 pip bounces, which is enough for a nice entry and exit. If you back test the levels we shared every week for the past 24 months, you can see how effectively they were used to trade with or against short/mid term swings and trends.
The swing range give bigger bounces then our weighted levels that's the difference between weighted levels and swing ranges.
BULLISH TARGET
4042
EMA5 CROSS AND LOCK ABOVE 4042 WILL OPEN THE FOLLOWING BULLISH TARGETS
4089
EMA5 CROSS AND LOCK ABOVE 4089 WILL OPEN THE FOLLOWING BULLISH TARGET
4136
EMA5 CROSS AND LOCK ABOVE 4136 WILL OPEN THE FOLLOWING BULLISH TARGET
4194
BEARISH TARGETS
3992
EMA5 CROSS AND LOCK BELOW 3992 WILL OPEN THE FOLLOWING BEARISH TARGET
3956
EMA5 CROSS AND LOCK BELOW 3956 WILL OPEN THE FOLLOWING BEARISH TARGET
3922
EMA5 CROSS AND LOCK BELOW 3922 WILL OPEN THE SWING RANGE
3866
3820
As always, we will keep you all updated with regular updates throughout the week and how we manage the active ideas and setups. Thank you all for your likes, comments and follows, we really appreciate it!
Mr Gold
GoldViewFX

Gold Short-Term Technical Analysis Guide (November 4th)!!!Gold is showing a converging pattern on the 1-hour chart, with moving averages clearly intertwined and failing to establish a strong directional trend. Gold is currently facing resistance around the 4000 level and hasn't shown a strong upward breakout. If gold breaks through and holds above 4000, then the 4020-4030 resistance zone should be monitored during the US session. Overall, gold is expected to remain in a range-bound market.
GOLD – When the Market “Whispers” About the Weakness of Buyers1️⃣ Market Structure – When the Bullish Rhythm Slows Down
After a series of CHoCHs and BOSs, the short-term bullish structure has clearly broken. The zone around 4,027 – 4,030 now acts as a Strong High, where smart money likely absorbed most of the buy-side liquidity.
Each retracement has become weaker, forming a sequence of Lower Highs — a classic sign of a distribution phase. The market is currently trading within the premium zone of the current range, where any reaction could be the “last kiss” before a potential drop toward lower demand areas.
2️⃣ Supply & Demand Zones – Footprints of Smart Money
Zooming into price behavior, the Sell Zone 4,010 – 4,015 stands out as a key Bearish Order Block formed after the most recent BOS — a zone Karina is watching closely.
If price retests this area and shows a clear rejection (e.g., bearish engulfing or upper-wick rejection), it could mark the beginning of a smart-money-aligned short setup.
Below, the 3,938 – 3,920 zone remains the untested liquidity pocket — a Weak Low where buy-side positions are likely resting. Smart Money may target this area to complete the distribution cycle before generating a potential accumulation reaction.
3️⃣ Liquidity Context – Silence Often Speaks the Loudest
Above the 4,020 – 4,030 area lies buy-side liquidity — a cluster of stop-loss orders from retail longs. A small liquidity sweep into this region followed by a strong bearish reaction would be a classic SMC pattern: grab liquidity, then move in the true direction.
Once that liquidity is absorbed, price could accelerate toward the 3,938 – 3,920 zone to clear sell-side liquidity, finalizing the redistribution phase.
4️⃣ Trading Scenario – Following the Smart Money Flow
Given the current structure, Karina favors short opportunities if price reacts decisively at the 4,010 – 4,015 zone, confirmed by bearish price action (such as a rejection wick or engulfing pattern).
Entry: 4,012 – 4,015
Stop Loss: 4,030
Take Profit: 3,938 – 3,920
This offers an approximate 1:4 R:R ratio, aligning with a high-probability, structure-based setup. It’s not a trade signal, but rather a perspective — a way to understand how Smart Money moves and leaves its traces.
5️⃣ Conclusion – Patience Is the Quiet Strength of a Trader
The market often speaks through behavior, not noise. Gold is currently in a quiet state — a moment of balance where Smart Money prepares for its next move. For Karina, silence itself can be the strongest signal when you know how to listen.
This analysis reflects Karina’s personal view and is not financial advice.
What do you see in Gold’s current structure? Could this minor push toward 4,015 be the start of a deeper move down? Let’s discuss in the comments 💬.

Gold Awaits Direction Near $4,000 as Fed Comments Limit Upside🔍 Market Context
Gold is trading slightly below the $4,000 mark in early Asian hours, pressured by the Fed’s hawkish tone despite weaker US manufacturing data.
Fed Chair Jerome Powell signaled that another rate cut this year is “not guaranteed”, tempering expectations for further easing.
Meanwhile, ISM Manufacturing PMI slipped to 48.7 in October, below forecast — showing a slowdown, yet not enough to shift the Fed’s cautious stance.
Markets currently price in a 70% chance of a 25 bps cut in December and a total 82 bps by end-2026, reflecting moderate easing expectations rather than a full pivot.
📊 Technical Outlook (H1–H4)
Gold is consolidating around the 3,984–3,985$ area, forming a reaction base above 3,963$ support.
The structure remains within a short-term ascending channel, with the next directional cue likely from the 4,024$ resistance zone.
Key Levels:
• Support 1: 3,963$ – 3,984$ (liquidity defense zone)
• Support 2: 3,923$ (bullish invalidation level)
• Resistance 1: 4,024$
• Resistance 2 / Target: 4,046$
A sustained break above 4,024$ could trigger momentum toward 4,046$, confirming trend continuation.
Conversely, losing 3,963$ would expose 3,923$ as the next liquidity pool before a potential rebound.
🎯 Trading Outlook
Bias remains neutral-to-bullish as long as 3,963$ holds.
If price reacts positively at this zone during the Asian session, short-term buyers may step in toward 4,024$–4,046$.
However, any fresh hawkish comments from Fed officials could cap gains and trigger profit-taking.
⚜️ MMFLOW Insight:
“Liquidity builds where patience fades — smart money waits for the crowd to act first.”

Gold prices dipped and rebounded; watch for 3980.Gold prices traded within a range today, with bullish and bearish forces relatively evenly balanced.
In Asian trading, gold opened lower and quickly dipped, hitting a daily low of $3962 before rebounding. As of pre-market trading, gold is currently trading around $4000. Looking at the hourly chart, the Bollinger Bands are narrowing, and gold is trading below the middle band, exhibiting typical range-bound trading characteristics.
During the US session, watch for resistance at $4030. A break above this level could present a buying opportunity on a pullback, with a target of the $4050 area. If prices fall again, watch for support around $3980. In short, the market remains range-bound; avoid chasing highs or lows.

XAU/USD – Gold Accumulates Before Breakout, Target 4,096 USD🔍 Market Context
Gold is trading within a symmetrical triangle pattern , reflecting short-term accumulation before forming a new breakout wave.
After a sharp decline from the peak of 4,096 USD, the market has shown two instances of Change of Character (ChoCH) – an early sign indicating the return of buying pressure.
As long as the price holds above the 3,959 – 3,917 USD range, the short-term bullish structure remains intact. This support zone serves as a crucial “discount zone” in the current accumulation cycle.
💎 Key Technical Zones
• Support Zone 1: 3,959 USD → main structure holding area, coinciding with the lower trendline.
• Support Zone 2: 3,917 USD → final liquidity reaction zone.
• Resistance Zone: 4,040 USD → potential break & retest area.
• Liquidity Zone: 4,096 USD → expansion target if the peak is broken.
🎯 Trading Scenarios
1️⃣ BUY Setup – Favoring the bullish structure
• Entry: 3,959 – 3,917 USD
• Stop Loss: 3,905 USD
• Take Profit:
– TP1: 3,985
– TP2: 4,040
– TP3: 4,072
– TP4: 4,096
✳️ “Buy the discount” – prioritize buying orders at the confluence support zone of trendline + FVG to follow the SMC flow.
2️⃣ SELL Scalp – Secondary strategy when price reacts at the peak
• Entry: 4,096 USD
• Stop Loss: 4,108 USD
• Take Profit:
– TP1: 4,072
– TP2: 4,040
– TP3: 3,985
✳️ “Sell the premium” – only activate if there is a strong price rejection signal at the liquidity peak.
💬 Conclusion
The short-term trend of gold remains bullish as the price stays above the trendline and continuously forms higher lows.
The main strategy is buy the dip – sell reaction around the 3,959 → 4,096 USD range.
The confirmation point for a strong bullish trend will be when the price closes steadily above 4,040 USD .
“Smart money accumulates in silence before the market makes noise.”
⏰ Timeframe: 1H
📅 Update: 03/11/2025
✍️ Analysis by: Captain Vincent

Gold prices fluctuated upwards on November 3rd, but bulls faced From the 4-hour chart, the current resistance level to watch is 4030-35, with a key resistance level at 4047-55. The short-term support level is 3965-70. The recommended strategy is to primarily sell on rallies, avoiding chasing the market and patiently waiting for key entry points. Specific trading strategies will be provided during trading hours; please pay close attention.
Gold Trading Strategy:
1. Sell gold on rallies to 4030-35, add to the short position on rallies to 4047-55, stop loss at 4069, target 3960-3965, hold if it breaks through.

Gold Intraday Short-Term Analysis and Trading Strategies (NovembGold is currently oscillating between the 61.8% and 78.6% Fibonacci retracement levels (3945-4136), but trading volume remains weak. A further rise followed by a fall back to the 50% Fibonacci retracement level of 3811 cannot be ruled out. Stronger support lies nearby, at the 89-day moving average of 3753. This means the short-term correction is not yet over. Today, the key resistance level to watch is 4060-70, with a smaller resistance level at 4020.
Intraday Short-Term Trading Strategy:
Primarily sell on rallies, with buying on dips as a secondary strategy. Support levels to watch are 3979, 3936, and 3882.
LiamTrading - $XAUUSD$: Second Scenario – BUY Priority After...LiamTrading - OANDA:XAUUSD $: Second Scenario – BUY Priority After BREAKING $4002$
With Support from the U.S. Treasury Secretary
Hello traders community, LiamTrading is back with a detailed analysis of OANDA:XAUUSD $ for the start of the week!
The Gold market is receiving strong support from policy: U.S. Treasury Secretary Scott Bessent calls on the Fed to continue cutting interest rates as PCE inflation is currently at $2.7\%$.
This call, aimed at reducing mortgage rates and supporting the housing market, strengthens the long-term outlook for Gold.
Technical Analysis: We prioritize continuing to buy in line with the main trend. The best strategy is to enter at strong resistance/support zones to ensure the lowest risk.1.
📰 MACRO FUNDAMENTALS: CALL FOR RATE CUT
Impact: The Treasury Secretary's statement on cutting interest rates to support the "transitioning" economy increases expectations for policy easing, which is a strong support factor for Gold (though not yet an official decision).
Suitable Strategy: Market sentiment is being driven by expectations of policy easing, reinforcing the priority for a BUY (Long) position.
📊 TECHNICAL ANALYSIS: IMPORTANT PIVOT POINT
Resistance Zone $4002$: This area acts as an important pivot point.
Buy Entry will be activated after the price breaks $4002$ and retests.
Sell Entry: Look for short-term scalping at the resistance zone $4030$ to secure profits. Highlighted Zone: Prioritize entries at confirmed Trendline zones.
🎯 DETAILED TRADING PLAN (ACTION PLAN)
We will wait for Gold to break structure and create a BUY setup.
🟢 Main BUY Scenario (BUY Break & Retest)
Logic: Buy at $4002$ after breaking resistance and retesting, leveraging new upward momentum.
Entry (BUY): $4002$
SL: $3995$ (tight SL)
TP1/TP2: $4020$ | $4035$
TP3: $4070$
🔴 SCALPING SELL Scenario (SELL Scalping)
Logic: Short-term scalping at the strong resistance zone $4030$ (near Sell Liquidity zone).
Entry (SELL): $4030$
SL: $4038$
TP1/TP2: $4015$ | $4004$
TP3: $3990$4.
📌 SUMMARY & DISCIPLINE (Liam's Note)
Our BUY strategy is reinforced by policy outlook and technical breakout at $4002$. Strictly adhere to SL $3995$ to manage risk before the upward structure is confirmed.
Are you ready for Gold's movement at $4002$? Please LIKE and COMMENT!

LiamTrading - $XAUUSD$: NEW WEEK TRADING SCENARIO...LiamTrading - OANDA:XAUUSD $: NEW WEEK TRADING SCENARIO – PRIORITIZE SELLING After BREAKING THE TRENDLINE
Hello traders community,
The new week opens with a clear strategy: Prioritize SELLING after Gold has broken the previous upward trendline.
Although fundamental economic news (such as interest rate policies and politics) supports Gold potentially reaching $5,000$ USD, we must trade according to
current Price Action. Technical selling pressure is strong. We will SELL at key resistance areas and continue SELLING when the price breaks the downward structure.
📰 FUNDAMENTALS & LONG-TERM OUTLOOK
Prospect of $5,000$: Fundamental and political factors still support the scenario of Gold reaching $5,000$ USD in the long term (due to geopolitical risks and the potential loss of Fed's independence).
Short Term 🔴: Gold is under technical selling pressure after breaking through the $4,000$ USD mark.
📊 TECHNICAL ANALYSIS: BREAKING THE TRENDLINE
Structure: Gold has exited the upward price channel and is retesting the broken trendline.
Priority: SELL at the retest resistance area of $4024$.
🎯 DETAILED TRADING PLAN (ACTION PLAN)
🔴 SELL Scenario (SELL Primary) - Preemptive Resistance
Entry 1: $4024$ (Sell retest trendline area)
SL: $4032$
TP1/TP2: $4012$ | $4000$
TP3: $3989$
Entry 2 (Continued SELL): When the price breaks the next trendline at $3992$
SL: $4000$
TP: $3940$
🟢 BUY Scenario (BUY Reversal) - Buy at Strong Support
Logic: Only buy when the price hits a strong liquidity support area, potential for short-term recovery.
Entry (BUY): Around $3960$ (Buy Scalping area)
SL: $3954$
TP1/TP2: $3972$ | $3988 FWB:TP3 : $4000$
📌 SUMMARY & DISCIPLINE (Liam's Note) Don't let the $5,000$ USD prospect affect short-term risk management. Trade according to Price Action. Adhere to SL and prioritize SELL positions at resistance areas.
Are you ready for the SELL strategy at the start of this week?

XAUUSD Analysis todayHello traders, this is a complete multiple timeframe analysis of this pair. We see could find significant trading opportunities as per analysis upon price action confirmation we may take this trade. Smash the like button if you find value in this analysis and drop a comment if you have any questions or let me know which pair to cover in my next analysis.

GOLD 4H CHART ROUTE MAP UPDATE & TRADING PLAN FOR THE WEEKHey Everyone,
Please see our updated 4h chart levels and targets for the coming week.
We are seeing price play between two weighted levels with a gap above at 4079 and a gap below at 3985. We will need to see ema5 cross and lock on either weighted level to determine the next range.
We will see levels tested side by side until one of the weighted levels break and lock to confirm direction for the next range.
We will keep the above in mind when taking buys from dips. Our updated levels and weighted levels will allow us to track the movement down and then catch bounces up.
We will continue to buy dips using our support levels taking 20 to 40 pips. As stated before each of our level structures give 20 to 40 pip bounces, which is enough for a nice entry and exit. If you back test the levels we shared every week for the past 24 months, you can see how effectively they were used to trade with or against short/mid term swings and trends.
The swing range give bigger bounces then our weighted levels that's the difference between weighted levels and swing ranges.
BULLISH TARGET
4079
EMA5 CROSS AND LOCK ABOVE 4079 WILL OPEN THE FOLLOWING BULLISH TARGETS
4173
EMA5 CROSS AND LOCK ABOVE 4173 WILL OPEN THE FOLLOWING BULLISH TARGET
4264
EMA5 CROSS AND LOCK ABOVE 4264 WILL OPEN THE FOLLOWING BULLISH TARGET
4340
EMA5 CROSS AND LOCK ABOVE 4340 WILL OPEN THE FOLLOWING BULLISH TARGET
4422
EMA5 CROSS AND LOCK ABOVE 4422 WILL OPEN THE FOLLOWING BULLISH TARGET
4494
BEARISH TARGETS
3985
EMA5 CROSS AND LOCK BELOW 3985 WILL OPEN THE FOLLOWING BEARISH TARGET
3873
EMA5 CROSS AND LOCK BELOW 3873 WILL OPEN THE SWING RANGE
3741
3632
As always, we will keep you all updated with regular updates throughout the week and how we manage the active ideas and setups. Thank you all for your likes, comments and follows, we really appreciate it!
Mr Gold
GoldViewFX

GOLD (XAUUSD): Support & Resistance Analysis for Next Week
Here is my structure analysis for Gold for next week.
Support 1: 3868 - 3927 area
Support 2: 3766 - 3830 area
Support 3: 3690 - 3736 area
Resistance 1: 4023 - 4109 area
Resistance 2: 4187 - 4245 area
Resistance 3: 4357 - 4383 area
Consider these structures for pullback/breakout trading.
❤️Please, support my work with like, thank you!❤️
I am part of Trade Nation's Influencer program and receive a monthly fee for using their TradingView charts in my analysis.

October 31st Gold Intraday Short-Term Trading Guide!!!Gold prices retreated from around 4044-46 during the day, hitting a low of 3988 in the morning. Currently, it's oscillating within the 4000-4126 range. Today is the weekly and monthly close, potentially triggering a significant price movement. From a trend perspective, short-term gains remain limited. A further dip to 4000 is possible amidst the consolidation. A break below 3986/3960 could lead to a move towards 3920-3900. The recommended strategy is to sell on rallies, but be aware of the risks.
US Session Trading Strategy:
Sell near 40120-25, stop loss at 4035, target 4000-3990, continue to look for further downside if the price breaks through.
GOLD 1H CHART ROUTE MAP UPDATE & TRADING PLAN FOR THE WEEKHey Everyone,
Please see our updated 1h chart levels and targets for the coming week.
We are seeing price play between two weighted levels with a gap above at 4134 and a gap below at 4090. We will need to see ema5 cross and lock on either weighted level to determine the next range.
We will see levels tested side by side until one of the weighted levels break and lock to confirm direction for the next range.
We will keep the above in mind when taking buys from dips. Our updated levels and weighted levels will allow us to track the movement down and then catch bounces up.
We will continue to buy dips using our support levels taking 20 to 40 pips. As stated before each of our level structures give 20 to 40 pip bounces, which is enough for a nice entry and exit. If you back test the levels we shared every week for the past 24 months, you can see how effectively they were used to trade with or against short/mid term swings and trends.
The swing range give bigger bounces then our weighted levels that's the difference between weighted levels and swing ranges.
BULLISH TARGET
4134
EMA5 CROSS AND LOCK ABOVE 4134 WILL OPEN THE FOLLOWING BULLISH TARGETS
4174
EMA5 CROSS AND LOCK ABOVE 4174 WILL OPEN THE FOLLOWING BULLISH TARGET
4236
EMA5 CROSS AND LOCK ABOVE 4236 WILL OPEN THE FOLLOWING BULLISH TARGET
4288
EMA5 CROSS AND LOCK ABOVE 4288 WILL OPEN THE FOLLOWING BULLISH TARGET
4331
EMA5 CROSS AND LOCK ABOVE 4331 WILL OPEN THE FOLLOWING BULLISH TARGET
4360
BEARISH TARGETS
4090
EMA5 CROSS AND LOCK BELOW 4090 WILL OPEN THE FOLLOWING BEARISH TARGET
4042
EMA5 CROSS AND LOCK BELOW 4042 WILL OPEN THE SWING RANGE
4122
4075
EMA5 CROSS AND LOCK BELOW 4075 WILL OPEN THE SECONDAARY SWING RANGE
3987
3939
As always, we will keep you all updated with regular updates throughout the week and how we manage the active ideas and setups. Thank you all for your likes, comments and follows, we really appreciate it!
Mr Gold
GoldViewFX

GOLD (XAUUSD): Another Pullback Trade
Gold is testing a major daily resistance that we spotted earlier again today.
It looks like the price may retrace from that one more time.
A bearish breakout of a support line of a rising channel is my
intraday confirmation.
Goal - 3989
❤️Please, support my work with like, thank you!❤️
I am part of Trade Nation's Influencer program and receive a monthly fee for using their TradingView charts in my analysis.

LiamTrading - XAUUSD: Prospect of $5,000 USD and Priority BUY...LiamTrading - XAUUSD: Prospect of $5,000 USD and Priority BUY Strategy at POC $3973
Hello traders community,
Gold is positioned between an extremely optimistic long-term outlook (forecast of $5,000 USD in the next 12-18 months by Bank of America) and short-term technical adjustments.
Although Gold has broken the upward trendline, a sustainable downward trend has not been confirmed.
BUY positions are still prioritized!
🔥 LONG-TERM CONTEXT & INFLATION
Long-Term Driver: Gold prices adjusted for inflation have DOUBLED over the past 4 years.
Highlight: Gold reinforces its role as an anti-inflation asset as real prices soar to all-time highs.
📊 DETAILED TRADING PLAN (ACTION PLAN)
Strategy: Buy at POC Zone to leverage liquidity advantage.
🟢 BUY Scenario (BUY Primary) - Buy at High Value Zone
Logic: The $3973 - 3975$ zone is right above the Buy POC (highest value zone).
Entry (BUY): $3973 - 3975$
SL: $3968$
TP1: $3988$ | TP2: $4000
Buy Target 2: Buy when price retests the trendline around $4002$.
🔴 SELL Scenario (SELL Scalping) - Preemptive strike at resistance zone
Entry (SELL): $4032 - 4034$
SL: $4040$
TP1: $4022$ | TP2: $4015
📌 SUMMARY & DISCIPLINE (Liam's Note)With the $5,000 USD forecast and inflation factors, the risk of SELL is increasing.
Focus on BUY at POC $3973$ and absolute SL.
Trade responsibly and with discipline!

XAU/USD – Gold Maintains Short-Term Uptrend, Target $4,108🔍 Market Context
Gold continues to uphold a short-term bullish structure after forming a clear Change of Character (ChoCH) around the 3,926 USD area.
Buyers are in control as prices consistently create higher lows and react positively at the Order Block + Support Trendline zone.
As long as prices remain above the 3,940–3,926 USD range, the bullish structure is preserved.
💎 Key Technical Zones
• Order Block Bullish: 3,926 USD → main support zone, confluence with rising trendline.
• Fair Value Gap (FVG): 3,942 – 3,972 USD → potential liquidity absorption zone.
• Resistance Zone: 4,032 USD → short-term barrier, needs to break to confirm continued upward momentum.
• Liquidity Zone: 4,108 USD → extended target if the above resistance is breached.
🎯 Trading Scenarios
1️⃣ BUY Setup – Prioritize catching the retracement from the support zone
• Entry: 3,942 – 3,926 USD
• Stop Loss: 3,910 USD
• Take Profit:
– TP1: 3,972
– TP2: 4,032
– TP3: 4,064
– TP4: 4,108
✳️ “Buy the discount” – Prioritize entries at the confluence of OB + FVG to follow Smart Money flow.
2️⃣ SELL Scalp – Short-term at resistance zone
• Entry: 4,032 – 4,048 USD
• Stop Loss: 4,060 USD
• Take Profit:
– TP1: 4,010
– TP2: 3,972
– TP3: 3,942
✳️ “Sell the premium” – Only activate if a clear price rejection signal appears at resistance.
💬 Summary
The current structure remains bullish short-term with the 3,926 USD area as the key invalidation zone .
As long as prices stay above the trendline, the immediate target is the 4,108 USD liquidity zone.
Optimal strategy: Buy on dip – Sell on reaction.
💡 Today's Tagline:
“Smart Money buys fear, sells greed — follow the footprints, not the noise.”
⏰ Timeframe: 1H
📅 Update: 31/10/2025
✍️ Analysis by: Captain Vincent
