GOLD DAILY CHART ROUTE MAP UPDATEHey everyone,
Check out our updated Daily Chart Route Map, now featuring updated levels for tracking Golds movement.
We’ve refined our proprietary Goldturn Channel, our unique method for constructing ascending channels. Price action recently broke out above the channel, with a body close above 4325, leaving a long-term gap open near 4444.
Currently, we’re observing rejection at 4325, and our channel top is now acting as support. The market is range-bound between 4325 (resistance) and 4183 (channel top as support). A decisive break above or below either of these levels will help define the next directional move, keeping in mind the open gap overhead at 4444.
On the downside, 3961 remains the pivotal swing zone, aligning with the channel midline, should we see a confirmed break below 4183.
As always, we will keep you all updated with regular updates throughout the week and how we manage the active ideas and setups. Thank you all for your likes, comments and follows, we really appreciate it!
Mr Gold
GoldViewFX
Goldtrading

Gold goes on a roller coaster ride. Continue to short below 4100Looking back at the price of gold since the beginning of the year, it has risen by over 50%, with an increase of over 25% in just two months. Those who bought in early on have made a killing, and at the first sign of trouble, they naturally want to sell to lock in profits. This concentrated sell-off can easily trigger panic. Leveraged margin calls exacerbate volatility: The recent surge has attracted many investors to leverage their positions. If prices fall rapidly, these leveraged positions will be forced to close, amplifying the decline like dominoes.
Returning to the one-hour gold chart, US gold will continue to fluctuate between 4100 and 4020. The current trend is volatile and weak, so adopt a high-sell strategy! Go short on a dip to 4080, with an eye on the 4000 area below!
Specific Strategy
Sell gold below 4100, stop loss at 4110, target 4000.

10.22 Gold rebounds and continues to be shortGold's 4-hour moving average has formed a death cross, signaling a downward bearish trend. Gold still has downward momentum. Despite today's rebound in the US market, it continued to decline rapidly. This suggests the bullish rally is weakening. Gold rebounded to around 4085 before turning downward. While gold remains under pressure at 4085, it's still a good time to continue shorting.
Gold has formed a short-term bearish double top, and the bullish rebound has failed to re-stabilize the neckline of the double top. Gold remains a bearish market, and rebounds continue to offer opportunities for short sellers.

Gold 1979 vs 2025 — When History Whispers and Markets Listen
🌕 1. The Echo of 1979
In 1979, the world watched Gold do the impossible. The metal surged from $226 to over $850 per ounce in less than a year, a 275% explosion that turned fear into fortune.
The triggers were seismic.
🇮🇷 The Iranian Revolution disrupted global oil flows.
🏛️ The U.S. Embassy hostage crisis fueled geopolitical panic.
⚔️ The Soviet invasion of Afghanistan reignited Cold War fears.
💸 And double-digit inflation in the U.S. shredded faith in the dollar.
By early 1980, panic replaced logic. Every newspaper screamed, “Buy Gold before it’s too late!” Then came Paul Volcker’s shock therapy as interest rates jumped above 15% and COMEX doubled margin requirements. Within eight weeks, Gold fell more than 40%, marking the end of one of the most dramatic speculative manias in modern history.
🔁 2. Fast-Forward to 2025: The Parallels Are Uncanny
The world of 2025 looks hauntingly similar.
🕰️ 1979 🔮 2025
Iranian Revolution and Cold War tensions Gaza war, U.S.–China decoupling, and regional instability
Oil shock and inflation Energy disruptions and persistent post-pandemic inflation
Dollar under pressure Record U.S. debt and fiscal erosion
Panic buying of Gold Central bank accumulation and retail FOMO
Fed under Volcker turns hawkish Fed under Powell trapped between cuts and control
By late August 2025, gold sat quietly near $3,415, then erupted into a seven-week vertical rally above $4,300, a mirror image of 1979’s euphoric climb. But just like back then, euphoria was the prelude to exhaustion.
⚠️ 3. The Anatomy of the Current Crash
On October 17, 2025, Gold plunged $250 in one day, a shocking 5–6% drop that broke its parabolic structure and sent fear rippling across markets.
What triggered it?
🏦 A hawkish shift in the Federal Reserve’s language as officials hinted rate cuts might be delayed.
💰 Real yields surged, breaking the inverse correlation that had fueled gold’s climb.
🏛️ Institutional profit-taking hit record levels, confirmed by rising COMEX open interest and volume.
🗞️ Sentiment flipped overnight as headlines shifted from “Gold to $5000” to “Gold crashes $250.”
The move marked the first true break of structure (CHoCH) since the rally began, historically the signal that smart money is quietly exiting.
🔍 4. Lessons from 1980 — The Signs of a Top
Before gold crashed in 1980, five clear warning signs appeared.
⚙️ 1979–1980 Signal 💡 2025 Equivalent 🧭 Status
Fed turns hawkish Powell signals “pause / higher for longer” ⚠️ Emerging
Rising bond yields vs. flat Gold Real yield divergence ✅ Confirmed
Parabolic candles Daily range above $100 ✅ Seen
Media frenzy “Gold to $5000” hype ✅ Seen
Margin hikes and record OI Record COMEX participation ⚠️ Rising
Four out of five signals are already flashing. History teaches that when everyone believes Gold can only rise, it’s often about to fall.
🧭 5. What Smart Traders Should Do Now
🟡 Phase 1 – Immediate Protection (Next 24 Hours)
If you’re long, secure 50–75% of gains and protect above $3,950.
If you’re short, trail stops to $4,200 and look for targets at $3,950 → $3,800 → $3,600.
If you’re flat, stay patient and wait for at least two daily candles of stabilization before acting.
🟠 Phase 2 – Stabilization (Next 3–5 Days)
Watch for:
🕯️ Long lower wicks on daily candles show buyer absorption.
📉 Shrinking COMEX volume indicates exhaustion of sellers.
📊 Flat or falling real yields confirming support.
🔵 Phase 3 – Re-evaluation (Next 1–2 Weeks)
If gold reclaims $4,000+ with strength and Fed tone softens, a controlled re-rally may begin. If Gold stays below $3,800, the correction likely extends toward $3,500, the same 30–40% retracement seen in 1980.
🧘♀️ 6. Beyond the Chart — Discipline Over Drama
When a $250 candle appears, instincts scream, “Do something!” But professionals know the truth: reaction destroys capital, observation preserves it. The coming days are not about prediction but about posture. Stay liquid, track sentiment, watch real yields, and remember that even in 1980, Gold’s crash didn’t end its story — it simply reset the cycle for the next era of accumulation.
✨ History doesn’t repeat, but it rhymes. In 1979, Gold taught us that fear creates bubbles. In 2025, it’s reminding us that even truth needs a pullback before it shines again.
If this article helped you today and brought you more clarity:
Drop a 🚀 and follow us✅ for more trading ideas and trading psychology. Thank you.

GOLD (XAUUSD): Important Supports to Watch
As Gold continues an extended correction,
here are significant supports to watch.
Horizontal Structures
Support 1: 4040 - 4060 area
Support 2: 3942 - 3959 area
Support 3: 3870 - 3897 area
Support 4: 3766 - 3831 area
Support 5: 3691 - 3735 area
Vertical Structures
Vertical Support 1: Rising trend line
A trend line and horizontal Support 1 compose a demand zone.
That will be the first potentially significant zone for a pullback.
In case of its breakout, the price will reach at least Support 2 then.
❤️Please, support my work with like, thank you!❤️
I am part of Trade Nation's Influencer program and receive a monthly fee for using their TradingView charts in my analysis.

XAUUSD – Sharp 5% Drop as Traders Take Profit Ahead of US CPIMarket Context:
Gold (XAU/USD) slumped over 5.5% on Tuesday, marking its largest daily decline in months as traders took profits ahead of the upcoming US CPI data (October 24).
The US Dollar Index (DXY) rebounded 0.36% to 98.94, making gold more expensive for foreign buyers.
This correction also coincides with renewed optimism over potential easing of US–China trade tensions, after President Trump confirmed plans to meet Chinese leader Xi Jinping next week.
While this sharp move caught many traders off guard, it appears to be a healthy correction within a broader bullish structure, as investors remain cautious before major data and the upcoming Fed policy meeting next week.
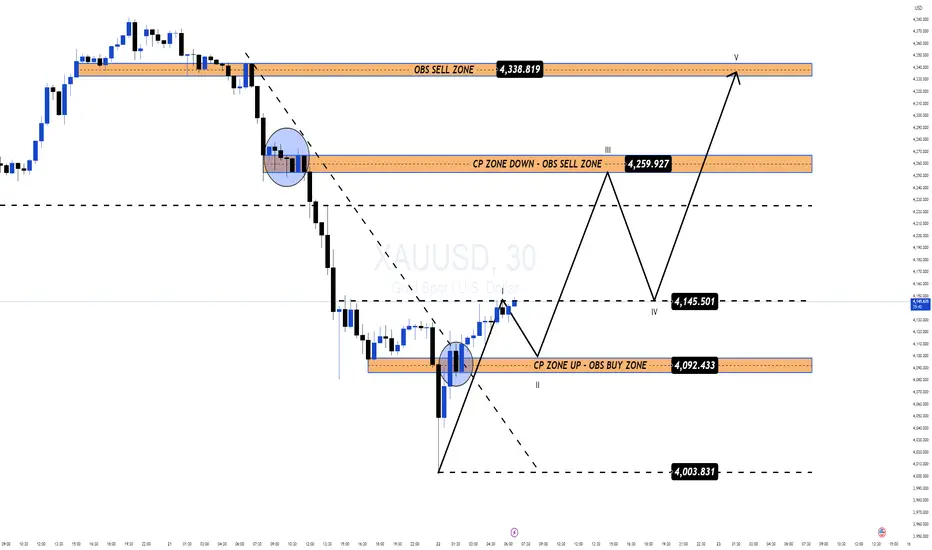
Technical Outlook (M30):
After the heavy selloff from the 4,375 high, gold found near-term support around 4,003 – 4,010, forming a potential accumulation base.
The pair now trades near 4,150, showing early signs of recovery toward key confluence zones.
Key Technical Levels:
OBS Sell Zone: 4,338 – 4,340
CP Zone Down / OBS Sell Zone: 4,259 – 4,260
CP Zone Up / OBS Buy Zone: 4,092 – 4,094
Deep Buy Zone: 4,003 – 4,008
The current structure outlines a 5-wave projection, where price may complete Wave II near 4,092, then advance toward Wave III at 4,259, followed by a correction (Wave IV) and another push toward Wave V near 4,338.
Trading Plan:
🔹 BUY ZONE#1 (Short-Term Recovery)
Entry: 4,092 – 4,094
Stop Loss: 4,080
Take Profit: 4,145 → 4,259 → 4,338
🔹 BUY ZONE #2 (Liquidity Sweep Scenario)
Entry: 4,003 – 4,008
Stop Loss: 3,990
Take Profit: 4,090 → 4,259
🔹 SELL ZONE (Countertrend Reaction)
Entry: 4,259 – 4,260
Stop Loss: 4,272
Take Profit: 4,145 → 4,092
Summary:
The recent 5% correction is viewed as a profit-taking phase ahead of CPI data, not a structural breakdown.
Gold is expected to stabilise above 4,092, with buyers likely stepping in near the OBS Buy Zone.
Focus remains on 4,259 for a short-term reaction and 4,338 as the next potential liquidity target if momentum continues.
📊 What’s your view — is this just a healthy retracement before CPI, or the start of a deeper shift?
👉 Follow MMFLOW TRADING for daily institutional-grade setups and smart money structure updates.

XAUUSD – Sharp 5% Drop as Traders Take Profit Ahead of US CPIMarket Context:
Gold (XAU/USD) slumped over 5.5% on Tuesday, marking its largest daily decline in months as traders took profits ahead of the upcoming US CPI data (October 24).
The US Dollar Index (DXY) rebounded 0.36% to 98.94, making gold more expensive for foreign buyers.
This correction also coincides with renewed optimism over potential easing of US–China trade tensions, after President Trump confirmed plans to meet Chinese leader Xi Jinping next week.
While this sharp move caught many traders off guard, it appears to be a healthy correction within a broader bullish structure, as investors remain cautious before major data and the upcoming Fed policy meeting next week.
Technical Outlook (M30):
After the heavy selloff from the 4,375 high, gold found near-term support around 4,003 – 4,010, forming a potential accumulation base.
The pair now trades near 4,150, showing early signs of recovery toward key confluence zones.
Key Technical Levels:
OBS Sell Zone: 4,338 – 4,340
CP Zone Down / OBS Sell Zone: 4,259 – 4,260
CP Zone Up / OBS Buy Zone: 4,092 – 4,094
Deep Buy Zone: 4,003 – 4,008
The current structure outlines a 5-wave projection, where price may complete Wave II near 4,092, then advance toward Wave III at 4,259, followed by a correction (Wave IV) and another push toward Wave V near 4,338.
Trading Plan:
🔹 BUY ZONE#1 (Short-Term Recovery)
Entry: 4,092 – 4,094
Stop Loss: 4,080
Take Profit: 4,145 → 4,259 → 4,338
🔹 BUY ZONE #2 (Liquidity Sweep Scenario)
Entry: 4,003 – 4,008
Stop Loss: 3,990
Take Profit: 4,090 → 4,259
🔹 SELL ZONE (Countertrend Reaction)
Entry: 4,259 – 4,260
Stop Loss: 4,272
Take Profit: 4,145 → 4,092
Summary:
The recent 5% correction is viewed as a profit-taking phase ahead of CPI data, not a structural breakdown.
Gold is expected to stabilise above 4,092, with buyers likely stepping in near the OBS Buy Zone.
Focus remains on 4,259 for a short-term reaction and 4,338 as the next potential liquidity target if momentum continues.
📊 What’s your view — is this just a healthy retracement before CPI, or the start of a deeper shift?
👉 Follow MMFLOW TRADING for daily institutional-grade setups and smart money structure updates.
Gold mania ends in a $4000 reality check? Thousands queuing for hours in central Sydney to buy gold last week was a potential warning sign that gold was vulnerable to correction.
Today, gold prices saw their largest one-day fall in over ten years. After several failed attempts to break above 4,400, resistance held and momentum reversed sharply.
The first key support now potentially sits near 4,000 (200% retracement).
Despite the correction, long-term outlooks might remain positive. Ongoing inflation risk, lower interest rates, geopolitical tensions, and U.S. government dysfunction are still ever present. This might be why Goldman Sachs raised its December 2026 price target to 4,900 per ounce, up from 4,300, citing
Silver also slumped more than 7%, marking their biggest daily loss since 2021, as overbought signals flashed extremes.

GOLD 1H CHART ROUTE MAP UPDATE & TRADING PLAN FOR THE WEEKHey Everyone,
Please see our updated 1h chart levels and targets for the coming week.
We are seeing price play between two weighted levels with a gap above at 4275 and a gap below at 4229. We will need to see ema5 cross and lock on either weighted level to determine the next range.
We will see levels tested side by side until one of the weighted levels break and lock to confirm direction for the next range.
We will keep the above in mind when taking buys from dips. Our updated levels and weighted levels will allow us to track the movement down and then catch bounces up.
We will continue to buy dips using our support levels taking 20 to 40 pips. As stated before each of our level structures give 20 to 40 pip bounces, which is enough for a nice entry and exit. If you back test the levels we shared every week for the past 24 months, you can see how effectively they were used to trade with or against short/mid term swings and trends.
The swing range give bigger bounces then our weighted levels that's the difference between weighted levels and swing ranges.
BULLISH TARGET
275
EMA5 CROSS AND LOCK ABOVE 4275 WILL OPEN THE FOLLOWING BULLISH TARGETS
4320
EMA5 CROSS AND LOCK ABOVE 4320 WILL OPEN THE FOLLOWING BULLISH TARGET
4360
BEARISH TARGETS
4229
EMA5 CROSS AND LOCK BELOW 4229 WILL OPEN THE FOLLOWING BEARISH TARGET
4194
EMA5 CROSS AND LOCK BELOW 4194 WILL OPEN THE FOLLOWING BEARISH TARGET
4151
EMA5 CROSS AND LOCK BELOW 4151 WILL OPEN THE SWING RANGE
4122
4075
EMA5 CROSS AND LOCK BELOW 4075 WILL OPEN THE SECONDAARY SWING RANGE
4022
3955
As always, we will keep you all updated with regular updates throughout the week and how we manage the active ideas and setups. Thank you all for your likes, comments and follows, we really appreciate it!
Mr Gold
GoldViewFX

XAUUSDHello Traders! 👋
What are your thoughts on GOLD?
Gold has seen a sharp and powerful rally over the past few weeks and continues to trade in a bullish structure.
From a fundamental perspective, there are still no major signs of weakness, as macro factors continue to support gold’s long-term uptrend.
However, from a technical standpoint, a short-term correction appears increasingly likely.
On the 4-hour chart, gold has recently broken its ascending trendline and is now trading below a key resistance zone.
If price pulls back to retest the broken trendline and then breaks below the 4180 support level, we could see a deeper move toward the next support zone.
Volatility in gold has been extremely high in recent days, with sharp intraday swings.
It’s advisable to avoid aggressive entries at the moment and wait for clearer confirmation signals before taking new positions.
Don’t forget to like and share your thoughts in the comments! ❤️

Gold Holding Gains Ahead of Key US CPI DataGold extends its bullish momentum in early Asian trading, hovering near $4,370, supported by rate-cut expectations from the Fed and ongoing US government shutdown concerns, which continue to pressure the USD.
According to CME FedWatch, markets are now pricing in a 99% probability of another rate cut next week — a strong catalyst for gold bulls.
Lower interest rates reduce the opportunity cost of holding non-yielding assets like gold, reinforcing the medium-term uptrend.
However, all eyes are on the US September CPI report due later this week.
A hotter-than-expected reading could temporarily lift the USD and trigger short-term volatility in gold prices.
🔍 MMFlow Technical Outlook
Gold is currently consolidating around the $4,320–$4,370 range after reaching the ATH zone.
Price action shows a clear liquidity sweep at the highs, followed by a minor retracement — still within the bullish structure.
The main trendline remains intact, suggesting that any dip toward $4,305–$4,260 may attract new buyers.
⚙️ Trading Plan (MMFlow View)
BUY SCALP Setup
Entry: 4,302 – 4,300 (½ volume)
Stop Loss: 4,292
Take Profit: 4,310 → 4,315 → 4,320 → 4,330 → 4,340 → 4,350+
BUY ZONE (Swing)
Entry: 4,260 – 4,258
Stop Loss: 4,252
Take Profit: 4,265 → 4,270 → 4,280 → 4,290 → 4,300+
📈 Buy setups remain favored as long as price holds above 4,260.
Intraday sell reactions near 4,360–4,378 are short-term only — watch for liquidity grabs and bullish re-entry opportunities.
⚡️ Key MMFlow Zones
CP Down Zone / OBS Sell Zone: 4,360
ATH Liquidity Sell Zone: 4,448
Retest Trendline / OBS Buy Zone: 4,305
End FVG Uptrend / OBS Buy Zone: 4,260
Sentiment: 🟢 Bullish Bias
Bias Confirmation: CPI Data & Fed Rate Expectations
Strategy: Buy-the-Dip → Target Liquidity Above 4,370–4,380
🔥 Stay patient — let liquidity drive the next leg. MMFlow tracks smart money zones, not emotions.

GOLD|When the market loses balance, dominance leaves a footprint🔍 Market Context
After establishing a short-term peak in the 4,385 – 4,372 USD range, gold has entered a phase of strong technical correction , with consecutive red candles breaking the short-term upward structure.
The sellers temporarily dominate, pushing the price through the H1 upward trendline. However, the support zone below (Liquidity Zone + Order Block Bullish) is beginning to show absorption force, indicating the possibility that buyers might return at discounted price levels.
💎 Technical Analysis
Previous Bullish BoS: confirms the main trend is still long-term bullish .
FVG Down Zone: 4,285 – 4,260 USD → an unfilled price balance area during the decline, potentially a place for price to retrace to “fill the gap” before choosing a direction.
Liquidity Zone $$$: 4,222 – 4,218 USD → a short-term support area where new buying liquidity appears.
Order Block Bullish: 4,203 – 4,185 USD → a confluence area between OB and Fibo 0.786, where large capital might return.
Deep Bullish OB: 4,142 – 4,128 USD → the final defense zone for the main upward trend.
Order Block Bearish: 4,372 – 4,385 USD → a critical resistance area, likely to react if the price retraces.
The current structure shows gold is in a retracement – liquidity rebalancing phase, lacking sufficient signals to reverse the trend.
📈 Trading Scenarios
1️⃣ Main Scenario – Buy reaction at Liquidity Zone 4,222 – 4,203 USD
Entry: 4,222 – 4,203
SL: 4,185
TP: 4,260 → 4,318 → 4,372
✅ Condition: Strong rejection candles (rejection / engulfing bullish) appear at the support zone or small reversal BoS.
➡️ This is a “buy the dip” setup following the main trend, leveraging the liquidity zone and confluence OB.
2️⃣ Secondary Scenario – Sell reaction at FVG Down 4,285 – 4,260 USD
Entry: 4,260 – 4,285
SL: 4,300
TP: 4,222 → 4,203
✅ Condition: Strong bearish candles or rejection signals appear at the FVG zone.
➡️ This setup is for scalping traders or short-term shorts in the unfilled price balance area.
⚠️ Risk Management
Do not FOMO buy when the price has not confirmed the 4,222 zone.
If the price breaks below 4,185 → wait for a re-test to continue selling towards the 4,128 zone.
Maintain moderate volume, as the market is in a rebalancing phase – liquidity is still noisy.
💬 Conclusion
Gold is in a transitional phase after a strong decline .
The 4,222 – 4,203 USD zone will be key to determining whether the medium-term upward trend continues.
If this zone holds, gold is likely to retest the 4,318 – 4,372 USD range.
👉 Reasonable Strategy:
Buy reaction at 4,222 – 4,203 USD when confirmed.
Sell technically at FVG 4,260 – 4,285 USD if clear rejection appears.
🔥 “When the market loses balance, the strongest side will leave a trace – and this time the trace lies around the 4,220 USD zone.”

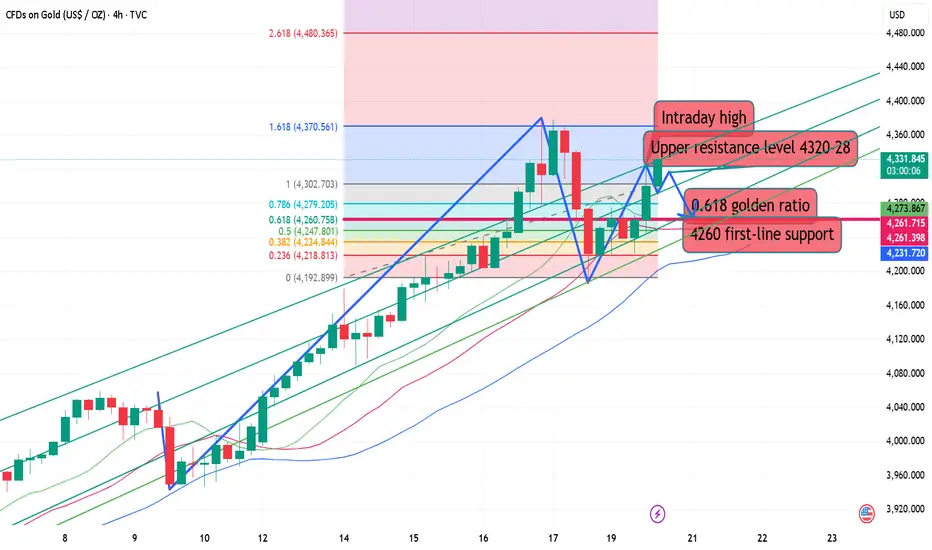
10.20 Gold breaks out of volatility and accelerates its riseThe 4260 level can be considered a short-term watershed, primarily because last week's upward movement peaked at 4380. The initial decline occurred at this level, and after rebounding below 4380, the price fell again, breaking below this level and reaching below 4200. However, this trend has not been sustained, and the price has risen again after breaking through this level in the US market. Therefore, in terms of future trading strategy, I personally believe that gold prices will continue to rise, and I recommend waiting for a pullback before continuing to invest in bullish long positions.
In short, 4260 is considered a watershed between bulls and bears, and also a protective level for our future strategies. The recommended entry point is around 4300, with an eye on resistance at the previous high of 4330!
Gold Price Outlook | Buyers Stay in Full ControlGold remains firmly positioned within its broader bullish trajectory, supported by consistent demand from both institutional and retail investors. The market has shown strong resilience, forming a well-defined higher-low structure, which reflects continued accumulation. Price action indicates that buyers are confidently stepping in after each controlled pullback, maintaining upward momentum.
The current market tone favors continuation toward the 4,180–4,250 range if momentum persists. Short-term retracements into the 4,070–4,090 area may offer new buying opportunities for position traders aligning with the prevailing trend. Macroeconomic factors such as ongoing inflation concerns, geopolitical instability, and cautious monetary policy stance continue to underpin gold’s strength.

10.20 Gold short-term resistance looks at 4280Gold prices twice confirmed their all-time high of 4380 before falling, the first time by $100 and the second time by nearly $200.
Last Friday, gold prices were insane, plummeting from 4380 to 4279, leaving $100 of room for further gains, before rising another $100 to find 4380.
After confirming resistance at 4380 for the second time, the price continued to rise, signaling a downward trend. Pressure was placed on the short side at 4380, 4355, 4350, 4321, and 4364. The price continued to move around the established downward trend, gradually shifting between levels, and finally accelerating to 4186 before ending the decline.
The price rebounded in late trading, returning to the 4250 mark to end the week!
Judging from Monday's market action, the market has entered a broad range-bound sweep. Specifically, the bullish rally may have temporarily paused, gathering momentum for a subsequent rebound.
We must clearly understand the positioning of our defensive lines. When these lines are breached, adjustments and changes must be made:
1. Coordination between the two lines on the hourly and 30-minute charts
It has fallen back into the 30-minute chart's two-line range, between 4280 and 4110.
It remains above the upper limit of the two lines on the hourly chart, at 4221. Although it broke briefly last Friday, the closing price quickly recovered. Support is also being sought at 4221 in the European session this afternoon.
The upper limit of the two lines, 4280-4220, is where the support is being sought.
If the price breaks through this range, the nature of the market will begin to change.
2. Top and bottom reversal positions and Within the small channel, pressure is building up in the 4280-4385 area. The lower band is extending and expanding, focusing on the 4180-4200 range.
In the Asian session, prices fluctuated around the 4219-4271 range. In the afternoon, we confirmed that the 4268 area was beginning to bearishly bearish. Based on this strategy, we chose to enter a bearish position from above, targeting the 4220 area. Once the price started to move, we would aggressively chase the price, pursuing the bearish trend until it accelerated to the 4221 area.
Short-term strategies for the European and US sessions
1. Short-term trading in the 4278-4282 area, with the upper pressure at 4286, a stop-loss at 4298, and a target of 4250. The next target is 4225-4215.
2. After completing the $100 sweep, focus on the 4320 area for short selling. The specific target is a bit further out, so stay tuned for real-time alerts.
3. Currently, the price has returned to around 4260, so we will wait for the plan in the first point.

4,200 or 4,285? Gold’s Next Move Decides It All📊 Market Overview
Gold remains under pressure at the start of the week, trading below last week’s record highs, after a sharp correction from the 4,380s down to the 4,240 zone.
Investor sentiment is cautious as the market navigates a mix of uncertain U.S. economic data, a still-closed U.S. government, and renewed geopolitical tensions across multiple regions — all of which are fueling both fear and indecision in the market.
During early Asian hours, gold showed a mild recovery but continues to move sideways in a tight consolidation range, reflecting indecisive liquidity buildup before the next major move.
🧠 Technical Structure (MMFLOW View)
Gold is consolidating between short-term support near 4,206–4,204 and resistance around 4,285–4,287.
Liquidity has started to cluster above and below the current range, suggesting that a breakout is imminent.
The 4,166 – 4,140 region remains a major Smart Money re-entry zone, aligned with the CP BUY ZONE + OBS demand block.
On the upside, 4,313 – 4,342 stands as a key supply zone where large sellers previously stepped in.
Until price breaks out decisively, traders should expect choppy intraday conditions with limited follow-through.
🔑 Key Levels to Watch
🟢 BUY ZONE (Liquidity Re-entry Zone)
Zone: 4,206 – 4,204
SL: 4,200
TP: 4,210 – 4,215 – 4,220 – 4,230 – 4,240 – 4,250 – ???
🔴 SELL ZONE (Liquidity Reaction Zone)
Zone: 4,285 – 4,287
SL: 4,292
TP: 4,280 – 4,275 – 4,270 – 4,260 – 4,250 – ???
⚙️ MMFLOW Scenarios
1️⃣ Bullish Scenario:
If gold sustains above the 4,200 – 4,210 support area, a short-term rebound toward 4,270 – 4,285 can be expected.
Breaking above 4,287 would open room toward 4,313 – 4,342 (OBS Sell Zone), where Smart Money may begin distributing again.
2️⃣ Bearish Scenario:
A clean break below 4,200 could trigger a deeper retracement toward 4,166 – 4,140 (CP BUY ZONE).
This would still represent a healthy correction within the broader bullish macro structure.
⚡ MMFLOW Insights
Market remains neutral-to-bullish, but current movement reflects accumulation within a compression range.
Sideway structure indicates the market is loading liquidity for the next impulsive leg.
Patience is key — traders should wait for clean breakout confirmations before scaling positions.
⚠️ Trading Notes
✅ Use tight Stop Losses — gold’s volatility remains unpredictable during macro uncertainty.
✅ Avoid over-leveraging while price stays inside the sideway channel.
✅ Focus on reaction zones (CP, OBS, and liquidity sweeps) for precise entries.
🧭 Quick Summary
Gold trades sideways below record highs.
Key support: 4,206 – 4,204, key resistance: 4,285 – 4,287.
Short-term bias: Range-bound with bullish undertone.
Best approach: Buy dips at liquidity zones; wait for breakout confirmation before trend trades.

mrmoney limited XAU/USD swing trading ideaprice has reacted off our 4hour support which gave us a nice bullish momentum to the upside

XAUUSD Analysis todayHello traders, this is a complete multiple timeframe analysis of this pair. We see could find significant trading opportunities as per analysis upon price action confirmation we may take this trade. Smash the like button if you find value in this analysis and drop a comment if you have any questions or let me know which pair to cover in my next analysis.

10.19 Gold Monday short-term analysis guide!Gold closed near 4247 on Friday. Following five consecutive daily gains, the market closed with a bearish candlestick pattern. Technical analysis suggests that gold prices are poised for a period of volatile correction. Without news stimulus, gold is expected to fluctuate within a range. Given the pullback from Friday's large bearish candlestick, Monday's focus should be on whether the decline can be sustained. If this trend isn't sustained, bulls are poised to launch a counterattack. Otherwise, gold is poised to enter a range of rebound resistance.
From the 4-hour market trend, short-term resistance is currently at 4280-4293, with a focus on 4315-23. Support is at 4185-4193. If bulls fail to achieve a sustained breakout, a period of volatile correction is imminent. Trading strategies should prioritize range-bound trading. In the middle, adopt a cautious approach, cautiously follow orders, and patiently wait for key entry points.

GOLD (XAUUSD): Bullish Market Opening?!
We got a nice pullback on Gold on Friday
and the price nicely retraced to a key intraday support.
Analysing the market reaction to that, I spotted a cup & handle pattern
and a confirmed violation of its neckline.
With a high probability, the market will rise after the opening.
The price will reach at least 4272 intraday resistance.
❤️Please, support my work with like, thank you!❤️
I am part of Trade Nation's Influencer program and receive a monthly fee for using their TradingView charts in my analysis.

Gold (XAU/USD) – Bullish Rebound Expected from Key Support ZoneTechnical Structure
Uptrend Confirmation: Despite the pullback, the overall structure remains bullish — higher highs and higher lows are intact.
Support Zone (Green Box): The area between 4,132 – 4,197 acts as a strong demand region where a reversal is likely.
Target Point: The upside target lies near $4,378 – $4,381, coinciding with previous highs and resistance.
📈 Bullish Scenario
If price tests the support level and shows rejection (bullish candles or wicks), we can expect:
Entry: Around $4,160 – $4,200
Target: $4,380 – $4,381
Stop Loss: Below $4,120
This would confirm a continuation of the uptrend after a healthy correction.
📉 Bearish Scenario
If price breaks below $4,120, it could trigger:
Deeper correction toward $4,060 – $4,000
Momentum shift from bullish to short-term bearish.
🟢 Signal Summary
Direction Entry Zone Stop Loss Take Profit Confidence
BUY (Long) $4,160 – $4,200 $4,120 $4,380 ⭐⭐⭐⭐ (Strong if support holds)
⚠️ Conclusion
Gold is showing signs of retracement within an uptrend.
If the support zone holds, we can expect a bullish reversal toward the $4,380 target point.
However, a break below $4,120 will signal a deeper correction before any new rally.

How to Analyze Daily Time Frame on Gold. 5 Important Things
There are 5 important things that you should analyze on Gold on a daily time frame to accurately predict long term, midterm and short term movements.
In this article, I will share with you a step-by-step guide for daily time frame analysis that you can apply on Gold or any other financial instrument.
1 - Identify the market trend
When you analyze a daily time frame, you should identify long term, midterm and short term market trends.
Long-term trend is based on the analysis of one year long price action.
In the example above, Gold is trading in a long term bullish trend because the price keeps setting new higher high and new higher lows during the year.
Midterm trend is based on the analysis of a price action for the last 4–5 months.
Above, we can clearly see that a mid-term trend is bullish because again, the price sets new higher highs and higher lows over time.
Short-term trend is based on the analysis of price movements for the last 2 months.
Short-term price action is also bullish on Gold, with a clear sequence of higher highs and higher lows.
According to the trend analysis, long-term, mid-term and short-term trends are bullish.
2 - Identify the directional bias
The directional bias defines a highly probable future direction on the market.
In our example, we can anticipate that Gold will keep growing among all the dimensions: long-term, mid-term and short-term.
3 - Execute structure analysis
Identify important historic horizontal and vertical structures.
That will be the points from where you should look for trading opportunities.
When you analyze key levels, identify the structures that are lying close to the current price levels.
Make sure that all the structures that you spotted were respected by the market in the past.
4 - Look for price action patterns
Price action patterns are the language of the market.
Proper identification of the patters will help you correctly understand the intentions of the market participants.
You can see that a bearish breakout of a rising channel triggered a correctional movement on the market.
Gold started to fall steadily within a bullish flag pattern and after it tested a key support, the price violated the resistance of the flag.
5 - Analyze candlesticks
Candlestick patterns can provide extra clues and confirmations.
You can see that the market formed multiple rejections from key support, an inside bar formation and bullish engulfing candle.
Violation of the inside bar to the upside with a strong bullish candle is an important bullish signal.
Combining trend analysis, structure analysis, price action and candlestick analysis, and you can make predictions and look for trading opportunities.
You can also make your analysis even more sophisticated, for example, analyzing fundamental analysis or applying technical indicators.
❤️Please, support my work with like, thank you!❤️
I am part of Trade Nation's Influencer program and receive a monthly fee for using their TradingView charts in my analysis.
GOLD 4H CHART ROUTE MAP Hey Everyone,
This is an extended 4H chart idea, continuing from our previous analysis, now with the added Goldturn levels above, allowing us to continue to track ongoing movement.
After completing the 4212 move, price continued to push upward, leaving a small gap near 4383 before facing rejection. We’re now seeing price retest the lower Goldturn levels for support, with a current test around the 4212 Goldturn. The 4212–4154 zone remains a key weighted area, and as long as price holds above this zone, we may see a potential bounce.
We’ll return on Sunday with our multi-timeframe roadmap and trading plans for the week ahead. Thank you all once again for your continued support, likes, and comments, we truly appreciate it.
Mr. Gold
GoldViewFX
