GOLD 1H CHART ROUTE MAP UPDATE & TRADING PLAN FOR THE WEEKHey Everyone,
Please see our updated 1h chart levels and targets for the coming week.
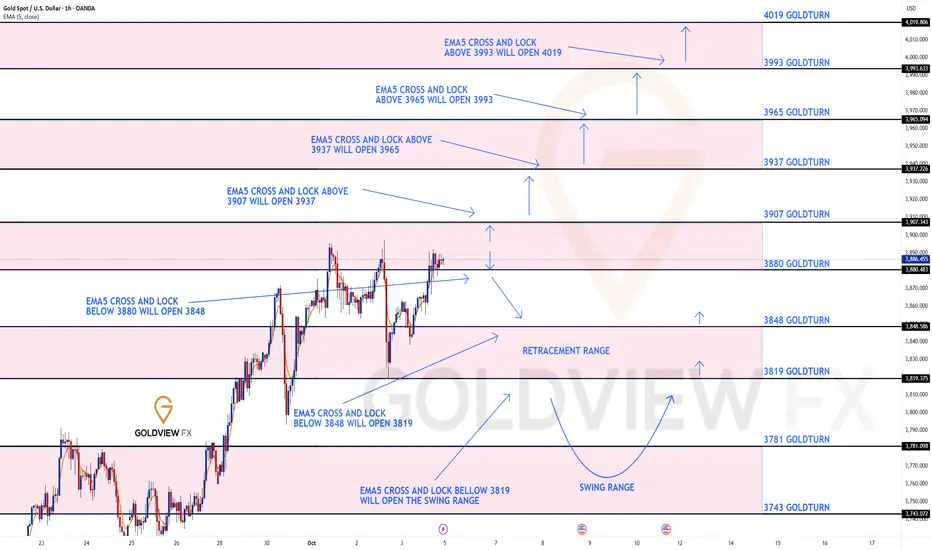
We are seeing price play between two weighted levels with a gap above at 3907 and a gap below at 3880. We will need to see ema5 cross and lock on either weighted level to determine the next range.
We will see levels tested side by side until one of the weighted levels break and lock to confirm direction for the next range.
We will keep the above in mind when taking buys from dips. Our updated levels and weighted levels will allow us to track the movement down and then catch bounces up.
We will continue to buy dips using our support levels taking 20 to 40 pips. As stated before each of our level structures give 20 to 40 pip bounces, which is enough for a nice entry and exit. If you back test the levels we shared every week for the past 24 months, you can see how effectively they were used to trade with or against short/mid term swings and trends.
The swing range give bigger bounces then our weighted levels that's the difference between weighted levels and swing ranges.
BULLISH TARGET
3907
EMA5 CROSS AND LOCK ABOVE 3907 WILL OPEN THE FOLLOWING BULLISH TARGETS
3937
EMA5 CROSS AND LOCK ABOVE 3937 WILL OPEN THE FOLLOWING BULLISH TARGET
3965
EMA5 CROSS AND LOCK ABOVE 3965 WILL OPEN THE FOLLOWING BULLISH TARGET
3993
EMA5 CROSS AND LOCK ABOVE 3993 WILL OPEN THE FOLLOWING BULLISH TARGET
4019
BEARISH TARGETS
3880
EMA5 CROSS AND LOCK BELOW 3880 WILL OPEN THE FOLLOWING BEARISH TARGET
3848
EMA5 CROSS AND LOCK BELOW 3848 WILL OPEN THE FOLLOWING BEARISH TARGET
3819
EMA5 CROSS AND LOCK BELOW 3819 WILL OPEN THE SWING RANGE
3781
3743
As always, we will keep you all updated with regular updates throughout the week and how we manage the active ideas and setups. Thank you all for your likes, comments and follows, we really appreciate it!
Mr Gold
GoldViewFX
Goldtrading
XAU/USD) – Bullish Channel Continuation with Key Support at $3,9The price is moving within an ascending parallel channel, showing an overall bullish trend.
Currently, gold is trading near $3,996, close to the 70 EMA ($3,991).
A support zone is marked around $3,919–$3,950, which has held price action several times.
🔹 Key Levels
Support zone: $3,919 – $3,950
Immediate resistance: Around $4,000 (psychological level + EMA area)
Target point: $4,065
Loss point (Stop-loss): Below $3,919
🔸 Technical Outlook
Trend Direction:
The upward channel and higher highs indicate continuation of the bullish trend unless price closes below $3,919.
Short-term Movement Expectation:
Price might retest the support zone ($3,950–$3,920).
If support holds, an upward bounce toward $4,065 is likely.
If it breaks below $3,919 with volume, price may fall toward $3,870–$3,850 (lower channel line).
EMA Behavior:
The 70 EMA is currently acting as dynamic support; staying above it keeps the bullish momentum intact.
🎯 Trading Plan Suggestion (Technical Only)
Buy zone: $3,940–$3,960
Take profit: $4,060–$4,070
Stop loss: Below $3,915

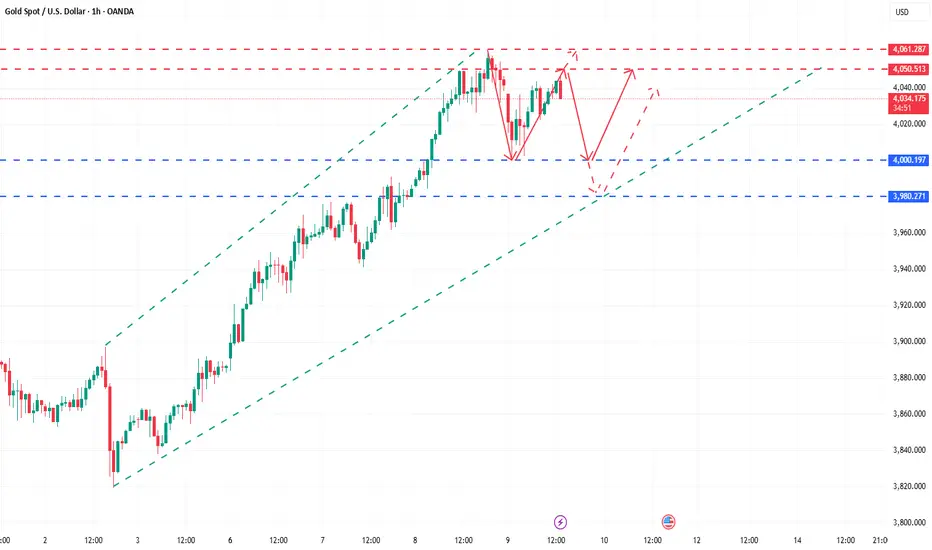
GOLD (XAUUSD): Correction is Over?!
Looks like Gold has completed a correctional movement
that it initiated yesterday.
A confirmed bullish Change of Character on a 4h time frame
that happened after a test of a strong intraday support suggests
a strong bullish pressure.
I expect a rise to 4039
❤️Please, support my work with like, thank you!❤️
I am part of Trade Nation's Influencer program and receive a monthly fee for using their TradingView charts in my analysis.

XAUUSD is in buy zone!GOLD with prevous daily breakdown has tested a daily support and rejected strongly with a single move back to the upside.
As the market structure is longterm bullish price continue to trend back to the upside.
Currently market structure formed with W, with seris of higher low price continue to trend with a signale momentum.
As there has been significant pullback we could see rejection of lowerprice and could countinue to trend back up.

FOMC Fallout or Fakeout? Stay Sharp, Stay DisciplinedHello Traders,
What are your thoughts on the strong downside move we saw yesterday, likely triggered by the release of the FOMC meeting minutes? Personally, I believe this could be a temporary reaction, as the minutes revealed a dovish stance from the Federal Reserve.
As price approaches our area of interest, it's crucial to monitor price action closely on the lower timeframes to assess where it's likely headed. Patience is key—always trade with the trend.
If you're considering selling in this highly bullish market, at the very least wait for a major structure shift. You can identify this by watching for a break of the 50 SMA on the daily chart or a clear break of the most recent strong lower high.
Let’s stay consistent and disciplined.
Happy Trading!

Gold Roadmap After Breaking $4,000 – What’s Next?Gold ( OANDA:XAUUSD ) continued its bullish momentum at the start of the week and even seems to have broken through the key psychological resistance at $4,000 .
Let me first point out that when an asset reaches a new All-Time High (ATH) , Technical analysis tends to become less reliable since there’s no historical price data above that level. However, we still do our best to analyze the market using the available tools .
Currently, Gold is moving near the upper lines of ascending channels and within the Potential Reversal Zone(PRZ) .
From an Elliott Wave Theory perspective , it appears that gold is completing Wave 3 , given the strong momentum it has shown.
That said, Gold likely needs a correction before continuing its uptrend. This pullback could first test the Support lines(First Target) , and in the next stage, possibly reach around $3,963(Second Target) .
Stop Loss(SL): $4,109
Please respect each other's ideas and express them politely if you agree or disagree.
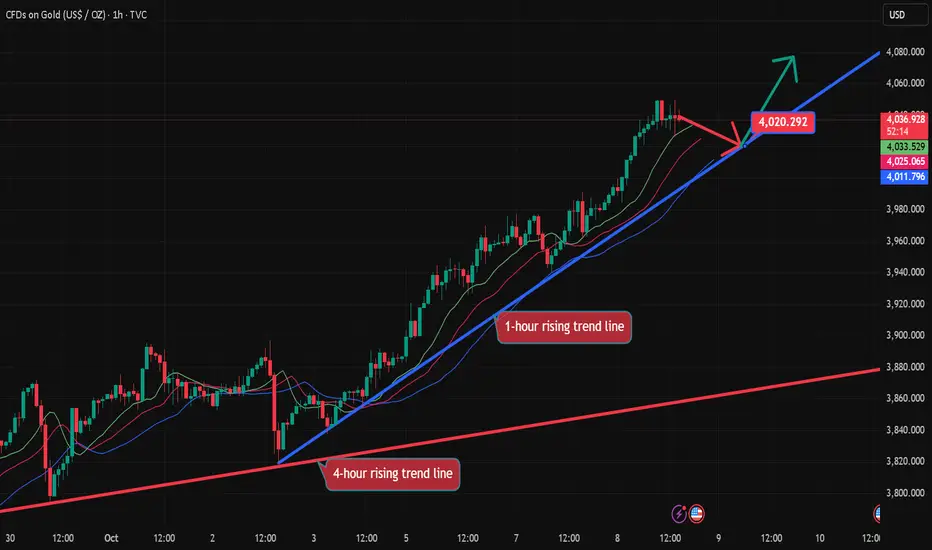
Gold Analyze (XAUUSD), 1-hour time frame.
Be sure to follow the updated ideas.
Do not forget to put a Stop loss for your positions (For every position you want to open).
Please follow your strategy; this is just my idea, and I will gladly see your ideas in this post.
Please do not forget the ✅ ' like ' ✅ button 🙏😊 & Share it with your friends; thanks, and Trade safe.

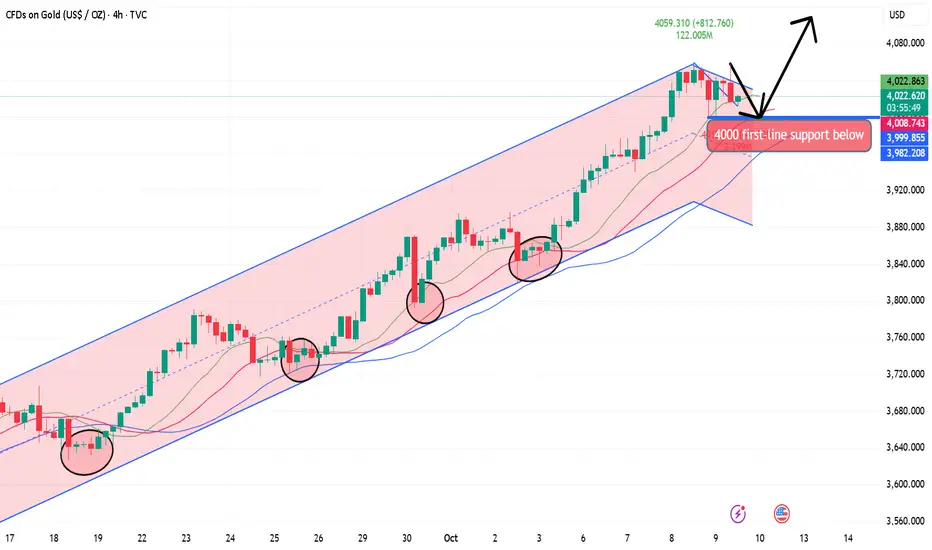
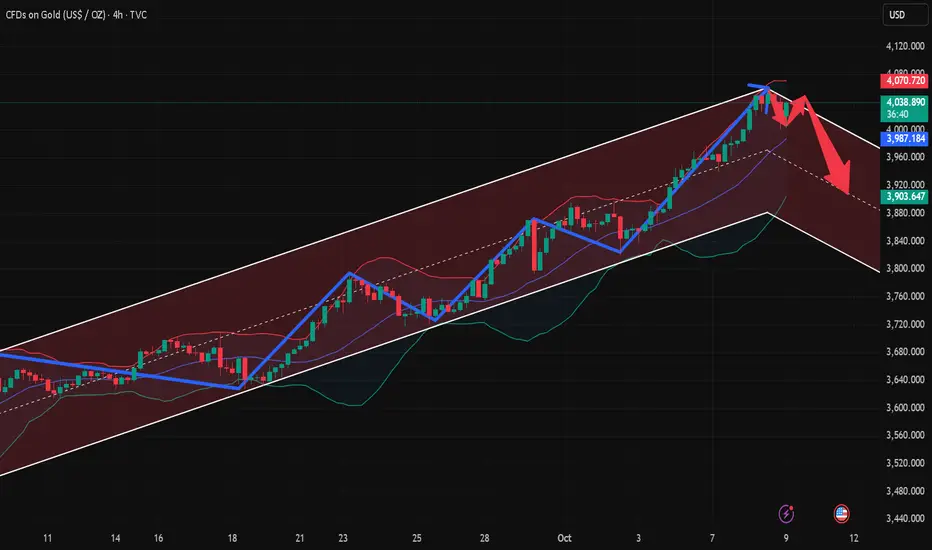
Gold: Stretched, Channel Broken, First Real Pullback Next?1️⃣ Overview
Yesterday, Gold reached a new all-time high at 4061, marking the 8th consecutive ATH in 8 days. If we also consider that the yellow metal has been rising for 8 consecutive weeks, the bullish momentum is undeniable.
However, no market can rise indefinitely without pauses. Regardless of how strong the uptrend is, corrections are necessary, and I believe we are very close to one — if not already in it.
________________________________________
2️⃣ Technical Context
After Friday’s low at 3820, Gold traded within an ascending channel, climbing around 2500 pips from bottom to top. This represents roughly a 6% increase, which is quite significant — especially coming after about a 15% rise in the previous 7 weeks.
Now, the channel has been broken, and Gold has entered a small correction toward the 4000 zone. At the time of writing, the market is rebounding, suggesting that bulls have not yet given up.
Still, this rebound looks more like the first sign of exhaustion than renewed strength. Even if bulls manage to push for another all-time high, the market structure is weakening.
________________________________________
3️⃣ Key Zones to Watch
The 4000 level is now the main psychological area and the line in the sand, followed by the 3990 zone, which acts as technical support.
A sustained break below these areas could open the way for a sharper correction toward the 3900 region, which would still only scratch the surface of the broader rally.
________________________________________
4️⃣ Market View
Of course, the bullish trend will remain intact on the medium term, but momentum is stretched, and a cooling phase looks increasingly likely.
I’m currently watching for potential selling points around yesterday’s highs, as the market starts to show its first signs of fatigue after an exceptional run.

10.9 Gold US Market Operation Guide!!!Looking at the 4-hour market trend, watch for the important support level of 3990-4000 below, and the bull-bear watershed of 3980-85. The bull market is rising strongly and there is no end in sight. Trading strategies should focus on buying on pullbacks. In the middle, be cautious about following orders.
Gold Trading Strategies:
1. Buy gold at 4000-4010, and add to long positions if it retraces to 3985-3993. Set a stop loss at 3977 and target 4045-4050.
Gold goes short first and then long, the rhythm is perfect!Gold has rebounded significantly after touching the key long position of the strategy near 4002 several times during the day, verifying the effectiveness of our previous layout ideas. The price rose rapidly after receiving strong support in the key support area, showing that the bulls still hold a dominant position. The short-term adjustment is more to accumulate momentum for an upward attack. Overall, the structure of a squat followed by a long jump is very obvious. From a technical perspective, the 4-hour cycle still maintains a bull-dominated pattern, the moving average system shows a good bullish arrangement, and the short-term price runs above the main moving average, indicating that the trend is still healthy. Although the MACD momentum column shows signs of contraction, it is still running above the zero axis as a whole, indicating that market momentum is still strong. In terms of operational thinking, we continue to maintain the bullish thinking. The key support is the 4000-3985 area. As long as this range is not effectively broken, short-term pullbacks are regarded as low-long opportunities. If the price effectively falls below the 3980 line, it means that the short-term bullish structure is destroyed and the market may enter a phased adjustment. The 4050-4060 area above is an important pressure zone. If the market encounters resistance and pressure again at this position, you can try to short gold with a light position in the short term. The target can first look at the 4020-4000 area. However, it should be noted that this short order is only a short-term gaming idea. Be sure to strictly control the position and take profit and stop loss, and do not blindly chase the short position. If the gold price can continue to break through and stabilize above 4060 in large volume, the upside space will be further opened, with the target pointing to the 4100 mark or even higher levels. Overall, the gold trend remains healthy, and a short-term pullback will not change the medium-term upward trend. The core of stable trading lies in rhythm and execution. Although the market is advancing in volatility, the direction remains clear. Be patient, strictly implement the plan, and wait for the market to give another opportunity for certainty. If there are structural changes in the subsequent market, I will update the strategy and synchronize it with you as soon as possible.
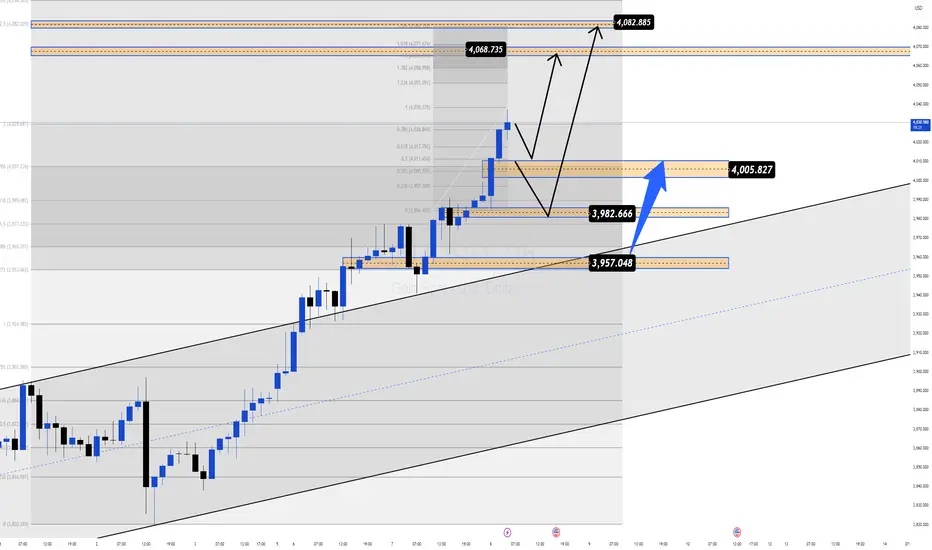
Unstoppable Uptrend as Gold Benefits from Fed Easing📊 Market Context
Gold continues to hold its strong uptrend amid political and economic uncertainty in the US. The government shutdown has now entered its second week with no resolution in sight, fueling further concerns about the impact on US economic performance.
At the same time, the Federal Reserve has entered an easing cycle since September, with expectations of additional 25 bps rate cuts in both October and December – a clear bullish driver for non-yielding gold.
According to the World Gold Council (WGC), gold-backed ETFs have recorded $64 billion in inflows this year, with September marking the largest monthly increase in over three years – a strong signal of booming safe-haven demand.
Not only investors, but global central banks also remain active buyers, adding 15 tons to reserves, showing a clear shift away from reliance on US debt.
All these factors combined continue to reinforce the long-term bullish trend, opening up opportunities for strategic BUY setups.
🔎 Technical Analysis (H1/H4)
Price action remains within an upward channel, repeatedly retesting and bouncing from support.
Buy Scalp Zone 4004–4002: quick reaction zone for short-term entries.
Main Buy Zone 3986–3984: strong support aligned with FVG.
Key resistance target: 4068–4082 (Liquidity Zone).
📈 Trading Plan
✅ BUY SCALP: 4004–4002
SL: 3996
TP: 4008 - 4012 - 4016 - 4020 - 4030 - 4040 - ????
✅ BUY ZONE: 3986–3984
SL: 3980
TP: 3990 - 3995 - 4000 - 4010 - 4020 - 4030 - 4040 - ????
⚠️ Risk Management Notes
The 4000 level is a key psychological resistance – watch for potential liquidity sweeps.
Only enter trades with clear price action confirmation at BUY zones.
Adjust position sizing carefully, as volatility could spike with political headlines and Fed-related updates.
✅ Summary
Gold’s bullish momentum remains intact, supported by US political uncertainty, Fed easing, record ETF inflows, and continued central bank accumulation. Strategy remains BUY at 4004–4002 and 3986–3984, aiming for targets toward 4068–4082.
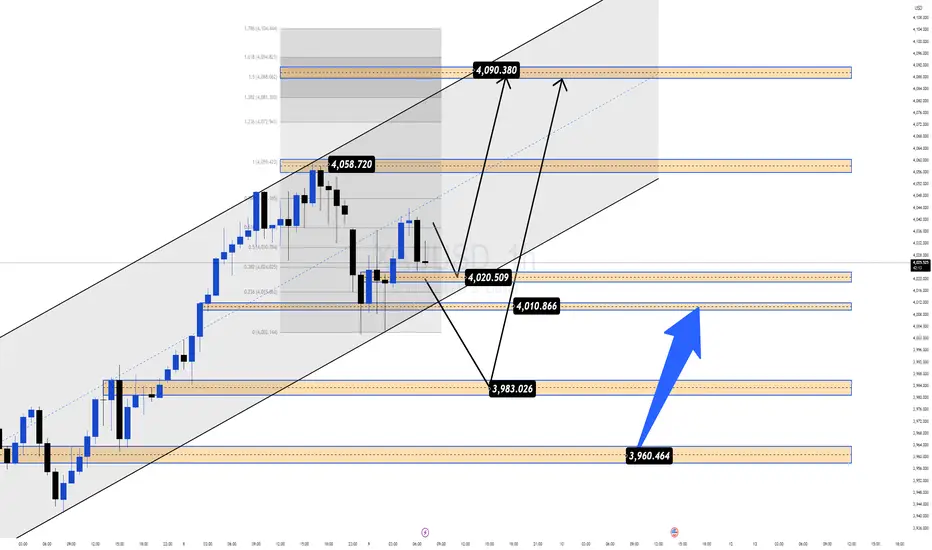
Gold Bullish Setup Targeting New ATHThis XAU/USD 1-hour chart shows gold trading around 4039 with a bullish setup. Price is respecting the support trend line, confirming upward momentum. Key support is marked near 4001, providing a strong base for buyers.
The chart highlights the previous ATH at 4060 and projects a potential breakout towards a new all-time high at 4115. The structure suggests a possible short-term pullback to retest support before continuing higher. As long as the trend line holds, the bias remains bullish with upside targets at 4058, 4087, and finally 4115.

Bulls Reloading After a Healthy Pullback | Next Target: 4090+ 📊 Market Context
After a powerful bullish rally that pushed gold to record highs, XAUUSD retraced about 1% on Thursday as traders took profit from the recent surge. However, this move appears to be a technical correction, not a trend reversal — as indicators have shown overbought conditions for several sessions.
Despite this short-term pullback, the long-term uptrend remains intact.
Gold is up more than 50% year-to-date, driven by:
🌍 Ongoing geopolitical and trade tensions,
💰 The Federal Reserve’s monetary easing cycle,
🏦 Record central bank gold accumulation,
⚔️ Rising global uncertainty, fueling strong safe-haven demand.
Overall, this retracement could be an ideal setup for BUY re-entries, as bulls look to reload positions toward the 4090–4100 liquidity zone.
🔎 Technical Analysis (H1/H4)
Price remains inside the medium-term bullish channel, showing strong reactions around 4000–3980 support.
4010–4008 acts as a quick scalp zone for short-term entries.
3984–3982 serves as a key structural support and liquidity reaction area.
4090–4092 (Liquidity Sell Zone) stands as the major resistance — potential liquidity trap area.
📈 Trading Plan
✅ BUY SCALP: 4010–4008
SL: 4002
TP: 4015 - 4020 - 4030 - 4040 - 4050 - ????
✅ BUY ZONE: 3984–3982
SL: 3978
TP: 3990 - 3995 - 4000 - 4005 - 4010 - 4020 - ????
✅ SELL ZONE: 4090–4092
SL: 4098
TP: 4085 - 4080 - 4070 - 4060 - 4050 - ????
⚠️ Risk Management Notes
The 4000 level remains a strong psychological and structural support — only enter long positions with confirmed price action signals.
Be cautious around 4090–4100, where liquidity sweeps and false breakouts are likely.
Adjust position size properly to manage volatility during high-impact news or geopolitical updates.
✅ Summary
Gold is undergoing a healthy correction phase within its broader uptrend.
The strategy remains BUY-focused at 4010–4008 and 3984–3982,
with upside targets toward 4060–4090,
and a potential short-term SELL opportunity near 4090–4092 if rejection signals appear.
💡 MMFLOW TRADING – Trade with market structure, follow liquidity, and ride the BIGWIN setups!
10.9 Gold Short-term Intraday Operation Guide!!!Technical Analysis:
The 4-hour chart shows support at the middle line and near the MA30 moving average, corresponding to 3986 and 3947, respectively. The Bollinger Bands have also begun to narrow, indicating a volatile, compressed, and retest pattern in the 4-hour chart. Focus is currently on the upward pressure of 4032, near the MA5 moving average.
The 3-hour chart saw a rapid drop to 4001 this morning before bottoming out near 4008 and rebounding to 4036. The MACD formed a dead cross with high volume, and the STO indicator is trading at a low level, indicating weak 4-hour volatility. The high point of the morning rebound, the middle line of the hourly chart, has become the current resistance point at 4036. Meanwhile, support between 3999 and 4000 is a key focus today.
On the daily chart, focus on yesterday's highs and lows, 4059, and 3984. For the daily chart to rise, it must not fall below yesterday's lows but must break above yesterday's highs. However, considering the current volatile decline in the 4-hour chart, it is obvious that it will be difficult to go up in the morning session, so 4032 and 4050-59 become today's shorting points; and for the time being, we will focus on the morning low of 4001 and yesterday's low of 3984.
The US market fluctuates at a high level, and long orders fall bGold prices continued to fluctuate at high levels in the early stages of the U.S. trading session on Wednesday (October 8), with the potential for further gains. At the same time, the current price increase has already reached a large extent. Pursuing long positions at the current price is not the best opportunity. Waiting for a pullback to trade long positions at support points, with small stop-loss orders and a large expected profit range, spot gold broke through the $4,000 mark during the day, reaching a record high of $4,049.43 before retreating slightly. The current rise in gold prices is driven by strong safe-haven demand, driven by factors including the U.S. government shutdown, falling Treasury yields, and political turmoil in Europe and Japan.
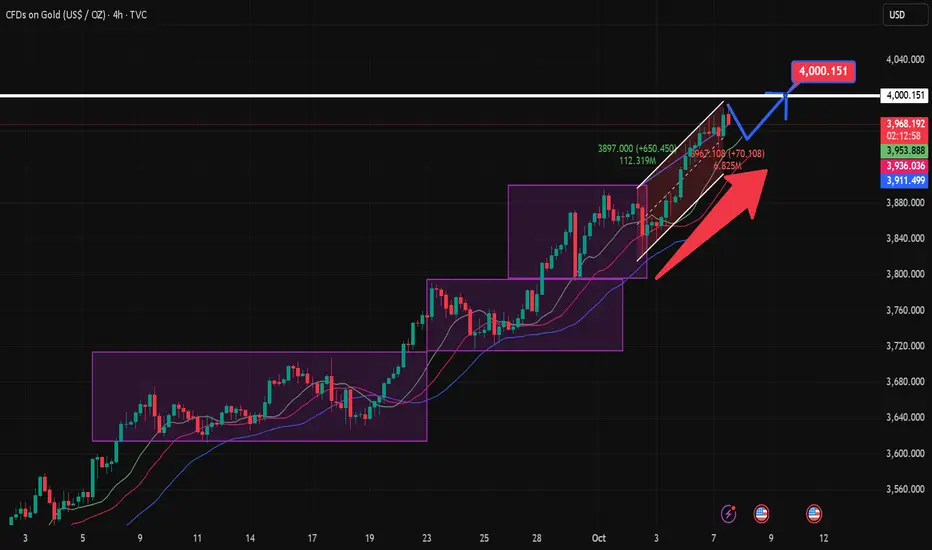
Gold Price Rally Sustains – Market Eyes Next Breakout PointGold (XAUUSD) continues to follow a strong bullish trajectory, confirming consistent market confidence and institutional participation. The chart structure reveals clear liquidity shifts and a steady series of bullish break-of-structure (BOS) points, suggesting that buyers remain in firm control. After a brief consolidation phase, gold resumed upward momentum, supported by sustained volume and steady market sentiment.
The current trend indicates controlled buying pressure rather than speculative spikes, showing the market’s preference for stability as price builds toward higher levels. If momentum maintains its present pace, gold could extend gains in the short term while maintaining its established bullish rhythm across the higher timeframe outlook.

GOLD (XAUUSD): The Next Psychological Resistances
Gold successfully reached 4000 psychological resistance and broke through that.
Here are the next potentially significant structures:
Resistance 1: 4048 - 4052 area
Resistance 2: 4098 - 4102 area
For now the price is testing 4050 psychological resistance.
Its breakout will push the prices to Resistance 2.
❤️Please, support my work with like, thank you!❤️
I am part of Trade Nation's Influencer program and receive a monthly fee for using their TradingView charts in my analysis.

When the market is crazy, staying calm is the biggest advantage!Since the US government shutdown, the gold market has completely lost its disguise and continues to rise without any decent technical pullback. The current market sentiment is high and the bulls are fully dominant. Even the 4,000 mark has failed to form an effective suppression. In the short term, if we want to see a significant correction, we can only hope that the US government will resume operations. Otherwise, the gold price may still maintain a strong upward rhythm. The current upward momentum even exceeds the market intensity in some war stages. From a technical perspective, in the short term, pay attention to the pressure of 4030 and 4050 levels. If there are signs of resistance to rising, try short-selling with a light position, strictly control risks, and flexibly stop profit; the support below focuses on the 4000-3990 area. Once it stabilizes effectively, it is still expected to continue to rise. Today's market has long broken the inherent thinking of not chasing ups and downs in the past. Gold has entered a new cycle of letting itself go. The new gold era is strong and not afraid of highs. Brothers who are uncertain can communicate with me at any time, and I will give strategic guidance at the bottom as soon as possible.

10.7 The bullish trend of gold remains unchanged! Follow the treCurrent Market:
1: Technical Analysis - The bullish trend remains unchanged, so follow the trend. Trading Methods - Follow sideways trading and pullbacks! Avoid headwinds and avoid heavily shorting! Focus on following the trend!
2: Fundamentals - The probability of an October Fed rate cut continues to increase! The Russo-Ukrainian war remains stalemated! The outlook for the Middle East remains uncertain! Global central banks continue to increase their gold holdings! The overall fundamental environment is bullish for gold.
To sum up: From both a technical and fundamental perspective, gold is primarily bullish!
US Trading Timeframe:
1: 1-hour trading, sideways resistance at high levels, with support near 3940; the Stochastic and MACD lines are temporarily blunting!
2: 4-hour trading, the Stochastic has formed a death cross, and the MACD lines are blunting! From a morphological perspective, the short-term top-bottom reversal support level is around 3940.
3: In the daily K-line, the stochastic indicator blunted and retraced to a golden cross, signaling a bullish trend. The MACD double lines continued to cross upward, indicating a bullish trend.

Gold is rising as expected, with the US market eyeing 4000!!!After gold retreated to around 3940, it began to rally. The strategy for the future remains to buy on dips. Short-term long positions near 3942 can be reduced, with a target of 3980 still in sight. Be mindful of the risks. Short-term investors can consider buying around 3954, with a stop-loss at 3946, and targeting a range between 3980 and 4000. Be mindful of the risks.
October 7th US Gold Trading: For those holding positions near 3942, reduce positions and hold with a profit and loss at 3946. Target resistance near 3980, and a breakout to 4000.
Short-term investors can consider buying further near 3954, with a stop-loss at 3946 and a profit target of 3980-4000. Be mindful of the risks.
Gold Price Analysis – Bullish Above $3910Gold price is currently showing a mild correction after testing the upper trendline of the ascending channel. The chart suggests a possible short-term pullback toward the $3925–$3913 zone, which aligns with the 0.382–0.618 Fibonacci retracement levels. As long as price holds above $3910, the bullish structure remains intact, and a rebound toward $3976 and possibly $4016 can be expected. A break below $3900 would weaken bullish momentum and could extend the decline toward $3875 support.
Support: $3925 / $3910 / $3875
Resistance: $3976 / $4016
Bias: Bullish above $3910; correction possible before next leg up.
Note
Please risk management in trading is a Key so use your money accordingly. If you like the idea then please like and boost. Thank you and Good Luck!

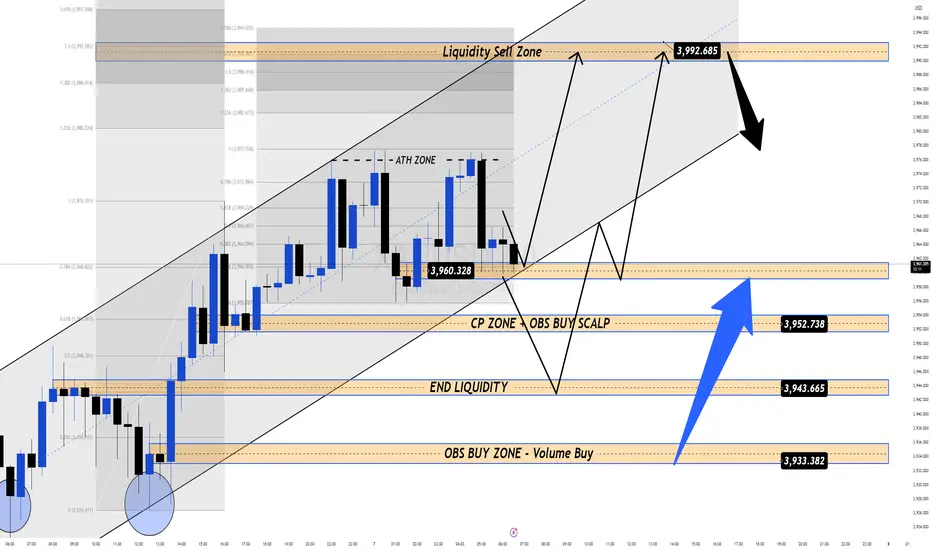
Gold Nears $4000, BofA Warns of Mid-Cycle Correction 🚀 XAUUSD – Daily Trading Plan| MMFLOW TRADING
📊 Market Context
Gold is pushing toward the $4,000/oz milestone, but a fresh warning from Bank of America has traders on alert. Strategist Paul Ciana points out that gold is currently trading 20% above its 200-day moving average — a level that historically preceded sharp corrections (2008, 2011, 2020, 2022).
That said, mid-term forecasts from Goldman Sachs, UBS, and even BofA still project gold could reach $4,200–$4,900/oz in the coming year. The long-term bullish trend remains intact, but in the short term, the risk of sudden corrections is high as the market shakes out FOMO-driven buying pressure.
🔎 Technical Analysis (H1/H4)
Price is consolidating near the ATH Zone and major liquidity levels around 3990–4000.
Buy Zone: 3935–3933 (CP zone & FVG reaction) – attractive area to reload long positions.
Sell Zone: 3993–3995 (Liquidity Zone) – a potential trap area as gold tests the $4000 psychological mark.
🔑 Key Levels
BUY Zones: 3935–3933, with main support at 3910.
SELL Zone: 3993–3995 (watch liquidity reaction).
Psychological resistance: 4000.
📈 Trading Scenarios & Plan
✅ BUY ZONE 1: 3935–3933
SL: 3927
TP: 3940 - 3945 - 3950 - 3960 - 3970 - 3980 - ???
✅ SELL ZONE: 3993–3995
SL: 4000
TP: 3988 - 3984 - 3980 - 3970 - 3960 - ???
⚠️ Risk Management Notes
The 3990–4000 zone is a heavy liquidity cluster — expect false breakouts before reversals.
Only enter trades with clear price action confirmation; avoid chasing FOMO near the highs.
Adjust position sizing carefully, as volatility may spike while markets debate the risk of a “mid-cycle correction.”
✅ Summary
Gold remains in a long-term bullish trend, but traders must respect short-term risks. MMFLOW prioritises buys at 3935–3933 while keeping a cautious eye on the 3993–3995 sell zone near the $4000 mark. Upside targets point toward 3980+, with potential for higher extensions if momentum holds.
📢 Stay tuned with MMFLOW TRADING for real-time updates and BIGWIN setups as gold tests historic highs!
XAUUSD Analysis todayHello traders, this is a complete multiple timeframe analysis of this pair. We see could find significant trading opportunities as per analysis upon price action confirmation we may take this trade. Smash the like button if you find value in this analysis and drop a comment if you have any questions or let me know which pair to cover in my next analysis.

GOLD (XAUUSD): 4000 Soon?!
Gold was strongly bullish on Monday, updating the ATH again.
The next psychological resistance is 4000.
I think that the price will reach that soon.
We will probably see a pullback first.
You can consider the underlined supports, especially Horizontal Support 1
and a Vertical Support 1 for buying after a pullback.
❤️Please, support my work with like, thank you!❤️
I am part of Trade Nation's Influencer program and receive a monthly fee for using their TradingView charts in my analysis.
