XAUUSD – Breakdown After Ceasefire & Fed Comments📉 Market Overview
Gold (XAUUSD) dropped over 2%, sliding from $4,012/oz to $3,945/oz, marking a sharp $67 decline overnight.
The selloff came as two key catalysts hit the market:
🕊 Israel–Hamas ceasefire agreement cooled down geopolitical tensions.
💬 Fed’s Barr pushed back against October rate cuts, sending USD higher and pressuring gold.
Despite the drop, price action suggests a temporary corrective phase, with gold now stabilising near a short-term support zone.
📊 Technical Structure (MMFLOW View)
Gold has confirmed a Head & Shoulders (H&S) breakdown pattern, with a neckline retest around $4,014 – $4,033 acting as resistance.
After the breakdown, price rebounded slightly but continues to trade below the structure, showing that bears remain in control short-term.
The short-term support zone sits around $3,945, and if broken, could accelerate the decline towards $3,912 – $3,885, aligning with deeper liquidity areas.
🔑 Key Zones to Watch
Resistance (Breakdown Zone): 4,014 – 4,033
Support (Short-term): 3,945 – 3,912
Liquidity/Buy Zone: 3,885 – 3,878
💡 MMFLOW Trading Scenarios
🔵 BUY SCALP Zone: 3,912 – 3,910
🔴 Stop Loss: 3,905
✅ Take Profit: 3,916 – 3,920 – 3,925 – 3,930 – 3,940 – 3,950 – ???
Trading View:
The market is still digesting recent fundamentals; volatility remains high.
A short-term rebound from 3,910 is possible as liquidity builds up near this demand zone.
However, unless price reclaims 4,014, any bounce may only be corrective before further downside continuation.
🧭 MMFLOW Insight
Even though gold faces bearish momentum, macro risks still support a long-term bullish narrative:
U.S. government shutdown risks remain unresolved.
Fed may turn dovish later in Q4 if labour data weakens.
Liquidity gaps below $3,900 could attract smart money accumulation zones.
⚠️ Trading Notes
✅ Always set Stop Loss – NFP-style volatility can occur post-Fed comments.
✅ Avoid chasing after breakdown candles. Wait for pullback entries at key levels.
✅ Be patient — the best setups form when liquidity is fully absorbed.
📍 Summary
Gold continues to trade under pressure after geopolitical easing and hawkish Fed tones.
Watch for price action around $3,910 – $3,945; this range will likely define the next major impulse.
Stay alert — once liquidity clears, MMFlow will be watching for smart-money reentry signals from key OB/CP zones.
Goldtradingidea

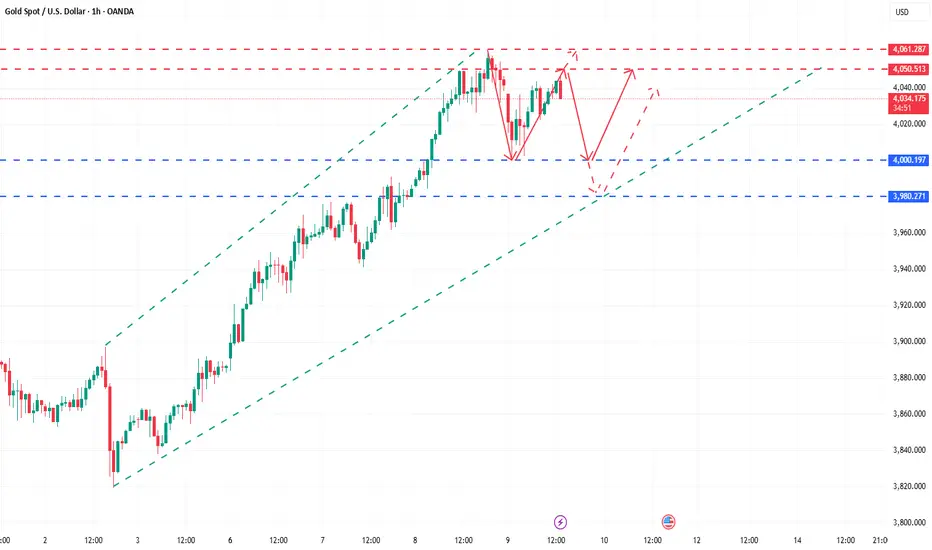
Gold short positions above 4050 have achieved another success!Today we have been emphasizing that gold may usher in a major adjustment. In the end, gold fell below the 4,000 mark. This position is exactly the important medium-term bullish and bearish turning point that we have been adhering to for a long time. Gold broke through and fell directly during the U.S. trading session. We participated in short orders throughout the process. Gold fell sharply as expected. At present, gold has fallen below the key mark. It is likely to be mainly adjusted in the short term. There is a lack of new positive news stimulation in the near future. The market may enter the bearish home court next. The gold 1-hour moving average has turned, indicating that the bullish momentum has weakened significantly and the rebound strength is limited. The trading ideas in the future are still clear. The rebound is under pressure in the 3985-4000 area, which are opportunities to short at highs. We never do stubborn longs or shorts. Once the long and short key positions are broken, the trend has turned. Only by following the trend can we be invincible.

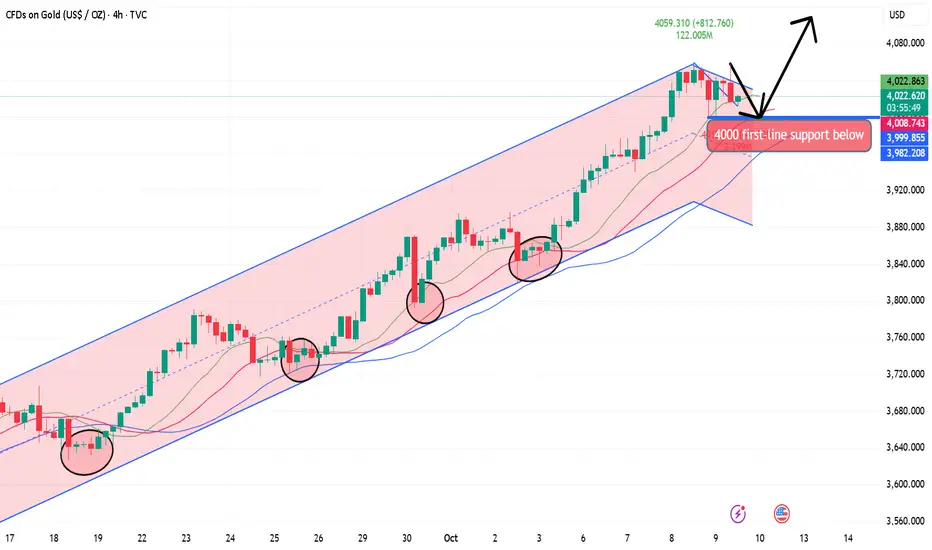
10.9 Gold US Market Operation Guide!!!Looking at the 4-hour market trend, watch for the important support level of 3990-4000 below, and the bull-bear watershed of 3980-85. The bull market is rising strongly and there is no end in sight. Trading strategies should focus on buying on pullbacks. In the middle, be cautious about following orders.
Gold Trading Strategies:
1. Buy gold at 4000-4010, and add to long positions if it retraces to 3985-3993. Set a stop loss at 3977 and target 4045-4050.
Gold goes short first and then long, the rhythm is perfect!Gold has rebounded significantly after touching the key long position of the strategy near 4002 several times during the day, verifying the effectiveness of our previous layout ideas. The price rose rapidly after receiving strong support in the key support area, showing that the bulls still hold a dominant position. The short-term adjustment is more to accumulate momentum for an upward attack. Overall, the structure of a squat followed by a long jump is very obvious. From a technical perspective, the 4-hour cycle still maintains a bull-dominated pattern, the moving average system shows a good bullish arrangement, and the short-term price runs above the main moving average, indicating that the trend is still healthy. Although the MACD momentum column shows signs of contraction, it is still running above the zero axis as a whole, indicating that market momentum is still strong. In terms of operational thinking, we continue to maintain the bullish thinking. The key support is the 4000-3985 area. As long as this range is not effectively broken, short-term pullbacks are regarded as low-long opportunities. If the price effectively falls below the 3980 line, it means that the short-term bullish structure is destroyed and the market may enter a phased adjustment. The 4050-4060 area above is an important pressure zone. If the market encounters resistance and pressure again at this position, you can try to short gold with a light position in the short term. The target can first look at the 4020-4000 area. However, it should be noted that this short order is only a short-term gaming idea. Be sure to strictly control the position and take profit and stop loss, and do not blindly chase the short position. If the gold price can continue to break through and stabilize above 4060 in large volume, the upside space will be further opened, with the target pointing to the 4100 mark or even higher levels. Overall, the gold trend remains healthy, and a short-term pullback will not change the medium-term upward trend. The core of stable trading lies in rhythm and execution. Although the market is advancing in volatility, the direction remains clear. Be patient, strictly implement the plan, and wait for the market to give another opportunity for certainty. If there are structural changes in the subsequent market, I will update the strategy and synchronize it with you as soon as possible.
Unstoppable Uptrend as Gold Benefits from Fed Easing📊 Market Context
Gold continues to hold its strong uptrend amid political and economic uncertainty in the US. The government shutdown has now entered its second week with no resolution in sight, fueling further concerns about the impact on US economic performance.
At the same time, the Federal Reserve has entered an easing cycle since September, with expectations of additional 25 bps rate cuts in both October and December – a clear bullish driver for non-yielding gold.
According to the World Gold Council (WGC), gold-backed ETFs have recorded $64 billion in inflows this year, with September marking the largest monthly increase in over three years – a strong signal of booming safe-haven demand.
Not only investors, but global central banks also remain active buyers, adding 15 tons to reserves, showing a clear shift away from reliance on US debt.
All these factors combined continue to reinforce the long-term bullish trend, opening up opportunities for strategic BUY setups.
🔎 Technical Analysis (H1/H4)
Price action remains within an upward channel, repeatedly retesting and bouncing from support.
Buy Scalp Zone 4004–4002: quick reaction zone for short-term entries.
Main Buy Zone 3986–3984: strong support aligned with FVG.
Key resistance target: 4068–4082 (Liquidity Zone).
📈 Trading Plan
✅ BUY SCALP: 4004–4002
SL: 3996
TP: 4008 - 4012 - 4016 - 4020 - 4030 - 4040 - ????
✅ BUY ZONE: 3986–3984
SL: 3980
TP: 3990 - 3995 - 4000 - 4010 - 4020 - 4030 - 4040 - ????
⚠️ Risk Management Notes
The 4000 level is a key psychological resistance – watch for potential liquidity sweeps.
Only enter trades with clear price action confirmation at BUY zones.
Adjust position sizing carefully, as volatility could spike with political headlines and Fed-related updates.
✅ Summary
Gold’s bullish momentum remains intact, supported by US political uncertainty, Fed easing, record ETF inflows, and continued central bank accumulation. Strategy remains BUY at 4004–4002 and 3986–3984, aiming for targets toward 4068–4082.
Gold Awaits Powell's Speech: Sell $4052 or Buy $3977?Hello TradingView community!
The Gold market is entering a pivotal phase. After an impressive rally, prices are pausing at a critical resistance zone, and the market sentiment is holding its breath for tonight's main event: the speech by Federal Reserve Chairman Jerome Powell.
This is a moment where a few words can determine the direction of an entire trend. Let's outline a detailed action plan.
1. Macro Context: Jerome Powell in Focus
"Aftershocks" from the FOMC Minutes: The market is still "digesting" the FOMC meeting minutes released yesterday. The minutes revealed a somewhat more "hawkish" tone than expected, as many members remain concerned about inflation. This is putting slight pressure on Gold prices.
Main Event: Fed Chair Powell Speaks.
This is when all eyes are on him. Traders will scrutinize every word of Powell's for clues about the future interest rate path.
If Powell maintains a hawkish tone, emphasizing that the fight against inflation is not over, the USD will strengthen, and Gold may undergo a deep correction.
Conversely, if he makes "dovish" remarks, expressing concerns about economic growth, it will be a "green light" for Gold to break out.
2. Technical Analysis: Action Plan
Our chart clearly outlines the key "battle lines":
Main Resistance Zone (Bearish OB - Zone):
This is the "stronghold" of the Bears, where profit-taking and short-selling pressures are concentrated. With a somewhat hawkish macro backdrop, this is a very strong resistance zone. The scenario forecasted on the chart shows prices may rebound to this area and be rejected. This is a critical area to watch for sell signals.
Primary Buy Zone (Bullish OB - Buy Zone):
This is the safest and most ideal "stronghold" for the Bulls. It is the order block that created the previous strong upward wave. A perfect scenario is Powell's speech driving prices to adjust to this zone, creating a good buying opportunity to follow the main trend.
Breakout Target (Liquidity):
If Powell unexpectedly turns "dovish," Gold could break through the $4,052 resistance zone and head straight for the liquidity target at the previous peak.
Trading Strategy
Before the speech (19:30): The market may be unpredictable. It's best to stay on the sidelines to avoid price "sweeps."
Preferred strategy: Based on the adjustment scenario drawn on the chart, patiently waiting for a buying opportunity at a strong support zone will be safer.
Specific plan:
Sellers (Risky): Look for clear reversal signals at the $4,052 zone during or after the speech.
Buyers (Safe): Wait for a price push down to the $3,977 zone and look for confirmation signals to buy.
WHAT'S YOUR PLAN?
Do you predict Chairman Powell will be "hawkish" or "dovish" tonight? And is your plan to Sell $4,052 or wait to Buy $3,977?
👇 Share your thoughts in the comments and don't forget to Like 👍 and Follow the channel!

GOLD|Surge: Targeting $4,100! Where to Buy Ahead of FOMC MinutesHello TradingView community! 🚀
Gold (XAU/USD) continues to demonstrate incredible strength, consistently breaking past old highs and forming a solid upward price channel. This robust rally is not only technically reinforced but is also awaiting a potential catalyst from today's crucial fundamental news.
In this analysis, we will combine two key perspectives: a deep dive into the technical chart to identify optimal entry points, and an examination of the main fundamental event that could significantly impact Gold prices during the US session.
1. Fundamental Perspective: All Eyes on FOMC Minutes
Today's market highlight, Wednesday, October 8, is the release of the FOMC Meeting Minutes at 2:00 PM ET.
Why does this matter? The minutes provide a detailed record of the Federal Reserve's most recent policy meeting in September. Traders will scrutinize the text for any hints about the future interest rate path.
Potential scenarios:
"Dovish" Tone: If the minutes reveal that FED officials are concerned about economic growth and open to further rate cuts, the US Dollar may weaken. This would create a strong push for Gold (XAU/USD), potentially fueling the next price surge.
"Hawkish" Tone: If the minutes emphasize that inflation remains a concern and the FED is not in a hurry to cut rates, the USD may see a short-term recovery, causing Gold to have a corrective dip.
This event is a top catalyst for volatility. Our strategy is to prepare technical zones to capitalize on the market's reaction.
2. Technical Analysis: Detailed Trading Plan
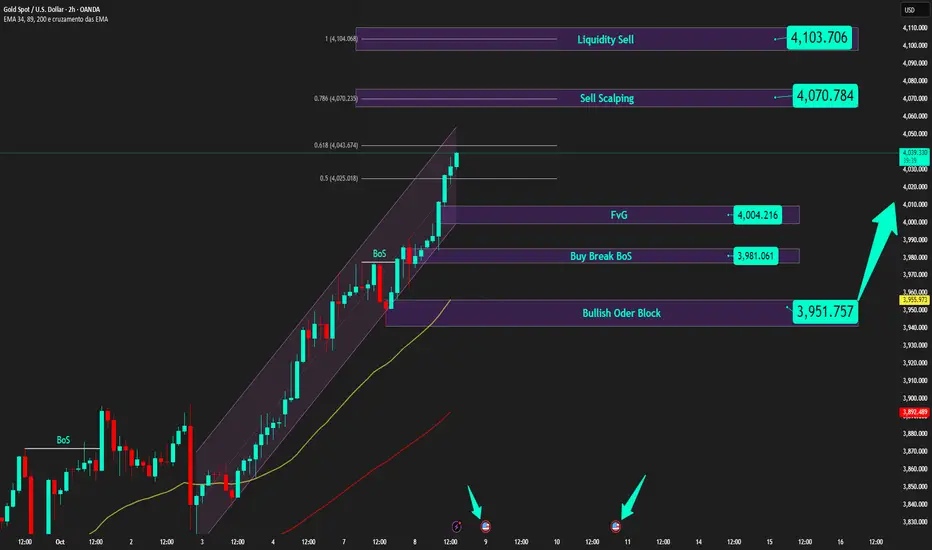
The bullish structure on the 2H timeframe is undeniable. Prices are creating a series of higher highs, confirmed by each "BoS" (Break of Structure), signaling that the Buyers are in full control. Here are the key zones to watch:
Potential Buying Zones (Key Points):
FVG Zone ($4,004): The nearest support is this Fair Value Gap, an area of price imbalance that the market often seeks to fill. Prices may retest this area before or during the news release.
"Buy Break BoS" Zone ($3,981): This is the most recent swing high that has been broken. It has now turned from resistance into a crucial support level. This zone provides a solid entry point if prices correct a bit deeper.
"Bullish Order Block" Zone ($3,951): This is the last major "stronghold" of the Buyers—a strong buy order block that initiated the latest push wave. This is an ideal area to look for buy orders if the market makes a strong liquidity sweep downward.
Upside Targets:
Short-term target (Scalping): $4,070 - This level coincides with the 0.786 Fibonacci level.
Main target: "Liquidity Sell" Zone at $4,103. This is a large "liquidity pool" where the Sell side's stop-loss orders are likely concentrated. Smart money often drives prices towards such areas.
Strategy Summary
Main trend: Bullish.
Core strategy: Look for "Buy the dip" opportunities at the key support zones mentioned.
Critical timing: Be cautious around the FOMC Minutes release (18:00 UTC). Volatility can be high, and the market may whip in both directions to sweep stop-losses before following the main direction.
Pro tip: Patience is key. Waiting for prices to pull back to a confirmed support zone will provide a much better Risk/Reward ratio than chasing the market at the highs.
WHAT'S YOUR TAKE?
How do you think Gold will react to today's FOMC minutes? And where are you looking to place your buy orders—at the FVG zone $4,004, the BoS level $3,981, or are you patiently waiting for the Order Block $3,951?
Share your thoughts in the comments below!
👇 Don't forget to leave a Like 👍 and Follow the channel for the latest XAU/USD analyses!
10.7 Gold Intraday Short-Term Operation Guide!!!Gold typically enters a correction phase on Tuesday after a strong rally on Monday. Maintain a bullish outlook for the day, with the primary support area being the 3955-60 range (which encompasses the early morning low, opening price, and high trading volume). Bulls are expected to mount a counterattack here. Today's market will not simply replicate Monday's unilateral surge, but will likely exhibit a pattern of "high-level fluctuations, false breakouts, and subsequent declines, followed by a test of the bottom and subsequent upward movement." Trading strategies should be abandoned in favor of buying at the bottom of the market fluctuations.
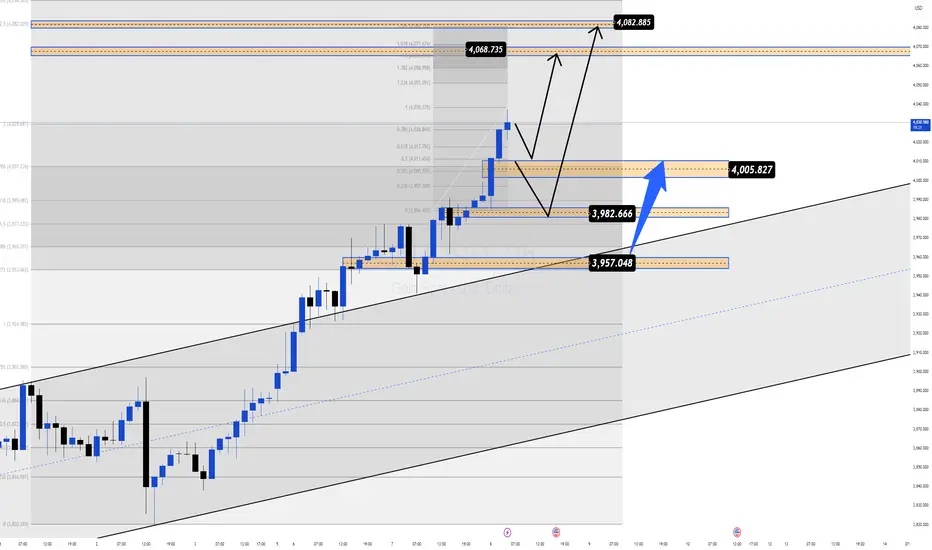
XAUUSD | Sustainable Price Rise: Where’s the Next Optimal Entry?Hello TradingView community! 🚀
Gold (XAU/USD) is in an extremely sustainable upward structure. Instead of lengthy analysis, let's dive straight into the action plan: Where is the optimal entry point and what target is Gold aiming for? Check out the details below.
1. Market Structure Analysis: The Strength of the Bulls 🐂
Looking at the chart, the first thing that catches our eye is a series of "BoS" points (Break of Structure).
Every time Gold breaks a previous peak, it not only creates a Higher High but also confirms that the uptrend is very strong and sustainable. This indicates that buying power is completely dominant and shows no signs of weakening. Smart Money is continuously pushing the price higher, and our job is to ride this "wave."
2. Potential Buying Zones - Where to Catch the Wave? 🧐
To optimize profits and minimize risks, finding a beautiful entry point after a price correction is crucial. Based on the chart, we have 2 notable potential buying zones:
Buying Zone 1 - Fibonacci Confluence ($3885): This is an extremely ideal "Buy Zone," coinciding with the golden Fibonacci ratio of 0.618. In technical analysis, this is a very strong support level where prices tend to reverse and continue the main trend. Professional traders always hunt for pullbacks to this zone.
Buying Zone 2 - Exploiting FVG ($3914 - $3933): Slightly higher, we have the FVG (Fair Value Gap) area at $3914 and the "Buy Scalping" zone at $3933. These are "price gaps" created by supply-demand imbalances when prices rise too quickly. The market tends to return to fill these gaps before continuing its journey. This could be an opportunity for those wanting to catch an earlier wave.
3. Conquest Target - What's Gold's Next Destination? 🎯
Once we have a buying position, where will our target be?
Short-term target: The "Sell Scalping FVG" zone around $3969 could be a minor resistance point where some traders will take profits.
Main target: The ultimate destination this structure is aiming for is the "Sell Gold Liquidity" zone at $3998. This is a critical "liquidity" area, concentrating many stop-loss orders from the Sellers. Prices are often attracted to these zones like a "magnet" to sweep liquidity before making further moves.
Summary & Advice
Main trend: UP.
Primary strategy: Buy on dip when prices correct to key support zones.
Potential buying zones: $3885 (Fibonacci) and $3914 - $3933 (FVG).
Price targets: $3969 (short-term) and $3998 (main target).
Always remember, risk management is the key to surviving in the market. Set reasonable Stop-loss for every trade.
WHAT DO YOU THINK ABOUT THIS PLAN?
Will Gold retrace to the Fibonacci zone $3885 or react right at the FVG zone $3914? Leave your thoughts and perspectives in the comments below. Let's discuss together to find the best opportunities!
👇 Don't forget to Like 👍 and Follow my TradingView channel to not miss daily Gold analysis!

Gold Breaks $3900: Safe-Haven Demand Soars & Fed Fuels the Rally📊 Market Context
Gold has smashed through the psychological $3,900 barrier, reaffirming its dominance as the ultimate safe-haven asset.
US government shutdown → drives defensive capital flow into gold.
Fed expected to cut rates by 0.25bps → further strengthens gold’s appeal as a non-yielding asset.
Data gap due to the shutdown → traders now rely on private reports, adding uncertainty and keeping gold in the spotlight.
👉 With the USD under pressure, capital fleeing risky assets, and FOMO from buyers intensifying, gold is well-positioned to target the 3950–3990 zone in the short term.
🔎 Technical Analysis (H1/H4)
Primary trend: Strong uptrend, price holding above the ascending channel.
BUY ZONE 1: 3904–3902 → CP Volume Zone, strong support for continuation.
BUY ZONE 2: 3885–3883 → Retest of old ATH breakout zone.
SELL Zone: 3949–3950 → Liquidity Zone, possible false breakout/trap.
Extended Target: 3994 (Fib 3.618).
🔑 Key Levels
BUY Zones: 3904–3902, 3885–3883
SELL Zone: 3949–3950
Resistance: 3950, 3994
Support: 3900, 3880
📈 Scenarios & Trading Plan
✅ BUY ZONE 1: 3904–3902
SL: 3898
TP: 3910 - 3915 - 3925 - 3935 - 3945 - ???
✅ BUY ZONE 2: 3885–3883
SL: 3878
TP: 3895 - 3905 - 3920 - 3935 - 3945 - ???
⚠️ SELL ZONE (scalp/trap): 3949–3950
SL: 3955
TP: 3940 - 3935 - 3925 - ???
⚠️ Risk Management Notes
Price may sweep liquidity above 3950 before pulling back → wait for confirmation price action.
Avoid chasing highs – priority remains buying dips into key support zones.
Keep position sizing moderate ahead of unexpected Fed comments or policy shocks.
✅ Summary
Gold is in its “golden phase” of bullish momentum: political uncertainty + dovish Fed + safe-haven demand = BUY remains the core strategy. Preferred entries sit at 3904–3902 and 3885–3883, with upside potential stretching toward 3950–3990. Short-term SELL setups only valid as liquidity traps near resistance.
📢 Follow MMFLOW TRADING for real-time updates and BIGWIN setups every session!

Gold FOMO Surge – 1000-Pip Buy Chance Ahead!GOLD PLAN FOR 06.10 | Captain Vincent
✳️ Hello to all traders,
Today, we are not only analyzing Gold (XAU/USD) from a purely technical perspective ⚙️, but also witnessing the perfect confluence between technicals and fundamental news. A price surge storm is forming, promising exciting trading opportunities.
📊 1. Technical Analysis: Sustainable Uptrend Structure
Technically, the uptrend of Gold on the H1 frame is indisputable.
🔹 Break of Structure (BoS):
Gold continuously breaks previous highs, indicating that buying pressure is completely overwhelming.
Each BoS point is a clear affirmation of the strength of the uptrend.
🔹 Potential Demand Zone:
After each surge, the price often takes a "rest" to accumulate.
Currently, the price may adjust to the $3,883,020 - $3,905,169 zone, where the confluence between the Fair Value Gap (FVG) and Bullish Order Block (Bullish OB) – creates an ideal launchpad for the next surge.
🏦 2. Fundamental Analysis: The Fire Has Been Ignited
If technicals show the way, then fundamental news is the fuel propelling the uptrend.
🔸 U.S. Government Shutdown:
This event creates political and economic instability, causing capital to flee from risky assets.
Gold – the number 1 safe haven – is directly benefiting as investors seek to preserve assets.
🔸 Fed Ready to Cut Interest Rates:
The market is almost certain that the Fed will cut interest rates by 0.25%.
This reduces the appeal of the USD, further strengthening Gold's advantage, which is a non-interest-bearing asset.
🔸 "Thirst" for Economic Data:
The government shutdown also disrupts the release of important economic data, leaving the market lacking information and increasing uncertainty.
In this environment, Gold continues to maintain its role as a safe haven.
🎯 3. Comprehensive Trading Plan
When technicals and fundamentals align, the reliability of the trading strategy is significantly enhanced.
Strategy:
Wait to buy (Long) when the price adjusts to the demand zone $3,883,020 - $3,905,169.
Entry signals:
Observe confirmation of a bullish reversal in this zone such as:
Pin bar candles, engulfing
Or BoS on the M15 frame
Targets:
Short-term: $3950 – $3990
Long-term: Target “+1000 pips”
Risk management:
Place Stop Loss below the Bullish OB zone to protect the account.
🧭 Conclusion
The current market sentiment is very favorable for the Buyers:
USD is under downward pressure
Defensive capital flows strongly into Gold
The FOMO effect may stimulate an extended rally
The combination of solid technical structure and strong fundamental support is creating an almost perfect bullish picture.
👉 Be patient, stick to the plan, and await this golden opportunity.
💼 Wishing you all an effective and victorious trading day!

Daily Plan: Gold Targets 7th Straight Weekly Gain📊 Market Context
Gold holds firm above $3,850, aiming for its 7th consecutive weekly gain.
🔥 Main driver: Risks from a prolonged U.S. government shutdown.
📉 54% probability of the shutdown lasting 29 days (Polymarket) → directly impacting gold sentiment.
🛡️ Safe-haven demand & BUY-side FOMO keep fueling momentum.
⚖️ Still, profit-taking at higher resistance zones could trigger sharp swings before the next directional move.
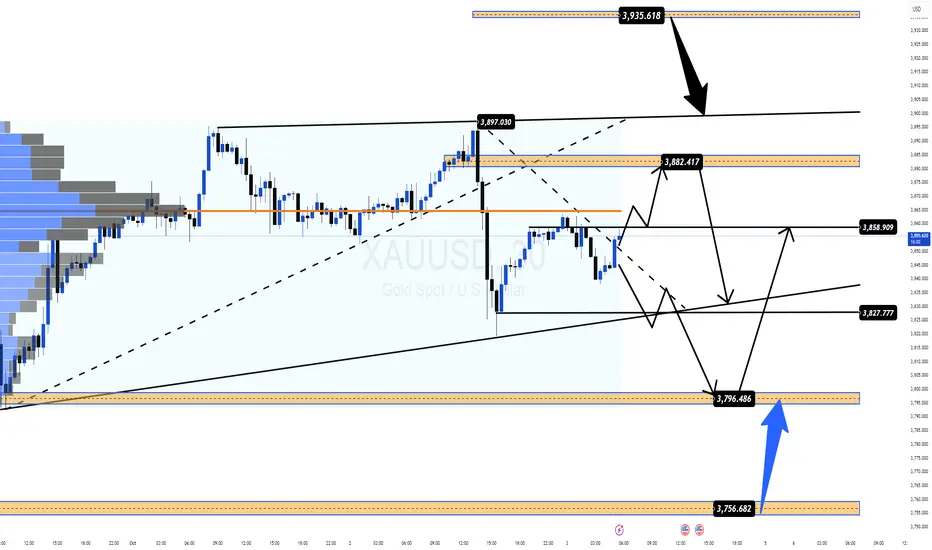
🔎 Technical Analysis (H1/H4)
📈 Main trend: Bullish, but consolidating near 3,850.
🚧 Key Resistances: 3882–3884 & 3934–3936 (Liquidity Sell Zones).
🏦 Key Supports: 3797–3795 & 3756–3754 (Buy Zones).
🎯 Key Levels: 3850 – 3880 – 3900.
📈 Trading Scenarios & Plan
✅ SELL ZONE 1: 3882–3884
SL: 3890
TP: 3878 – 3874 – 3870 – 3865 – 3860 – 3850 – 3840 – ???
✅ SELL ZONE 2: 3934–3936
SL: 3940
TP: 3930 – 3925 – 3920 – 3910 – 3900 – ???
✅ BUY ZONE 1: 3797–3795
SL: 3790
TP: 3800 – 3810 – 3820 – 3830 – 3840 – ???
✅ BUY ZONE 2: 3756–3754
SL: 3750
TP: 3760 – 3770 – 3780 – 3790 – 3800 – ???
⚠️ Risk Management Notes
🌀 U.S. shutdown headlines may spark unexpected volatility.
🕵️♂️ Focus on BUY setups at support, avoid chasing FOMO at highs.
❌ Consider SELL only if clear rejection signals form at resistance zones.
✅ Summary
Gold remains supported by safe-haven flows, eyeing a 7-week winning streak.
🎯 Strategy:
BUY setups: 3797–3795 & 3756–3754.
SELL setups: 3882–3884 & 3934–3936.
📢 Follow MMFLOW TRADING for real-time updates & BIGWIN setups!
(XAU/USD) – Gold to reach $4,000/oz: Where is the best buy point1. Price Structure & Main Trend
On the H1 timeframe, gold still maintains a bullish structure with higher highs and higher lows.
After the Break of Structure (BoS), price retraced to test the Buy Zone around 3,862 and bounced back up.
Currently, price is trading above both EMA34 and EMA89, confirming that the uptrend remains dominant.
2. Key Zones
Buy Zone: 3,862 – 3,865. Short-term support, aligned with the previous BoS. If price holds above this zone, the bullish scenario is strengthened.
Order Block (OB) 1: 3,806 – 3,810. Next support zone if the Buy Zone is broken.
Order Block (OB) 2: 3,763 – 3,770. Deeper support, activated only in case of a strong correction.
Sell Scalping Zone (Fibo): around 3,912. A potential short-term resistance where profit-taking may occur.
Sell Zone / ATH: 3,933 – 3,935. Breaking above this area may lead gold to a new all-time high.
3. Trading Scenarios
Bullish (Main Scenario):
Look to buy at 3,862 – 3,865 if price retests.
SL: Below 3,850 (under Buy Zone and EMA89).
TP1: 3,912 (Sell Scalping Zone).
TP2: 3,933 – 3,935 (new ATH).
Bearish (Defensive Scenario):
If price breaks below Buy Zone and closes under 3,860, it may test OB 3,806 – 3,810.
In a worse case, if OB1 is also lost, short-term bullish momentum could weaken, pushing gold to OB 3,763 – 3,770.
4. Summary
Gold on H1 maintains strong bullish momentum after breaking structure. The optimal plan is to prioritize buying at key support, manage risk tightly, and gradually take profit at resistance zones. If price surpasses 3,933, gold may enter a new all-time high phase.

New ATH Above 3800 & FOMO Buying Still Driving the MarketXAUUSD – Daily Plan| MMFLOW TRADING
📊 Market Context
Gold has once again set a new all-time high above 3800 USD/oz, showing no signs of losing bullish momentum. The surge is fueled by strong FOMO buying flows, as traders continue to pile into safe-haven assets.
Concerns about a possible US government shutdown and renewed discussions around tariff policies have weighed on the dollar, while expectations of upcoming Fed rate cuts keep gold supported. Meanwhile, Fed speeches and incoming US data remain key drivers that could inject short-term volatility, but the broader bullish narrative remains intact.
🔎 Technical Analysis (H1/H4)
Price is firmly holding above the 3800 psychological level, confirming the breakout.
Buy zones remain intact at 3790–3792 and 3784–3782, with solid demand expected on any dip.
Sell liquidity sits around 3823–3825, where short-term profit-taking or traps may emerge before the next leg higher.
🔑 Key Levels
Resistance / Sell Zone: 3823–3825
Support / Buy Zones: 3790–3792, 3784–3782
📈 Scenarios & Trading Plan
BUY ZONE 1: 3790–3792
SL: 3786
TP: 3795 - 3800 - 3810 - 3820 - 3830 - ???
BUY ZONE 2: 3784–3782
SL: 3778
TP: 3790 - 3795 - 3800 - 3810 - 3820 - 3830 - 3840 - ???
SELL ZONE (Liquidity Trap Zone): 3823–3825
SL: 3830
TP: 3818 - 3814 - 3810 - 3805 - 3800 - ???
⚠️ Risk Notes
Beware of liquidity sweeps near 3823–3825 before continuation higher.
Fed comments and macro data may cause sudden spikes — adjust risk accordingly.
Stick to confirmation entries around zones to avoid being trapped by false moves.
✅ Summary
Gold is riding strong FOMO-driven bullish momentum, printing new highs above 3800. Main bias: buy on dips at 3790–3782, while monitoring short-term sell liquidity at 3823–3825 for potential pullbacks. The broader trend remains bullish, so patience and disciplined entries will be key.
📢 Follow MMFLOW TRADING for live updates, liquidity insights, and high-probability setups!

Fed Cut Hopes & Geopolitical Risks Fuel Gold Rally📊 Market View
Gold is holding its bullish tone, trading firmly above 3750 USD/oz and refreshing daily highs in the European session. Investor sentiment is being lifted by rising expectations that the Federal Reserve will continue rate cuts into year-end, lowering borrowing costs and strengthening demand for non-yielding assets like gold. Meanwhile, geopolitical risks keep safe-haven flows alive, further reinforcing gold’s momentum.
🔎 Technical Analysis (H1/H4)
Price structure remains bullish above 3750, supported by trendline dynamics.
Buy liquidity zones identified at 3742–3740 (major demand) and 3757–3755 (scalp entry).
Key short-term resistance sits around 3778, with extended liquidity targets towards 3813–3815.
A rejection from the 3813–3815 sell zone could trigger pullbacks into demand areas.
🔑 Key Levels
Resistance: 3778 ➡️ 3813–3815
Support / Buy Zones: 3757–3755 ➡️ 3742–3740
📈 Scenarios & Trading Plan
✅ BUY ZONE (Main Setup): 3742–3740
SL: 3735
TP: 3748 ➡️ 3752 ➡️ 3756 ➡️ 3760 ➡️ 3770 ➡️ 3780 ➡️ …
✅ BUY SCALP (Aggressive Entry): 3757–3755
SL: 3750
TP: 3762 ➡️ 3766 ➡️ 3780 ➡️ …
✅ SELL ZONE (Liquidity Trap): 3813–3815
SL: 3820
TP: 3810 ➡️ 3805 ➡️ 3800 ➡️ 3795 ➡️ 3790 ➡️ 3780 ➡️ …
⚠️ Risk Management Notes
Watch for fake breakouts near 3813–3815 — liquidity sweeps are common before reversal.
Prioritize long entries on confirmed pullbacks, avoid chasing price in the middle range.
Keep position sizing modest as volatility could spike on Fed commentary or geopolitical updates.
✅ Summary
Gold remains in a strong bullish phase, fueled by Fed rate cut expectations and geopolitical tensions. Strategy: buy dips at 3757–3755 or 3742–3740, targeting 3770–3780, while watching for short-term rejection at 3813–3815 for potential sells.
📢 Follow MMFLOW TRADING for live intraday updates, liquidity-based trading setups, and high-probability strategies on XAUUSD.

XAU/USD 23 September 2025 Intraday AnalysisH4 Analysis:
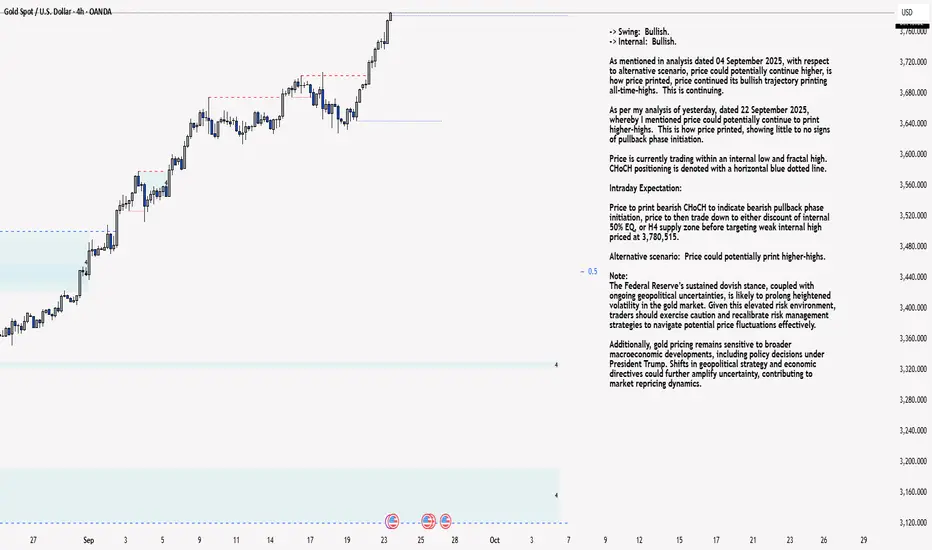
-> Swing: Bullish.
-> Internal: Bullish.
As mentioned in analysis dated 04 September 2025, with respect to alternative scenario, price could potentially continue higher, is how price printed, price continued its bullish trajectory printing all-time-highs. This is continuing.
As per my analysis of yesterday, dated 22 September 2025, whereby I mentioned price could potentially continue to print higher-highs. This is how price printed, showing little to no signs of pullback phase initiation.
Price is currently trading within an internal low and fractal high. CHoCH positioning is denoted with a horizontal blue dotted line.
Intraday Expectation:
Price to print bearish CHoCH to indicate bearish pullback phase initiation, price to then trade down to either discount of internal 50% EQ, or H4 supply zone before targeting weak internal high priced at 3,780,515.
Alternative scenario: Price could potentially print higher-highs.
Note:
The Federal Reserve’s sustained dovish stance, coupled with ongoing geopolitical uncertainties, is likely to prolong heightened volatility in the gold market. Given this elevated risk environment, traders should exercise caution and recalibrate risk management strategies to navigate potential price fluctuations effectively.
Additionally, gold pricing remains sensitive to broader macroeconomic developments, including policy decisions under President Trump. Shifts in geopolitical strategy and economic directives could further amplify uncertainty, contributing to market repricing dynamics.
H4 Chart:
M15 Analysis:
-> Swing: Bullish.
-> Internal: Bullish.
Price has continued with its bullish trajectory, printing all-time-highs.
Although price has printed a number of bearish CHoCH's, I will apply discretion and not classify them as such due to the insignificance of the pullback relative to recent price action.
Price is currently trading within an internal low and fractal high. CHoCH positioning is denoted with a blue horizontal dotted line.
Intraday Expectation:
Await for price to print bearish CHoCH, which is the first indication, but not confirmation of bearish pullback phase initiation.
Note:
Gold remains highly volatile amid the Federal Reserve's continued dovish stance, persistent and escalating geopolitical uncertainties. Traders should implement robust risk management strategies and remain vigilant, as price swings may become more pronounced in this elevated volatility environment.
Additionally, President Trump’s recent tariff announcements are expected to further amplify market turbulence, potentially triggering sharp price fluctuations and whipsaws.
M15 Chart:
How to operate the layout and don’t miss the golden opportunity!News: As expected, the Federal Reserve cut interest rates by 25 basis points on Wednesday and hinted at two more cuts this year, pushing gold to a record high above $3,700. The dollar's rebound from multi-year lows and rising Treasury yields have put some pressure on gold prices. The latest dot plot suggests another 50 basis point rate cut before the end of the year, but Powell expressed caution about the pace of rate cuts. The long-awaited moment has finally arrived. Despite persistently high inflation, the Fed has clearly shifted its policy focus to achieving full employment. The median forecast for the next two years indicates that the Fed plans to cut interest rates by 25 basis points each year. The forecast range for the end-2026 interest rate is 2.6% to 3.9%. Policymakers expect the unemployment rate to reach 4.5% in December this year and fall to 4.4% by the end of 2026. The market will then focus on Thursday's economic data, including US initial jobless claims and the Philadelphia Fed manufacturing index, as well as policy moves from the Bank of England and the Bank of Japan, which may cause short-term fluctuations in gold prices.
Gold Trend Analysis: Gold's bullish trend remains intact, and the overall outlook remains bullish, but there is still a risk of medium-term correction. Therefore, when trading, consider waiting for a pullback to go long. After the ups and downs of Monday, Tuesday, and Wednesday this week, gold has twice tested the 3707 high, only to experience significant pullbacks after both attempts. In particular, after the Federal Reserve's interest rate decision, market buying sentiment subsided, and gold fell to a low of 3645. Therefore, it is unlikely that gold will continue to rise in the short term, or even break new highs. Therefore, gold is likely to experience a period of volatile correction in the near term, and there is no need to overestimate the market after the interest rate decision.
From a technical perspective, the daily chart closed at a high level, but failed to break through the unilateral moving average support. Therefore, it is unclear whether gold will reverse its trend. At most, it is showing signs of weakening, forming a high-level consolidation. The key support level below is 3620. A break below 3620 and a series of daily declines, breaking through the unilateral moving average, would indicate potential for a significant decline. The H4 Bollinger Bands are currently converging, with the moving averages converging, indicating a very clear volatile trend. The support point between the lower Bollinger Band and the 60-day moving average is near 3635. Unless this level is broken, it will be difficult to pull the lower Bollinger Band apart, leading to a unilateral decline. Gold surged and then retreated, reaching a low near 3645. Therefore, support points below are very clear, with 3635 and 3620 as key support points. Assuming the overall trend remains unchanged, the principle of buying on dips to key support points is bullish. Focus on 3675, 3690, and 3710 above. Thursday and Friday are likely to see continued high-level fluctuations in the bullish trend.
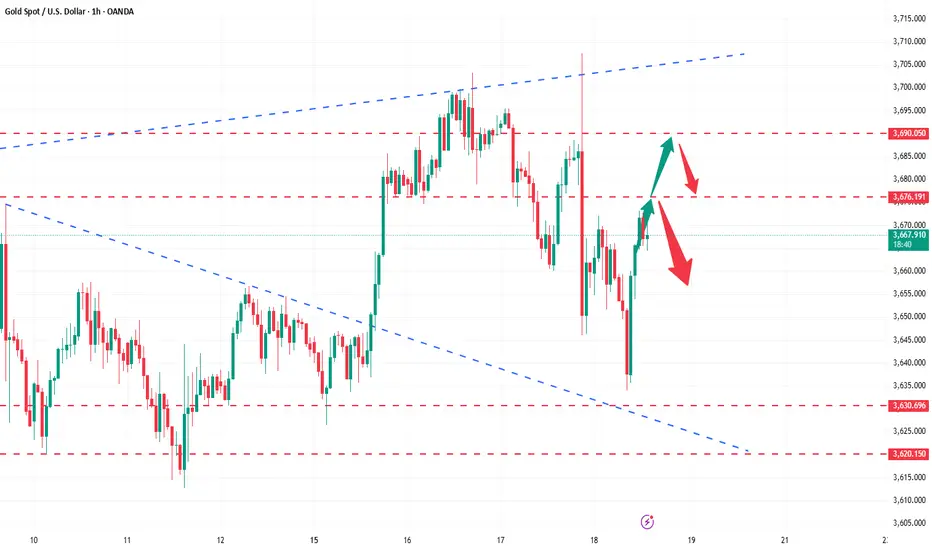
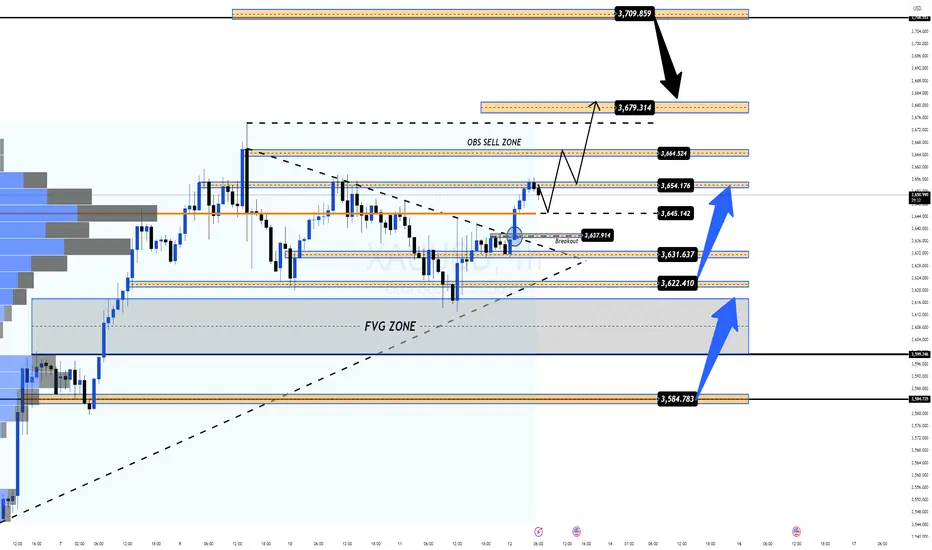
Breakout Confirmed, Macro Drivers & Key Liquidity Zones 🚀 XAUUSD | MMFLOW TRADING
📊 Market Context & Macro View
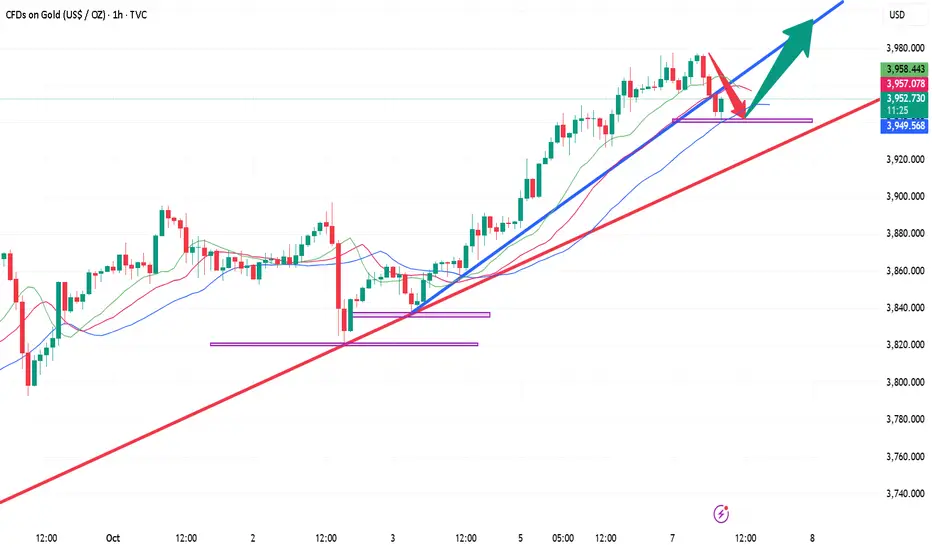
Gold (XAUUSD) has confirmed a breakout above its short-term descending trendline, signalling renewed bullish momentum after several sessions of compression. This move comes as traders price in slowing US inflation and increasing confidence that the Federal Reserve could pause or even ease monetary policy in the coming months.
🔹 Macro Drivers Supporting Gold:
US CPI & PPI softness → Indicates cooling inflation, reinforcing expectations for stable or lower rates.
Treasury yields steady, while a weaker USD provides an additional tailwind for gold prices.
Geopolitical tensions and central bank accumulation continue to underpin long-term bullish sentiment.
⚠ Risk: Liquidity sweeps remain a possibility ahead of next week’s Fed meeting—watch for false breakouts and sharp reversals.
🔑 Key Technical Levels (H1)
Immediate Resistance: 3,654.17 (React Zone FIB)
OBS Sell Zone: 3,664.52
Upper Liquidity Target: 3,679.31
Major Sell Liquidity: 3,709.85
Supports / Buy Liquidity Zones:
• 3,637.91 – Breakout Retest
• 3,631.63 – CP Support
• 3,622.41 – Deeper Liquidity Layer
• 3,584.78 – END Liquidity BUY ZONE
📈 Scenario & Outlook
London Session: Expect a retest of breakout zones (3,638–3,632) for liquidity collection before another potential leg higher.
A clean break through 3,654 → 3,664 could trigger fresh buying momentum toward 3,679–3,709.
Failure to hold 3,622 would expose deeper support at 3,584 as the next key level.
📌 Trading Plan
🔵 BUY ZONE 1: 3,635 – 3,633
SL: 3,629
TP: 3,640 → 3,645 → 3,650 → 3,660 → 3,670 → ???
🔵 BUY ZONE 2: 3,621 – 3,619
SL: 3,615
TP: 3,625 → 3,630 → 3,635 → 3,640 → 3,650 → 3,660 → ???
🔴 SELL ZONE: 3,708 – 3,710
SL: 3,715
TP: 3,704 → 3,700 → 3,695 → 3,690 → 3,680 → ???
🔴 SELL SCALP: 3,679 – 3,681
SL: 3,685
TP: 3,675 → 3,670 → 3,665 → 3,660 → ???
✅ Summary
Gold is holding its breakout above key levels, supported by softer US inflation data and a weaker USD. Liquidity sweeps may occur in the near term, but the broader trend remains bullish as long as 3,622 holds.
👉 Follow MMFLOW TRADING for real-time updates, liquidity scenarios, and BIGWIN trade setups as gold reacts to macro drivers and critical technical zones.
A pullback is an opportunity, go long decisively!Yesterday, the technical analysis of gold first declined and then rose. It was suppressed below the 3650 mark during the Asian and European sessions and showed a continuous decline. It further accelerated its decline before the European and US sessions, breaking through the 3630 mark, and continued to decline to around 3613 to stabilize and rebound. It rebounded strongly during the US session and finally closed above the 3630 mark with a small negative fluctuation. The overall price still held the 3610 mark, forming a support and stabilization pattern. After the opening of today, gold once again rose and broke through the 3640 mark. In the short term, it has experienced continuous retracements to test the 3610 mark support, which is still valid. The long position at the daily level is continuing well, and it is expected to further impact the previous high of 3675 resistance area. Today, the short-term support below is around 3630-3620, and the important support is 3610. If it falls back to this position during the day, the main bullish trend will remain unchanged. The short-term bullish strong dividing line is 3600. If the daily level stabilizes above this position, the rhythm of falling back to low and long and following the trend will continue. The specific execution plan of the counter-trend short order will be updated as soon as possible according to the real-time trend, and I will remind everyone to respond flexibly to ensure that every step of the operation is carried out under controllable risks. Remember to pay attention in time.
Gold operation strategy: Go long when gold falls back to around 3630-3620, with the target at 3650-3660. Continue to hold if it breaks through.

CPI data is confusing,gold is fluctuating in a bearish directionGold Technical Analysis: Looking back at the recent trend, gold surged and then retreated on Tuesday, forming a shooting star pattern. However, the decline did not continue on Wednesday, indicating that the pullback was merely a one-off adjustment and lacks sustainability. It is a normal correction after a significant rally. Even if the market peaks, it will not be so simple. It will at least undergo a process of "high-level fluctuations turning bearish" or "second upward attack to lure more investors and then decline." In the short term, the rebound will continue to fluctuate, and it is unlikely to see significant rises or falls in a short period of time. Looking at the daily gold chart, the daily gold line has slowed down slightly. After continuous large volume, the daily line has turned into a small Yinxing candlestick pattern for consolidation. There is a need for a short-term pullback. Considering the short-term chart, the second high-point test failed to break through the previous high, the previous continuous large volume without a pullback, and the pressure from the second upward test. If there is no new high in the short term, there will be a partial correction around 3675-3657. The pattern will determine whether it is a deep pullback or a sideways consolidation.
Judging from the 4-hour gold chart, yesterday's gold price failed to achieve results in its attempt to rise again. There are signs of a downward correction. The 4-hour chart lost the middle track, breaking the unilateral upward momentum. At the same time, there is a need to further retrace to the lower track. Combined with the second high in the hourly chart near 3657, the second pressure turned into a decline. The strong market is to retrace and then break the high. Once the breaking power is stopped, it will go into a shock correction. Overall, today's short-term gold operation strategy recommends shorting on rebounds as the main strategy, and buying on pullbacks as the auxiliary strategy. The short-term focus on the upper side is the 3640-3650 resistance line, and the short-term focus on the lower side is the 3610-3600 support line.
Bulls vs Bears: Race to 3700 or 3600 ?!Currently, gold is fluctuating above the 3640 line. We can clearly see that gold has not effectively fallen below 3640 during multiple pullbacks in the short term. This proves that during the pullback period of gold, a lot of funds have entered the market, thereby pushing the gold price to fluctuate upward. However, during the upward fluctuation, gold encountered resistance and fell back in the 3655-3660 area many times, exacerbating the short-term volatility trend!
But we need to note that gold has rebounded since 3620 and formed a band-like low point structure; and it has tested 3640 many times and has not fallen below it, showing signs of forming a band-like secondary low point structure. Judging from the characteristics of the low point gradually rising, the current bullish force has a slight advantage, so short-term trading is still dominated by going long on gold.
Judging from the current structure, the short-term support area below is located in the 3635-3625 area, followed by the 3615-3605 area; and the short-term resistance is located near 3660. If gold breaks through the area near 3660 during the volatile upward process, gold may test the high point area near 3675. Once the high point near 3675 is refreshed again, it is expected to directly touch around 3700.
Therefore, it is not completely certain that gold has peaked at present, and we should not blindly chase short gold in trading; on the contrary, when gold retreats to the support area of 3635-3625, we can try to go long on gold, first aiming at the target area: 3660-3670, and once it breaks through this area, the target area will be postponed to the 3690-3700 area.

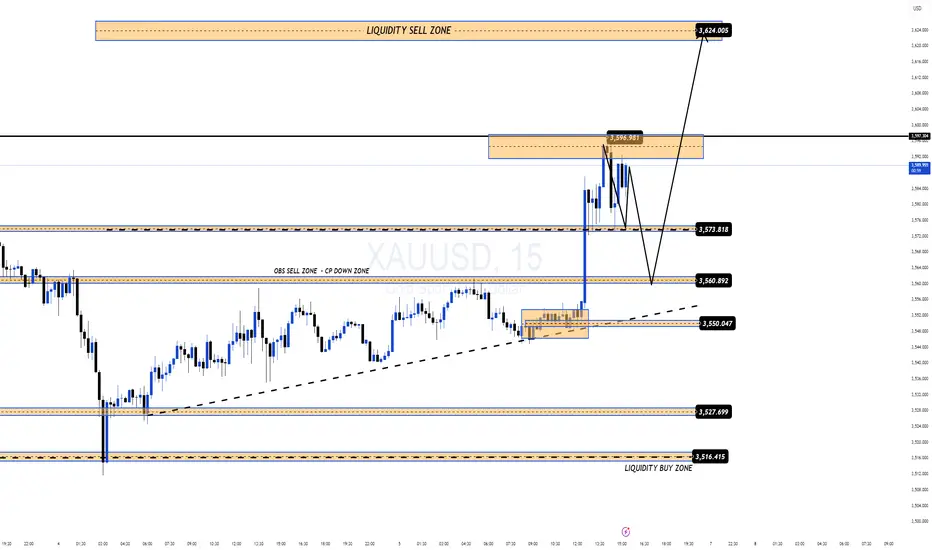
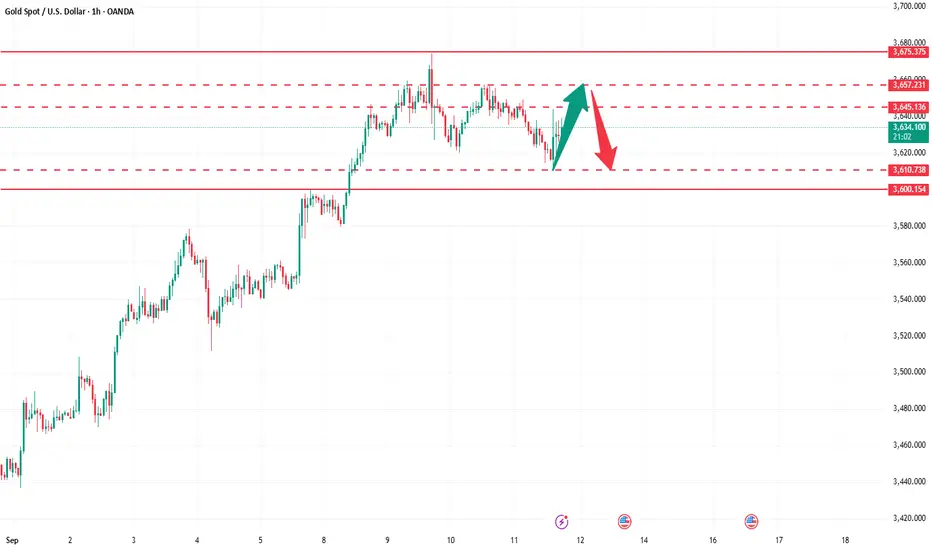
XAUUSD – Weekly Plan: Bullish Bias with Key Levels Ahead MMFLOW TRADING PLAN XAUUSD
Market View:
Gold (XAUUSD) is moving exactly as projected in our weekly plan. After Nonfarm pushed price close to $3600/oz ATH, gold has been consolidating around the 357x–358x zone while holding the ascending trendline. Both the Daily and Weekly charts remain strongly bullish, showing no signs of profit-taking. This confirms that buyers are still in control, and the upside bias remains intact.
👉 However, with key US data (Core PPI, CPI, Jobless Claims, UoM Sentiment) coming up this week, short-term volatility is expected. Traders should watch closely how gold reacts around critical support and resistance zones.
Technical Outlook (H1 Chart):
Price is consolidating sideways, respecting the bullish structure.
Holding above 3574–3550 keeps the bullish momentum alive, targeting higher liquidity zones at 3620–3640+.
A break below 3530 could trigger a deeper pullback before buyers step back in.
Trading Plan:
🔵 BUY ZONE: 3552 – 3550
SL: 3544
TP: 3556 → 3560 → 3565 → 3570 → 3575 → 3580 → ????
🔵 BUY SCALP: 3573 – 3571
SL: 3567
TP: 3578 → 3582 → 3586 → 3590 → ????
🔴 SELL SCALP: 3598 – 3600
SL: 3604
TP: 3595 → 3590 → 3585 → 3580 → 3570 → 3560 → ????
🔴 SELL ZONE: 3631 – 3633
SL: 3638
TP: 3626 → 3622 → 3618 → 3614 → 3610 → 3600 → ????
Summary:
✅ Gold is respecting the bullish outlook from our weekly plan.
👉 Key levels to watch: 3592 (bullish trigger) and 3575 (bearish trigger). As long as price holds above 3550, the bias remains to the upside.
Follow MMFLOW TRADING for daily updates and execution setups.

XAUUSD – Post-NFP Big Win & Key Levels to Watch | MMFLOW TRADINGNonfarm Payrolls pushed gold (XAUUSD) to a new ATH near $3600/oz. After reacting sharply at the 3593–3595 liquidity sell zone, price dropped more than 200 pips before bouncing back quickly to retest the previous ATH and climbing again towards 359x, showing strong bullish momentum still in play.
Short-Term Outlook (US Session Close):
Upside momentum remains dominant, but the market now stands at two critical key levels that will define the next move.
Key Levels:
Bullish trigger: 3592 → A clean breakout above this zone could fuel further upside towards the next liquidity area around 362x.
Bearish trigger: 3575 → A break below this level may open a deeper pullback to fill the Nonfarm liquidity gap around 3550–3527.
Trading Plan:
BUY bias: Hold above 3592 → look for longs targeting 3610–362x.
SELL scalp: Break below 3575 → shorts towards 3550–3527.
Always apply strict risk management (SL just beyond the nearest key level).
Summary:
✅ After a 200+ pips BIGWIN on Nonfarm, gold retains strong momentum.
👉 Watch the 3592 & 3575 zones closely – they are the decision points for the next major move.
Follow MMFLOW TRADING for timely updates and trade setups!