GOLD 4H CHART ROUTE MAP UPDATE & TRADING PLAN FOR THE WEEKHey Everyone,
Please see our updated 4h chart levels and targets for the coming week.
We are seeing price play between two weighted levels with a gap above at 4124 and a gap below at 4042. We will need to see ema5 cross and lock on either weighted level to determine the next range.
We will see levels tested side by side until one of the weighted levels break and lock to confirm direction for the next range.
We will keep the above in mind when taking buys from dips. Our updated levels and weighted levels will allow us to track the movement down and then catch bounces up.
We will continue to buy dips using our support levels taking 20 to 40 pips. As stated before each of our level structures give 20 to 40 pip bounces, which is enough for a nice entry and exit. If you back test the levels we shared every week for the past 24 months, you can see how effectively they were used to trade with or against short/mid term swings and trends.
The swing range give bigger bounces then our weighted levels that's the difference between weighted levels and swing ranges.
BULLISH TARGET
4124
EMA5 CROSS AND LOCK ABOVE 4124 WILL OPEN THE FOLLOWING BULLISH TARGETS
4212
EMA5 CROSS AND LOCK ABOVE 4212 WILL OPEN THE FOLLOWING BULLISH TARGET
4328
EMA5 CROSS AND LOCK ABOVE 4328 WILL OPEN THE FOLLOWING BULLISH TARGET
4422
EMA5 CROSS AND LOCK ABOVE 4422 WILL OPEN THE FOLLOWING BULLISH TARGET
4494
BEARISH TARGETS
4042
EMA5 CROSS AND LOCK BELOW 4042WILL OPEN THE FOLLOWING BEARISH TARGET
3964
EMA5 CROSS AND LOCK BELOW 3964 WILL OPEN THE FOLLOWING BEARISH TARGET
3873
EMA5 CROSS AND LOCK BELOW 3873 WILL OPEN THE SWING RANGE
3767
3646
As always, we will keep you all updated with regular updates throughout the week and how we manage the active ideas and setups. Thank you all for your likes, comments and follows, we really appreciate it!
Mr Gold
GoldViewFX
Goldtradingstrategy

THE KOG REPORTTHE KOG REPORT:
In last week’s KOG Report we gave the potential path as well as the red box defence to look for any reaction in price. We managed to support the lower red box defence giving us a nice long to start the week then resulting in the higher defence holding and giving us an extremely decent short. It was only during the later part of the week we faced some choppy and whipsawing ranging which we decided wasn’t worth committing too much into, so we returned to scalping the red boxes only for the remainder of the week.
A decent week in Camelot, not only on Gold but the numerous other pairs we trade and analyse.
So, what can we expect in the week ahead?
It’s likely to be another week of choppy price action and potential for a range to develop even smaller than we’ve seen in previous sessions. We have the key level of support below again at 4040 while resistance above sits at key level of 4104. Economic news on Tuesday should bring volume and we would expect one of these levels to break open and the range to have accumulated enough to then move us into a clear direction.
We have added the red box defence up and down, ideally wanting a test of that low, so price going up on the open could represent opportunities to attempt the short unless defence is breached. Otherwise, we’ll look to take this into that 4000-3980 levels before we look for any RIPs.
RED BOXES:
Break below 4060 for 4055, 4050, 4041, 4033 and 4010 in extension of the move
Break above 4081 for 4095, 4103, 4120 and 4130 in extension of the move
Please do support us by hitting the like button, leaving a comment, and giving us a follow. We’ve been doing this for a long time now providing traders with in-depth free analysis on Gold, so your likes and comments are very much appreciated.
As always, trade safe.
KOG

Seize the opportunity to short sell at high levels.Technically, gold closed last week in a range-bound manner, and short positions once again yielded good profits. Shorting in the 4080-4100 range, focusing on selling at higher levels, offered considerable profit potential. Given the overall bearish structure on the 4-hour chart, the strategy of buying low and selling high within the lower range, relying on strong resistance and support (primarily shorting), was also favorable for those who went long. However, given the overall bearish trend, going long against the trend is generally cautious and should be avoided, especially chasing rallies in the middle. There's not much to say technically; the overall strategy remains to patiently sell on rallies. Intraday, if there's another rebound, shorting in batches within the 4080-4100 range can be considered.

Economic growth concerns may be overstated.Gold Technical Analysis: Last week, gold traded in a range. Monday saw a decline, Tuesday saw a dip to a weekly low near 3998 before rebounding to a positive close, Wednesday saw a rise followed by a fall, resulting in a small-bodied positive candle with a long upper shadow, and Thursday and Friday saw doji candles. The weekly chart ultimately closed with a small negative candle with upper and lower shadows, indicating continued short-term consolidation. Looking at the intraday chart, Friday saw another doji, reaching a high near 4101. The previous high of 4110 was not broken, and after a quick rise, the price returned to around 4050, clearly showing a tug-of-war between bulls and bears. This week, the market has been relatively quiet, with no major data releases. Given the limited movement in gold last week, consistently trading in a range from relatively low to high levels, a clear trend is not yet emerging.
Since the daily chart showed a pullback from around 4132, each subsequent decline has been followed by a rebound after testing the bottom. Therefore, this is a strong rebound, not a reversal. However, without a major positive catalyst, the previous resistance level of 4110 will be difficult to overcome. The rebound last Friday, followed by another surge driven by news, has likely extended the adjustment period. Today, Monday, there are no major news catalysts, and the consolidation and fluctuations at the weekly and weekly levels are not yet over. Therefore, the trading strategy for gold today remains range-bound, continuing the 4000-4130 range. The trading strategy is to maintain a short-selling approach, paying close attention to key levels. For now, gold is unlikely to experience significant price movements; a market stimulus is needed to break out with strong directional momentum. In summary, the recommended trading strategy for gold today is primarily to sell on rallies, with buying on dips as a secondary approach. The key resistance level to watch in the short term is 4100-4130, and the key support level is 4030-4000. Please follow the trend closely.

Gold continued to fluctuate on November 24th.Gold is currently trading on the hourly chart, with short-term moving averages remaining flat and converging, compressing the price between 4000-4120 and further narrowing the range to 4100-4130. Based on the current trend, the US session is likely to maintain a slightly range-bound movement. On the hourly chart, the price has broken out of the previous low-level consolidation range, and the candlestick pattern is gradually maintaining a slightly stronger upward trend along the short-term moving averages, suggesting potential for further short-term gains. However, the strength of these gains needs to be assessed, and attention should be paid to any short-term corrections or adjustments.
XAU/USD – Gold Under Heavy Pressure, 4,000$ Break Looks ImminentGold continues to slide as the US Dollar strengthens, fueled by resilient US data. With markets waiting for the final week of November and the upcoming FOMC decision, safe-haven flows remain weak—making XAU/USD extremely vulnerable to further downside.
📊 Technical Outlook – H1/H30
The short-term structure remains clearly bearish:
1️⃣ Trend Bias: Bearish
Price keeps rejecting the descending trendline.
Every pullback is shallow and absorbed quickly by intraday supply zones.
2️⃣ Key Technical Levels
Resistance / Supply Zones:
4,078 – 4,089
4,104 (major confluence: Fibo + H1 supply)
Support / Liquidity Targets:
4,023 – 4,013
3,989 – 3,975 → major liquidity zone (high reaction probability)
3️⃣ Scenarios to Watch
🔻 Scenario 1 — Continuation Drop (Primary Bias)
Break below 4,044 → targets 4,023, then the liquidity sweep at 3,99x – 3,97x.
🔄 Scenario 2 — Pullback Before Drop
Retracement to 4,054 – 4,078 → rejection → continuation lower.
🔺 Scenario 3 — Deeper Recovery (Low Probability)
Only valid if price closes above 4,104, unlocking a move toward 4,13x – 4,15x.
🎯 MMF Trading Plan
SELL – Trend-Following (Primary)
Sell Zone 1: 4,054 – 4,078
SL: 4,105
TP: 4,023 → 4,013 → 3,99x
Sell Zone 2: 4,089 – 4,104
SL: 4,112
TP: 4,054 → 4,023
BUY – Only as a Reaction Trade (Liquidity Sweep)
Buy Zone: 3,99x – 3,97x
SL: 3,955
TP: 4,023 → 4,054
⚠️ Buy setups are counter-trend and require strong confirmation.
Primary bias remains SELL as long as price stays below 4,104.
⚜️ MMFLOW TRADING View
Gold is being pushed toward the psychological 4,000$ support.
A clean break could trigger a broader bearish expansion into 3,98x – 3,95x.
With month-end positioning, FOMC expectations, and shifting Fed sentiment, volatility is likely to increase sharply.
Stay with the trend—SELL the rallies. BUY only at deep liquidity zones with confirmation.

Gold's bullish and bearish trends were perfectly timed this weekGold Technical Analysis: Gold prices have been fluctuating between 4000 and 4110 in recent days, lacking a clear direction. This volatile market requires both caution and opportunity searching. Neither long nor short positions are inherently wrong; the key is precise entry points. Based on this week's closing price, gold reached a high of 4101 before retracing and closing at 4065. Next week, continue to monitor the range-bound movement. The monthly chart for gold may close with a doji, and next week will likely see continued range-bound trading. The weekly chart also shows a doji, indicating no clear direction. While the overall trend remains bullish, the pullback is not yet complete. Looking at the weekly chart alone, next week we temporarily recommend buying low and selling high within the 4110-4020 range until it is broken. A break above this range could lead to 4130-4150 or even 4200, while a break below could target 4000-3980. Strong support is at 3930, with an extreme low around 3886. The daily chart closed with a doji on Friday, so continue with a range-bound trading strategy on Monday.
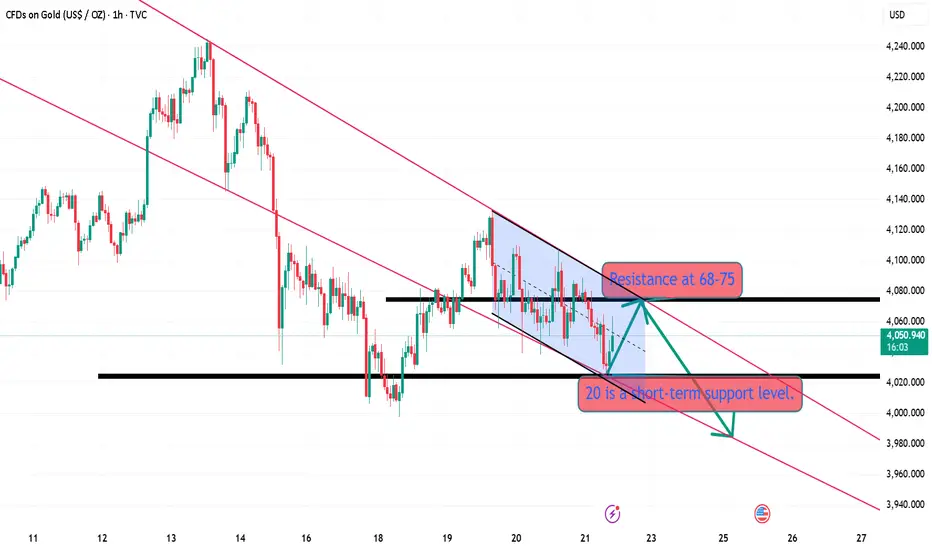
Looking at the 4-hour chart, it is currently consolidating near the end of a triangle pattern. Once it breaks out effectively, there is an estimated profit potential of nearly $250. Before the breakout, operate within the trading range. Go long near the lower edge of the range around 4020 and go short near the upper edge around 4110. Go short a little earlier, around 4100. On the hourly chart, the moving averages are crossing upwards, indicating a bullish alignment. Currently, 4020 is a key short-term support level. If it holds, it will likely remain within the range. A break below this level could see strong support at the 4000 mark. The 4110 level also presents significant resistance; several attempts to break through have failed. However, this level is expected to gradually narrow over time. The longer the consolidation period, the stronger the subsequent breakout. The fundamentals of the bull market remain unchanged, and there is still room for further upward movement. In summary, the recommended trading strategy for gold is to primarily buy on dips and secondarily sell on rallies. The key resistance level to watch in the short term is around 4100-4110, while the key support level is around 4020-4000. Traders must follow the market closely, manage their positions carefully, and strictly adhere to stop-loss orders. Avoid holding losing positions. For specific trading instructions, please refer to the bottom notifications.

Buy gold on dips on November 24th.In the short term, the daily chart is currently showing signs of weakness, with moving averages turning downwards and the price breaking below the daily mid-band. Therefore, the intraday outlook is likely to be a decline followed by a rise, and our strategy should follow this pattern: short first, then long. For support, we still expect entry around 4025, with a stop-loss at 4005. Upside targets are 4050-80 and 4100. For shorting, we can wait for a rebound to around 4075 before entering, with a stop-loss above 4090. Pay close attention to the strength of the European session. If the European session is strong, buy on dips before the US session; if the European session is weak, sell on rallies before the US session, targeting a bottoming out and rebound.
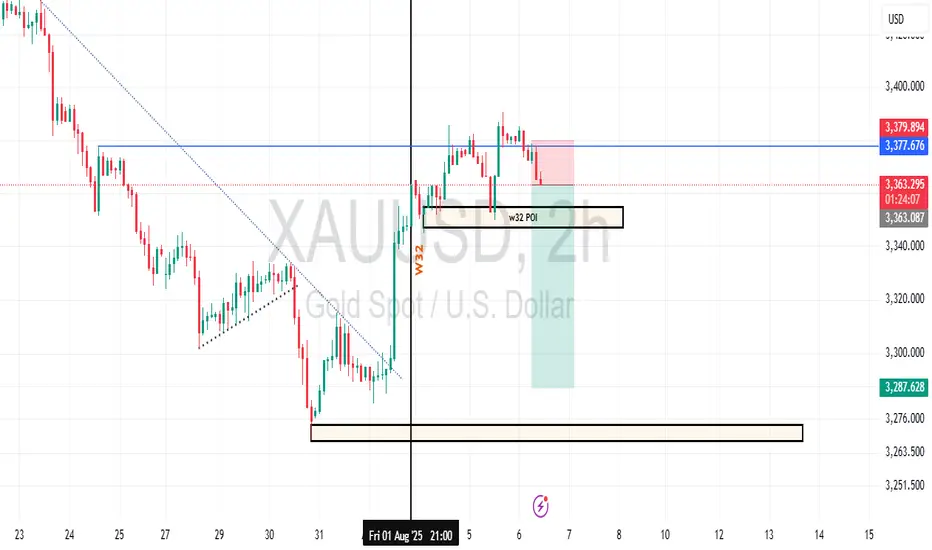
Gold Week 32 Possible reversalGold prices are in a clear downtrend, with critical support at $3,287.628 and resistance at $3,379.874. The 'W32 POI 2H' on Aug 1 highlighted a volatile 2-hour period with a sharp drop and recovery, signaling potential support strength. Fibonacci retracement levels could play a key role in identifying retracement targets. Stay disciplined with risk management as you navigate these levels.
Gold rebound presents an opportunity,Why wait and do nothing?Following the release of supplementary US non-farm payroll data for September, the relatively strong job growth coupled with a resurgence in the unemployment rate has once again created a contradictory situation in the market. This has also led to growing disagreement within the Federal Reserve regarding whether to continue cutting interest rates in December. Judging from the recent tone of Fed officials' speeches, most officials lean towards a conservative and cautious approach, believing that maintaining the current interest rate is appropriate. The recent performance of the US dollar index best illustrates this point, putting significant pressure on gold, which has repeatedly weakened. However, there is clear buying interest at lower levels, with each sell-off followed by a rapid rebound, though the momentum has been weak. Intraday, gold retraced to around 4060, quickly rebounded to around 4080, and then fell back again. During the European session, it broke below the key short-term support around 4040, accelerating its decline and briefly touching around 4022. It then fluctuated before gradually stabilizing around 4030. Currently, the US session has seen another rapid rebound, mirroring yesterday's pattern. The recommended strategy is to look for opportunities to short after rallies. The short-term tone is set, and market sentiment is destined to be weak; at least avoid excessive shorting at lower levels.
Gold Trading Strategy: Sell gold in batches around 4080-4100, with a target of 4060-4030.
GOLD DAILY CHART ROUTE MAPHey everyone,
Here’s the Daily Chart idea we’ve been tracking. The swing move into 4145 has now produced a candle body close above that level, which keeps the long term gap open toward 4325. We also saw a rejection with a candle body close below 4145, leaving 3165 open beneath. However, note that this rejection touched the channel half line, which based on our uniquely drawn goldturn channel typically provides strong support.
We’re seeing that support play out now with a bounce off the half-line.
At the moment, our key levels are:
Primary support: Channel half-line
Secondary support: 3961
Primary resistance: 4145
Long range gap target: 4325, which becomes more significant if we see the EMA5 cross and hold above 4145.
We’ll keep everyone updated as the week progresses.
Mr Gold
GoldViewFX

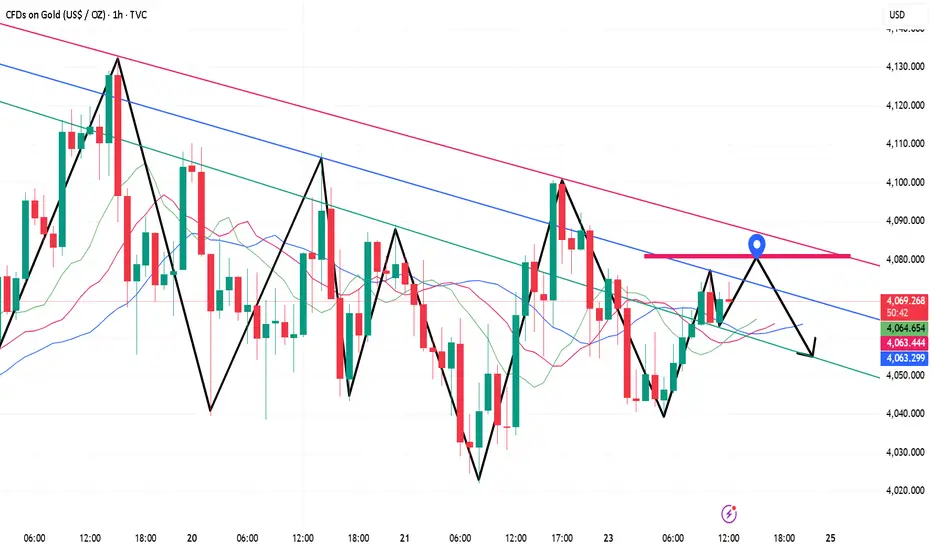
Gold continues to fluctuate; is it brewing a major move?Gold prices remained range-bound yesterday, reaching our suggested shorting points and support levels. The highest point reached was around 4110, before falling back to around 4040 in the US session before rebounding. The day closed with a bearish doji candlestick, a signal of a potential breakout. A breakout today would likely lead to further continuation of the downward trend. After a quick rebound to around 4088, prices fell again, with key support around the previous low of 4020. This level represents the last line of defense for the bears; a breach here would open up further downside potential, with the next target around 4000. However, this is only the first small target; a further break below this level could lead to a retest of the previous low of 3900.
The overall trend is currently weak and volatile. During the decline or rise, unexpected patterns may emerge. What we need to do now is patiently wait for the price to reach the resistance level or break out of the narrow range before following suit. Avoid blindly chasing highs and lows, as this could lead to losses during the consolidation phase. If gold rebounds to around 4065-4080, consider shorting, targeting 4050-4030. If it breaks through this level during the European session, look for opportunities to short during the US session rebound.

Gold Weekly Closes on November 21; Rebound Still BearishGold prices rebounded quickly to around 4088 after opening before continuing to fall. Key support lies around the previous low of 4020, which is the last line of defense for the bulls. A breach of this level would open up further downside potential, with the next target likely around 4000. However, this is only the first small target; a further break below this level could lead to a retest of the previous low of 3900.
From the 4-hour chart, the key resistance level to watch is 4076-85, while the key support level is 4020-25. Technically, a pullback is more likely. We will patiently wait for key entry points.
Focus on opportunities to buy on dips.My thoughts on today's gold price movement!
From a technical perspective, gold is currently still consolidating at high levels, with the consolidation narrowing. Gold will face a choice in the near future. Looking at the price action, yesterday's US session saw gold prices rebound to a high below 4110 before encountering resistance and trending lower again. This area remains a significant resistance zone, and it's a key resistance level for short sellers to watch. Since the price hasn't broken through this level yet, we should continue to analyze the consolidation, buying low and selling high. The main resistance level is around 4100-4110. Therefore, if gold prices directly retest the 4100-4110 area and a clear bearish pattern forms, short positions can be initiated. However, if the price breaks strongly above this area, it's best to avoid short positions. Conversely, if the price first falls to test the 4040-4120 support level, long positions can be considered.

XAU/USD Near Breakdown – Bears Eying Liquidity SweepGold remains under pressure after a stronger-than-expected NFP print reduced near-term Fed rate-cut expectations.
The USD stays moderately supported, while weak risk sentiment keeps gold in a cautious, defensive phase.
📊 Technical Snapshot (H1–M30)
Price continues to reject the descending trendline and the supply zone 4,054–4,078.
Lower highs structure intact → bearish momentum remains dominant.
Liquidity pockets sit at 4,013 and especially 3,989, a key downside magnet.
Any pullback toward 4,054 is likely just a retest before continuation lower.
🎯 MMF Intraday Plan
Primary Bias: SELL – follow the trend
Sell 4,054–4,078
SL: 4,090
TP: 4,013 → 3,989 → 3,975
Countertrend BUY (only at deep liquidity):
Buy 3,985–3,990
SL: 3,972
TP: 4,013 → 4,054
⚡️ MMF View
As long as price stays below the trendline and lower-high structure, gold remains in distribution.
A sweep of the 3,99x liquidity zone is highly likely before any meaningful reversal can form.

Gold awaits non-farm payroll data for direction!Gold Technical Analysis: Today's highly anticipated non-farm payrolls report is a major event. This isn't just any ordinary employment data; it's the first employment report released since the US government reopened, drawing immense attention. Why is this non-farm payrolls data so crucial? Consider this: during the government shutdown, many economic data couldn't be released normally. Now that the government is finally back, this data is like a ray of light in the darkness, illuminating the latest situation in the US job market. Moreover, it will have a key impact on the Federal Reserve's future monetary policy direction, meaning it could potentially create significant volatility in the financial markets. Looking at Tuesday's ADP data, the focus is undoubtedly on weak employment and increased expectations of interest rate cuts. While there's already much speculation and analysis in the market, no one can guarantee the data will turn out well. If the data far exceeds expectations, it could give the US dollar a strong boost. How will the stock market, gold, and commodity markets react? If the data falls short of expectations, will expectations of a Fed rate cut intensify further? All these questions will be answered today.
Gold prices have fluctuated wildly these past two days, but this is in line with our expectations, and the market has cooperated. We've perfectly timed our long and short positions, and congratulations to those who followed our advice. After a morning surge followed by a pullback, gold has entered a period of low-level consolidation, continuing its back-and-forth movement. However, gold is likely to remain range-bound before the Non-Farm Payrolls report, so patience is key while waiting for the data. We've repeatedly bought gold around 4050-4030, and the expected rebound yielded several profits. Now, we're just waiting for the Non-Farm Payrolls report. Market conditions are constantly changing, and gold is currently consolidating within a large range, with the possibility of a sudden reversal. More patience, perseverance, and waiting are needed. Don't be impatient; haste makes waste. Let's witness together what kind of waves the Non-Farm Payrolls report will create in the US session.

GOLD 4H CHART ROUTE MAP UPDATE & TRADING PLAN FOR THE WEEKHey Everyone,
Please see our updated 4h chart levels and targets for the coming week.
We are seeing price play between two weighted levels with a gap above at 4124 and a gap below at 4042. We will need to see ema5 cross and lock on either weighted level to determine the next range.
We will see levels tested side by side until one of the weighted levels break and lock to confirm direction for the next range.
We will keep the above in mind when taking buys from dips. Our updated levels and weighted levels will allow us to track the movement down and then catch bounces up.
We will continue to buy dips using our support levels taking 20 to 40 pips. As stated before each of our level structures give 20 to 40 pip bounces, which is enough for a nice entry and exit. If you back test the levels we shared every week for the past 24 months, you can see how effectively they were used to trade with or against short/mid term swings and trends.
The swing range give bigger bounces then our weighted levels that's the difference between weighted levels and swing ranges.
BULLISH TARGET
4124
EMA5 CROSS AND LOCK ABOVE 4124 WILL OPEN THE FOLLOWING BULLISH TARGETS
4212
EMA5 CROSS AND LOCK ABOVE 4212 WILL OPEN THE FOLLOWING BULLISH TARGET
4328
EMA5 CROSS AND LOCK ABOVE 4328 WILL OPEN THE FOLLOWING BULLISH TARGET
4422
EMA5 CROSS AND LOCK ABOVE 4422 WILL OPEN THE FOLLOWING BULLISH TARGET
4422
EMA5 CROSS AND LOCK ABOVE 4422 WILL OPEN THE FOLLOWING BULLISH TARGET
4494
BEARISH TARGETS
4042
EMA5 CROSS AND LOCK BELOW 4042WILL OPEN THE FOLLOWING BEARISH TARGET
3964
EMA5 CROSS AND LOCK BELOW 3964 WILL OPEN THE FOLLOWING BEARISH TARGET
3873
EMA5 CROSS AND LOCK BELOW 3873 WILL OPEN THE SWING RANGE
3767
3646
As always, we will keep you all updated with regular updates throughout the week and how we manage the active ideas and setups. Thank you all for your likes, comments and follows, we really appreciate it!
Mr Gold
GoldViewFX

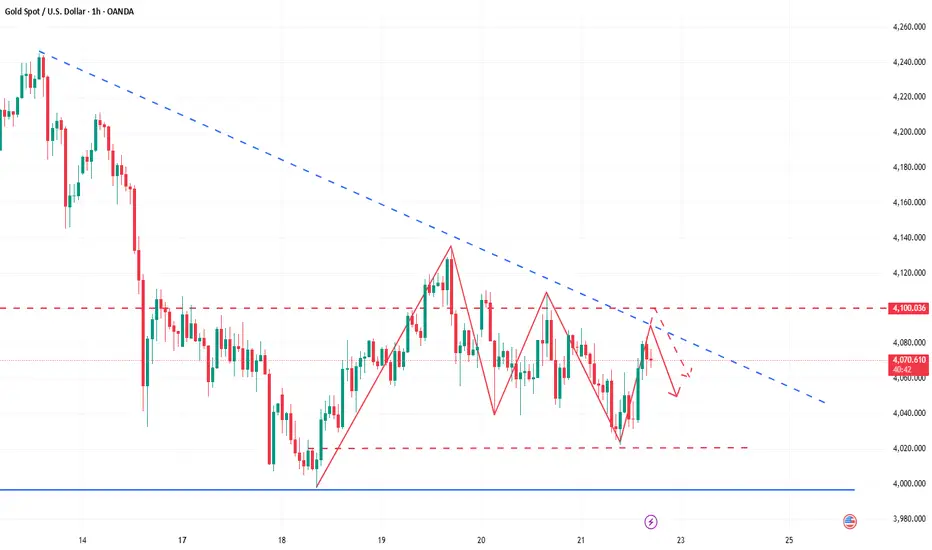
Gold Short-Term Technical Analysis (November 21st)With the release of the hawkish minutes from the Federal Reserve, the US dollar index climbed back above 100, suppressing gold prices. Yesterday, gold rebounded after testing a low near 4055 in the US session, then rallied slightly to around 4110 in the early morning before weakening again. In the Asian session, it broke lower, briefly touching around 4040. During the European session, it fell again, touching 4038 before stabilizing and rebounding. It has repeatedly tested the support around 4040 without breaking it, and is currently fluctuating.
11/22 Gold Short-Term Trading Strategy
Sell gold near 4085, with a stop-loss at 4095, targeting below 4070/60. Buy gold near 4044/5f, with a stop-loss at 4034, targeting 4070/80.

Gold prices fluctuated on November 20th, awaiting the non-farm pOn the hourly chart, gold continues to oscillate between 4000 and 4100. The current short-term trend is slightly weak, but not particularly strong. Before today's non-farm payroll data release, a strategy of buying low and selling high is recommended. Consider a small long position at 4040, targeting the 4080-4100 area. Short positions can be considered at resistance levels. The European session is expected to be relatively quiet; therefore, a cautious, small-position trading strategy is advised. Avoid chasing the market down; the potential downside is limited.
The timing for bullish entry has been precisely identified!Yesterday, the market experienced significant volatility, with gold prices surging to around 4132, a gain of 1.6%. However, as the US dollar index continued its upward trend and reached a near two-week high, coupled with hawkish signals from the latest Federal Reserve meeting minutes, market sentiment was severely dampened. Gold prices gave back all of the day's gains, ultimately closing only slightly higher at around 4077. Currently, investors' focus has completely shifted to the upcoming US September non-farm payroll report, hoping to find clear clues about future monetary policy and a new direction for gold.
From a technical perspective, on the daily chart, Friday's large bearish candlestick broke through key moving averages, setting the tone for a volatile week. Currently, the 5-day moving average area of $4120-$4130 has become a strong resistance level. If gold prices continue to be constrained by this level, the downside risk will significantly increase. The key support level is around $4050-$4030. If this level is effectively broken, it will confirm the continuation of the short-term correction trend, and gold prices may further test the important psychological level of $4000. However, the current price is still stable above the Bollinger Band's middle line, and the daily chart shows consecutive positive days, indicating that there is still some resilience in the market, and the bulls have not completely given up. Before the release of the key US non-farm payroll data, gold prices are expected to be trapped in a range-bound trading pattern. The subsequent upside potential depends on whether it can successfully break through the $4200 resistance level, while a deeper decline would require new negative fundamental factors to drive it.

XAU/USD: Gold in Downtrend, Waiting for Demand Surge⏰ Timeframe: 30m
📅 Update: 11/20/2025
🔍 Market Context
After the technical rebound at the beginning of the week, gold returns to adjust within the descending channel pattern, indicating that short-term upward momentum is temporarily weakening.
The current structure reflects a rebalancing state after the price was rejected at the 4,127 USD supply zone – coinciding with the 30-minute frame Supply Zone.
However, the Demand Zone below still plays an important role in maintaining the medium-term upward structure.
📊 Technical Structure
Supply Zone (4,127 USD): main resistance area, confluence with the nearest peak – where the price was strongly rejected during the Asian session.
OB Bearish (4,106 USD): short-term supply area, highly likely to be retested after completing the adjustment phase.
Demand Zone (4,013 USD): main support area in the descending channel, also the confluence point between the channel boundary and the lower liquidity zone.
Liquidity Sweep: signal indicating that lower liquidity has been absorbed, opening up the possibility of forming a higher low.
🎯 Market Outlook
High probability scenario:
1️⃣ Price continues to fluctuate within the descending channel, retesting the 4,013 USD Demand Zone.
2️⃣ If a clear price reaction occurs, the market is likely to break the channel, opening up a technical rebound to OB Bearish 4,106 USD or Supply Zone 4,127 USD.
3️⃣ Losing the 4,013 USD area will temporarily invalidate the rebound structure, bringing the price back to a lower balance area around 3,990 USD.
🧠 Analyst’s View
Gold is in a corrective pullback phase – where the market needs to regenerate liquidity before forming a new expansion wave.
A reasonable scenario is sweep – retest – expansion: sweep lower liquidity, retest the supply area, then determine the main trend for the end of the week.
Buyers still have a slight advantage as long as the Demand Zone is maintained.
🛡️ Risk Note
This is a phase of market liquidity accumulation, fluctuations may be erratic.

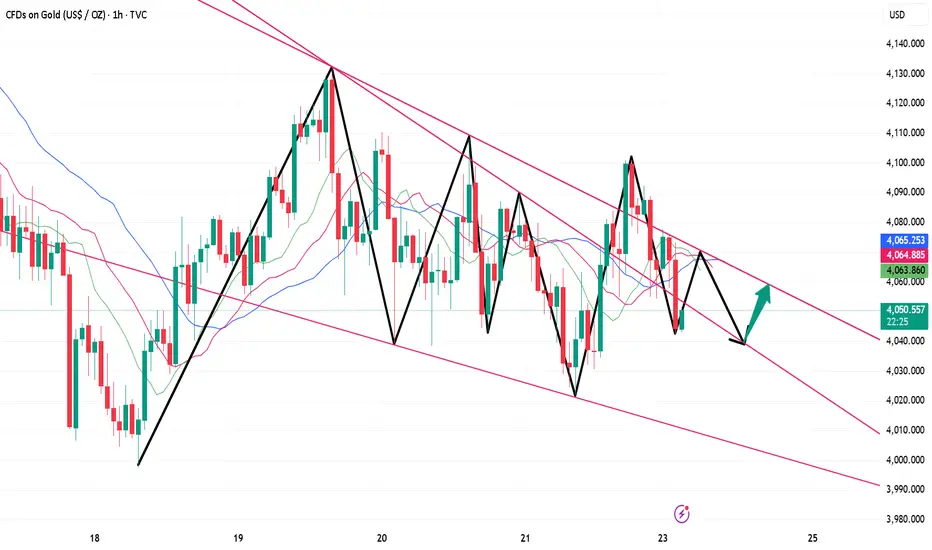
XAU/USD – Inverse H&S Forming, Gold Eyes Bullish Reversal🔍 Market Context
Early today, Gold dropped nearly 70 points, but immediately rebounded strongly from 4040, signaling aggressive BUY interest and a clear rejection of downside continuation.
On the H2 chart, XAU/USD is shaping a clean Inverse Head & Shoulders pattern — a classic reversal structure that often precedes a strong bullish expansion.
The macro layer for today is packed with high-impact catalysts:
📌 Key Data & Events – 20 Nov
Speech by U.S. President Donald Trump
Barkin (2027 FOMC voter) speaks on economic outlook
Federal Reserve FOMC Meeting Minutes
Williams (permanent FOMC voter) speech
U.S. Unemployment Rate
Non-Farm Payrolls (NFP)
Initial Jobless Claims
➡️ A heavy news lineup capable of triggering high volatility and validating (or rejecting) the reversal pattern.
📊 Technical Analysis – MMF View
Gold bounced sharply from BUY ZONE 4044–4046 with strong volume.
The market structure is creating a complete Inverse H&S formation.
The Neckline Zone 4101–4111 is the key breakout level — clearing this zone opens the door for a full bullish reversal.
Trendline compression + liquidity sweeps show buyers gaining control.
Strategy for today: BUY bias. SELL only for quick scalps.
🎯 MMF Daily Trading Plan
BUY (Priority Setup – Swing / Intraday)
Buy 4046–4048
SL: 4039
TP: 4060 → 4085 → 4100 → 4125
✔️ BUY aligns with the reversal pattern + fresh liquidity shift.
SELL (Scalping Only)
Sell 4146–4148
SL: 4154
TP: 4132 → 4120 → 4110
✔️ SELL only if price taps liquidity at upper supply and rejects clearly.
⚠️ Key Levels to Watch
4101 – 4111 – 4142 → liquidity clusters + breakout confirmation
4029 → major support in case volatility spikes from news
🧠 MMFLOW TRADING Outlook
If Gold holds its corrective pullback and breaks above the Neckline (4101–4111), we may see a strong continuation toward:
4146 → 4187 → 4210+
The Inverse H&S on H2 is a powerful bullish setup — smart positioning favors building long exposure and holding into high-impact events.

Don't miss this excellent opportunity to buy gold at low prices.In the current gold market, the price action is becoming clearer, with key support and resistance levels emerging. The 4050-4030 support zone deserves particular attention, as it offers strong support. If the price retraces to this level and successfully stabilizes, it would be an excellent entry point for long positions, potentially allowing bulls to launch an upward attack. Resistance is seen around 4110-4120. When the price first touches this area, it may face pullback pressure due to technical factors. However, if the price can consolidate and effectively hold above 4120, the possibility of further upward movement towards the 4150 target this week will significantly increase. Based on the current overall performance of gold, the market can be considered to be trading within the 4030-4120 range. The trading strategy should focus on buying on dips, taking advantage of rebounds from support levels to generate profits. At the same time, strict position control is crucial, as market conditions are constantly changing. Furthermore, it is essential to closely monitor real-time data and market dynamics to flexibly adjust trading strategies.
Gold trading recommendation: Buy gold in batches around the 4050-4030 range, with a target of 4080-4100.
