H1 bullish momentum intact | Buy 3,792–3,765, target 3,821🟡 XAU/USD – 29/09/2025 | Captain Vincent ⚓
🔎 Captain’s Log – Structure & Trend
H1 continues to print consecutive BoS → bullish trend sustained.
Price broke the long-term downtrend line and surged to new highs.
EMA 34 & EMA 89 both pointing up and below price → confirming short-to-mid-term bullish momentum.
📈 Captain’s Chart – Key Zones
Storm Breaker (Sell Zone / ATH test) : 3,818 – 3,821
Golden Harbor (FVG – Buy Zone) : 3,792 – 3,779
OB Harbor 1 : 3,772 – 3,765
OB Harbor 2 (deeper) : 3,731 – 3,724
Core Idea: 3,792 – 3,765 is the main support “cushion” for trend-follow Buys; 3,818 – 3,821 is the wave edge where profit-taking may occur.
🎯 Captain’s Map – Trade Plan
✅ Golden Harbor (BUY – main priority)
Buy Zone 1 – FVG (3,792 – 3,779)
Entry: 3,792 – 3,779
SL: 3,765
TP: 3,805 – 3,818 – 3,821+
Buy Zone 2 – OB1 (3,772 – 3,765)
Entry: 3,772 – 3,765
SL: 3,758 (below 3,765)
TP: 3,792 – 3,805 – 3,818 – 3,821
Buy Zone 3 – OB2 deep (3,731 – 3,724)
Entry: 3,731 – 3,724
SL: 3,714
TP: 3,745 – 3,765 – 3,792 – 3,805
⚡ Quick Boarding (SELL – scalp only)
Sell Zone – Storm Breaker (3,818 – 3,821)
Entry: 3,818 – 3,821
SL: 3,828
TP: 3,805 – 3,796 – 3,792
Breakdown Short (conditional)
Only consider Short if H1 closes below 3,724
SL: 3,735
TP: 3,710 – 3,700 – 3,690
⚓ Captain’s Note
“The Golden sails remain filled after consecutive BoS . Golden Harbor 🏝️ (3,792 → 3,765) is the anchor dock to board in trend’s direction. Storm Breaker 🌊 (3,818 – 3,821) may trigger profit-taking waves – only go Quick Boarding 🚤 if clear signals appear. If the tide drags below 3,724, let the ship retreat to OB2 to gather strength before resuming the northbound voyage.”
Goldtradingstrategy

Bulls Charge Ahead—Gold’s Path to 3835–3845Brothers, it seems that we were too conservative in setting the TP. Now gold has broken through 3810, far exceeding the TP: 3785 set in our last long transaction.
Because a large amount of safe-haven buying funds poured into the gold market, it continued to set new historical highs, stimulating gold to break through 3800 and continue its rise to above 3810, fully highlighting the strong bullish sentiment in the market. At present, with the support of fundamental factors that are bullish for gold, it is difficult for the gold market to reverse in a short period of time. At best, it is just a short-term adjustment.
In addition, we can look for wave patterns from the candlestick chart. From the previous trend, it is not difficult to see that after a short-term consolidation, gold will pull up and retrace to form a secondary low point, and then it will wave again to $75-80 to reach a new high. Then according to this rule, after the volatile rise, gold formed a secondary low near 3760 on Friday. If we look up to the fluctuation range of $75-80, gold is likely to continue to rise to the 3835-3845 area.
So, for current short-term trading. First of all, we still consider going long on gold.
1. If gold first retreats to the 3800-3790 area, we can prioritize going long on gold.
2. If gold continues its upward trend and first reaches the 3835-3845 area, we can consider going short on gold.

New ATH Above 3800 & FOMO Buying Still Driving the MarketXAUUSD – Daily Plan| MMFLOW TRADING
📊 Market Context
Gold has once again set a new all-time high above 3800 USD/oz, showing no signs of losing bullish momentum. The surge is fueled by strong FOMO buying flows, as traders continue to pile into safe-haven assets.
Concerns about a possible US government shutdown and renewed discussions around tariff policies have weighed on the dollar, while expectations of upcoming Fed rate cuts keep gold supported. Meanwhile, Fed speeches and incoming US data remain key drivers that could inject short-term volatility, but the broader bullish narrative remains intact.
🔎 Technical Analysis (H1/H4)
Price is firmly holding above the 3800 psychological level, confirming the breakout.
Buy zones remain intact at 3790–3792 and 3784–3782, with solid demand expected on any dip.
Sell liquidity sits around 3823–3825, where short-term profit-taking or traps may emerge before the next leg higher.
🔑 Key Levels
Resistance / Sell Zone: 3823–3825
Support / Buy Zones: 3790–3792, 3784–3782
📈 Scenarios & Trading Plan
BUY ZONE 1: 3790–3792
SL: 3786
TP: 3795 - 3800 - 3810 - 3820 - 3830 - ???
BUY ZONE 2: 3784–3782
SL: 3778
TP: 3790 - 3795 - 3800 - 3810 - 3820 - 3830 - 3840 - ???
SELL ZONE (Liquidity Trap Zone): 3823–3825
SL: 3830
TP: 3818 - 3814 - 3810 - 3805 - 3800 - ???
⚠️ Risk Notes
Beware of liquidity sweeps near 3823–3825 before continuation higher.
Fed comments and macro data may cause sudden spikes — adjust risk accordingly.
Stick to confirmation entries around zones to avoid being trapped by false moves.
✅ Summary
Gold is riding strong FOMO-driven bullish momentum, printing new highs above 3800. Main bias: buy on dips at 3790–3782, while monitoring short-term sell liquidity at 3823–3825 for potential pullbacks. The broader trend remains bullish, so patience and disciplined entries will be key.
📢 Follow MMFLOW TRADING for live updates, liquidity insights, and high-probability setups!

GOLD 1H CHART ROUTE MAP UPDATE & TRADING PLAN FOR THE WEEKHey Everyone,
Please see our updated 1h chart levels and targets for the coming week.
We are seeing price play between two weighted levels with a gap above at 3780 and a gap below at 3753. We will need to see ema5 cross and lock on either weighted level to determine the next range.
We will see levels tested side by side until one of the weighted levels break and lock to confirm direction for the next range.
We will keep the above in mind when taking buys from dips. Our updated levels and weighted levels will allow us to track the movement down and then catch bounces up.
We will continue to buy dips using our support levels taking 20 to 40 pips. As stated before each of our level structures give 20 to 40 pip bounces, which is enough for a nice entry and exit. If you back test the levels we shared every week for the past 24 months, you can see how effectively they were used to trade with or against short/mid term swings and trends.
The swing range give bigger bounces then our weighted levels that's the difference between weighted levels and swing ranges.
BULLISH TARGET
3780
EMA5 CROSS AND LOCK ABOVE 3780 WILL OPEN THE FOLLOWING BULLISH TARGETS
3802
EMA5 CROSS AND LOCK ABOVE 3802 WILL OPEN THE FOLLOWING BULLISH TARGET
3825
BEARISH TARGETS
3753
EMA5 CROSS AND LOCK BELOW 3753 WILL OPEN THE FOLLOWING BEARISH TARGET
3734
EMA5 CROSS AND LOCK BELOW 3734 WILL OPEN THE FOLLOWING BEARISH TARGET
3705
EMA5 CROSS AND LOCK BELOW 3705 WILL OPEN THE SWING RANGE
3683
3654
EMA5 CROSS AND LOCK BELOW 3654 WILL OPEN THE SECONDARY SWING RANGE
3622
3592
As always, we will keep you all updated with regular updates throughout the week and how we manage the active ideas and setups. Thank you all for your likes, comments and follows, we really appreciate it!
Mr Gold
GoldViewFX

GOLD 4H CHART ROUTE MAP UPDATE & TRADING PLAN FOR THE WEEKHey Everyone,
Please see update on our 4H chart idea from last week, which is playing out as analysed and still valid to continue to track for the coming week.
After completing our Bullish targets last week with ema5 cross and lock confirmation, we are now seeing price play between 3738 and 3778. . We will need to see ema5 cross and lock on either of these two weighted level to determine the next range.
We will also now use lower Goldturns for support and Bounce until we see further cross and lock above for a continuation.
We will keep the above in mind when taking buys from dips. Our updated levels and weighted levels will allow us to track the movement down and then catch bounces up.
We will continue to buy dips using our support levels taking 20 to 40 pips. As stated before each of our level structures give 20 to 40 pip bounces, which is enough for a nice entry and exit. If you back test the levels we shared every week for the past 24 months, you can see how effectively they were used to trade with or against short/mid term swings and trends.
The swing range give bigger bounces then our weighted levels that's the difference between weighted levels and swing ranges.
BULLISH TARGET
3696 - DONE
EMA5 CROSS AND LOCK ABOVE 3696 WILL OPEN THE FOLLOWING BULLISH TARGETS
3738 - DONE
EMA5 CROSS AND LOCK ABOVE 3738 WILL OPEN THE FOLLOWING BULLISH TARGET
3778 - DONE
EMA5 CROSS AND LOCK ABOVE 3778 WILL OPEN THE FOLLOWING BULLISH TARGET
3811 -
EMA5 CROSS AND LOCK ABOVE 3811 WILL OPEN THE FOLLOWING BULLISH TARGET
3845
BEARISH TARGETS
3655
EMA5 CROSS AND LOCK BELOW 3655 WILL OPEN THE FOLLOWING BEARISH TARGET
3615
EMA5 CROSS AND LOCK BELOW 3615 WILL OPEN THE FOLLOWING BEARISH TARGET
3583
EMA5 CROSS AND LOCK BELOW 3583 WILL OPEN THE SWING RANGE
3546
3509
EMA5 CROSS AND LOCK BELOW 3509 WILL OPEN THE SECONDARY SWING RANGE
3458
3409
As always, we will keep you all updated with regular updates throughout the week and how we manage the active ideas and setups. Thank you all for your likes, comments and follows, we really appreciate it!
Mr Gold
GoldViewFX

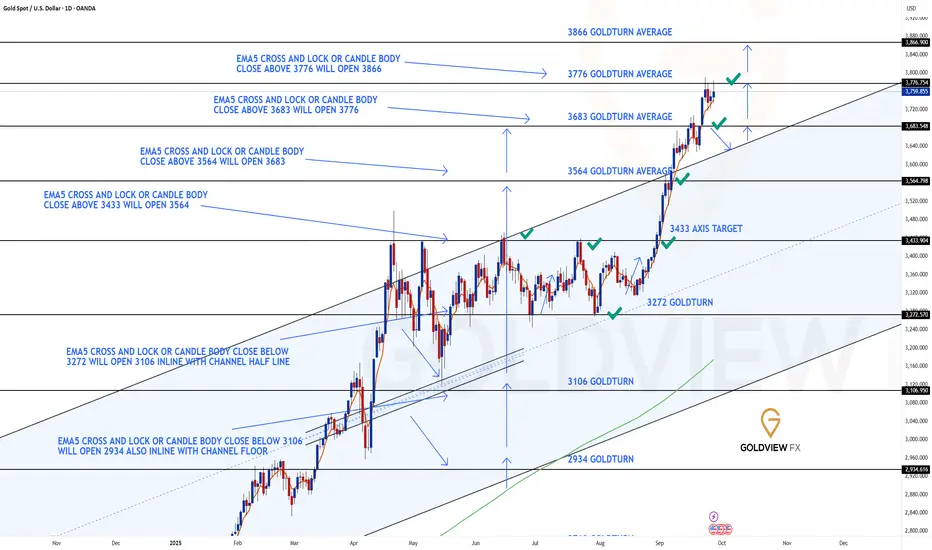
GOLD DAILY CHART ROUTE MAP UPDATEDaily Chart Update – Follow Up
3776 Target Achieved!!
Previously, we highlighted the importance of a candle body close above 3683, which opened the gap toward 3776. That target has now been hit with precision last week.
With 3776 now achieved, the key focus shifts to the daily close:
A sustained candle body close above 3776 will confirm the breakout and open the path toward 3866, especially if we see the EMA5 cross and lock in alignment.
For now, any rejection at this level would ideally see the channel top act as support, allowing room for a healthy correction while maintaining the broader bullish structure.
However, if price rejects and slips back into the channel, then range-bound play resumes within the channel zone.
Current Outlook
🔹 3683 Target Reached
Our breakout sequence played out with precision, starting from the EMA5 lock above 3564 and extending to complete the 3683 objective.
🔹 3776 Target Completed
Last weeks price action delivered the full upside completion into 3776. Now, new daily close will decide whether the breakout extends further into new ranges.
🔹 Key Inflection – 3776
Close above = breakout expansion toward 3866.
Rejection = retest of 3683 and channel top as support, or deeper channel play if momentum fades.
Updated Key Levels
📉 Support – 3683 & Channel Top
📉 Deeper Support – 3564 & 3433
📉 Pivotal Floor – 3272
📈 Resistance / Next Upside Objective – 3866 (on confirmed close and EMA5 lock above 3776)
As always, we will keep you all updated with regular updates throughout the week and how we manage the active ideas and setups. Thank you all for your likes, comments and follows, we really appreciate it!
Mr Gold
GoldViewFX
GOLD WEEKLY CHART MID/LONG TERM ROUTE MAPWeekly Chart Update – Follow Up
3732 Hit & Closed Above, 3806 Gap Opens
Previously we saw 3659 tested again with a weekly candle body close above the level, officially opening and completing 3732 last week.
Now, we’re closing above 3732, which leaves a long-range gap open at 3806 for the week ahead. This sets the stage for continued bullish progression but with correction risks still in play.
We must also keep in mind the possibility of a detachment correction back to 3659. Should momentum pick up during any such pullback, the channel top could align with the 3576 Goldturn to provide an additional zone of support and a potential springboard for continuation higher.
Current Outlook
🔹 3659 Retest & Close Above
Weekly close above 3659 confirmed strength and cleared the path higher.
🔹 3732 Objective Achieved
Target reached precisely after last week’s breakout, validating the continuation sequence.
🔹 3806 Range Gap Active
With a close above 3732, focus now shifts toward 3806 as the next upside range expansion.
🔹 Correctional Supports – 3659 & 3576
Detachment below highlights correctional risk. Both 3659 and 3576 (Goldturn) provide critical support zones, with the channel top acting as a confluence level for potential bounce.
Updated Levels to Watch
📉 Supports – 3659 & 3576 (correctional zones), deeper floor at 3482
📈 Resistance / Next Upside Objective – 3806
Plan
The bullish structure remains intact with upside potential toward 3806. A healthy correction into support zones (3659 / 3576) would help reset momentum while preserving the overall trend.
As always, staying flexible with structure and levels will be key heading into the week ahead.
Mr Gold
GoldViewFX

GOLD DAILY CHART ROUTE MAP UPDATEDaily Chart Update
3776 Target Achieved!!
A beautifully strong finish to the week, with our 1H and 4H chart ideas playing out, and now the daily chart projection completing perfectly.
Last week, we highlighted the importance of a candle body close above 3683, which opened the gap toward 3776. That target has now been hit with precision today – an awesome way to close the sequence.
With 3776 now achieved, the key focus shifts to the daily close:
A sustained close above this level would open the higher range above, confirming continued bullish strength.
A rejection here, however, would put support levels back into play at 3683 and the channel top.
Current Outlook
🔹 3683 Target Reached
Our breakout sequence played out with precision, starting from the EMA5 lock above 3564 and extending to complete the 3683 objective.
🔹 3776 Target Completed
Today’s price action delivered the full upside completion into 3776. Now, the daily close will decide whether the breakout extends further into new ranges.
🔹 Key Inflection – 3776
Close above = breakout range expansion.
Rejection = retest of 3683 and channel top support.
Updated Key Levels
📉 Support – 3683 & Channel Top
📉 Deeper Support – 3564 & 3433
📉 Pivotal Floor – 3272
📈 Resistance / Next Upside Objective – Sustained break above 3776 opens the range higher
🔥 What’s Next?
We’ll be back on Sunday with a fresh Daily chart idea, updated targets, and a full multi-timeframe analysis to guide the next leg of the journey. Stay tuned – momentum is only heating up from here!
Thank you for the continued support, and congratulations to everyone who rode this move with us.
Mr Gold
GoldViewFX

XAUUSD: Continuation of the pullbackPrice failed to break the Asian session high at 3,753 (no candle close above it). As a result, a deeper correction is likely before any new advance. The pullback targets are , and if extended, .
📉 Analysis
Wait for an Easy Trend sell signal on a break below the trendline with big volume.
Key resistance: , .
Key support: , , .
📊 Trading Plan
Wait for an Easy Trend confirmation when price breaks the trendline to the downside on strong volume, first target is 3717.
Example (SIGNAL): On 15m timeframe, price breaks the trendline with high volume — enter on the candle close, with the stop below the most recent swing low.
Risk management: Place the stop above/below the nearest 5m swing high/low, move to break-even at 1R (R:R = 1:1).
Please like and comment to support our traders. Your feedback motivates us to produce more analysis in the future 🙏✨

XAUUSD – Trading Plan: Gold Awaits PCE Catalyst📊 Market Context
Gold remains in consolidation mode after a sharp run earlier this week, holding steady below 3750. The market is now laser-focused on the US Core PCE Index, which could provide fresh direction for both the dollar and precious metals. With US yields stabilising and risk sentiment shifting, gold’s safe-haven appeal remains intact — but traders are weighing whether the recent pullback is a healthy correction or the start of a deeper retracement.
Meanwhile, the geopolitical backdrop continues to offer underlying support, while positioning in ETFs and futures suggests investors are cautious, awaiting clearer signals from the Fed. The upcoming data will likely decide whether gold breaks higher towards fresh highs or retests deeper liquidity zones.
🔎 Technical Analysis (H1/H4)
Price capped near short-term resistance at 3770–3772.
Immediate supports are 3741 and 3722, with deeper demand zones at 3690–3688 and 3670–3668.
The structure indicates possible liquidity sweeps before a decisive move.
🔑 Key Levels
Resistance / Sell Zone: 3770–3772
Support / Buy Zones: 3690–3688, 3670–3668
📈 Scenarios & Trading Plan
BUY ZONE 1: 3690–3688
SL: 3684
TP: 3695 - 3700 - 3710 - 3720 - 3730 - ???
BUY ZONE 2: 3670–3668
SL: 3664
TP: 3675 - 3680 - 3690 - 3700 - 3710 - ???
SELL ZONE: 3770–3772
SL: 3777
TP: 3765 - 3760 - 3750 - 3740 - ???
⚠️ Risk Notes
Watch for false breakouts at 3770–3772 before reversal.
PCE release may inject volatility across gold and USD pairs.
Position sizing and risk control are crucial into data.
✅ Summary
Gold is at a crossroads — safe-haven demand is still supportive, but technical resistance near 3770 remains a hurdle. Core strategy: buy dips into 3690–3670 zones, while staying cautious of short-term sell setups at 3770–3772. Manage exposure, wait for confirmation, and be prepared for volatility once PCE data hits.
📢 Follow MMFLOW TRADING for real-time updates and next-level trade setups.

3717 Won’t Hold—Gold’s Next Breakdown AheadThe highest point of gold during the day was around 3761. It can be clearly seen that as the bullish momentum of gold gradually declines, the high point of the candlestick chart is also gradually moving downward. Judging from the daily candlestick chart, a bearish candlestick chart appeared for the second consecutive day today, and it is very likely to close in a doji pattern, suggesting that gold is likely to continue to fall.
From the perspective of short-term morphological structure, gold has currently perfectly constructed a downward trend channel based on the wave top areas of 3790, 3778 and 3761; and upper shadows appear on many candlestick charts, suggesting that the selling pressure from above is relatively large, and the center of gravity continues to move downward and test the lower support area many times. Based on the current structure, 3717 is likely not the current low, and gold will continue to fall. The upper short-term resistance is in the 3750-3760 area; the lower support is in the 3715-3705 area, followed by the 3695-3690 area.
Therefore, for short-term trading:
1. Prioritize waiting for a gold rebound and then continue shorting gold within the 3750-3760 area; the short-term target is 3725-3715.
2. If gold first retreats to the 3715-3705 area, we can take advantage of the initial pullback and go long gold in that area, with the short-term target being 3730-3740.

How to accurately grasp gold trading opportunities?The market keeps falling, but we have no worries about taking profits. 3720 is the key short-term support level. Once it is effectively broken, gold is expected to accelerate its downward trend. For two consecutive days, we publicly suggested to arrange short orders near 3780 and 3760. Now the market has fallen sharply to the 3725 line, and we have achieved steady profits again. For two consecutive days, we accurately arranged short orders at the intraday high and steadily realized profits.
At present, gold is no longer in a unilateral upward trend, and the technical side has entered a repair stage. The operation idea is mainly to follow the trend, and the focus is on grasping the rhythm of bulls and bears. The most frequently asked questions recently are whether a big drop has begun and whether gold has peaked. From a structural point of view, although the daily line has been under pressure continuously, it closed in the negative yesterday and even formed a tombstone K-line pattern on the previous trading day, indicating that the short-term has encountered obvious suppression, but this cannot directly determine that the major trend has peaked. The weekly line is still dominated by bulls, and the short-term repair market has not destroyed the overall upward trend.
In terms of operation strategy, we still insist on shorting on rebound and long on pullback as a supplement. The lower support of the 4-hour chart focuses on the 3715-3700 area, and the upper pressure focuses on the 3760-3770 range. It is not advisable to blindly chase orders at the middle oscillation position. It is recommended to watch more and do less, and wait patiently for the key points to be confirmed before entering the market to seize the high winning rate opportunities.

Correction Not Enough,The Real Drop Is Yet to ComeGold began to retreat from 3778 yesterday, breaking through the key support levels of 3755, 3740 and even 3730, and hitting a low of around 3717, a drop of $60. In view of the recent continuous upward trend and the fact that it is near the 3800 mark, this is undoubtedly another heavy blow to the bulls.
From the perspective of morphological structure, gold may form a new downward trend channel with the help of high points near 3790 and 3778. If gold cannot successfully break through the 3755-3765 area during the rebound, it means that the gold downward trend channel may be successfully constructed, which will further stimulate gold to continue to decline.
As for the rising channel, gold is currently facing resistance in the 3760-3770 area. Before breaking through this area, gold bulls may still be weak. Then due to the technical resonance of the two channel resistances, it may be difficult for gold to easily break through the 3760-3770 resistance area at present.
So for short-term trading, we can start shorting gold at 3755-3765. If gold continues to rise within a limited space, we can consider adding positions.The short-term support area below is first focused on the 3740-3730 area, followed by the 3715-3705 area.

Gold's rise encountered resistance and launched adeep correctionGold maintains high-level fluctuations at the daily level, but the short-term trend shows weakness. The price on the 4-hour chart has fallen below the previous fluctuation range and is currently obviously constrained by the 3760-3770 pressure zone. The K-line continues to run below the short-term moving average. The overall structure shows a weak and volatile pattern. The recent rebound has approached the previous key pressure area. It is expected that the downward trend will most likely continue after the rebound repair is completed. Although a V-shaped reversal has formed in the smaller cycle, the price has stagnated near the pressure zone. The technical indicators show a top divergence signal, indicating that the short-term momentum is gradually weakening and there is a tendency to turn to adjustment again. The comprehensive technical aspect shows that gold faces downside risks in the short term. It is necessary to focus on the adjustment strength and the performance of the key support level below. The operation suggestion is to short on rallies. Focus on the rebound resistance of 3760-3770 on the top and the support of 3715-3700 on the bottom.

Fed Cut Hopes & Geopolitical Risks Fuel Gold Rally📊 Market View
Gold is holding its bullish tone, trading firmly above 3750 USD/oz and refreshing daily highs in the European session. Investor sentiment is being lifted by rising expectations that the Federal Reserve will continue rate cuts into year-end, lowering borrowing costs and strengthening demand for non-yielding assets like gold. Meanwhile, geopolitical risks keep safe-haven flows alive, further reinforcing gold’s momentum.
🔎 Technical Analysis (H1/H4)
Price structure remains bullish above 3750, supported by trendline dynamics.
Buy liquidity zones identified at 3742–3740 (major demand) and 3757–3755 (scalp entry).
Key short-term resistance sits around 3778, with extended liquidity targets towards 3813–3815.
A rejection from the 3813–3815 sell zone could trigger pullbacks into demand areas.
🔑 Key Levels
Resistance: 3778 ➡️ 3813–3815
Support / Buy Zones: 3757–3755 ➡️ 3742–3740
📈 Scenarios & Trading Plan
✅ BUY ZONE (Main Setup): 3742–3740
SL: 3735
TP: 3748 ➡️ 3752 ➡️ 3756 ➡️ 3760 ➡️ 3770 ➡️ 3780 ➡️ …
✅ BUY SCALP (Aggressive Entry): 3757–3755
SL: 3750
TP: 3762 ➡️ 3766 ➡️ 3780 ➡️ …
✅ SELL ZONE (Liquidity Trap): 3813–3815
SL: 3820
TP: 3810 ➡️ 3805 ➡️ 3800 ➡️ 3795 ➡️ 3790 ➡️ 3780 ➡️ …
⚠️ Risk Management Notes
Watch for fake breakouts near 3813–3815 — liquidity sweeps are common before reversal.
Prioritize long entries on confirmed pullbacks, avoid chasing price in the middle range.
Keep position sizing modest as volatility could spike on Fed commentary or geopolitical updates.
✅ Summary
Gold remains in a strong bullish phase, fueled by Fed rate cut expectations and geopolitical tensions. Strategy: buy dips at 3757–3755 or 3742–3740, targeting 3770–3780, while watching for short-term rejection at 3813–3815 for potential sells.
📢 Follow MMFLOW TRADING for live intraday updates, liquidity-based trading setups, and high-probability strategies on XAUUSD.

Daily Plan: What’s Next After the All-Time High Correction?📊 Market Context
Gold is struggling to recover from yesterday’s pullback after hitting a record high at 3791 USD/oz. In the Asian session on Thursday, price action remains cautious as traders await U.S. mid-tier data and further speeches from Fed officials for fresh momentum. While the long-term trend remains bullish, the current pause highlights how sensitive gold is to short-term liquidity sweeps and macro catalysts.
🔎 Technical Analysis (H1/H4)
ATH zone sits at 3791, with sellers reacting strongly from that level.
Price is currently trading below the downtrend reaction zone 3755–3757, showing near-term weakness.
Buy-side liquidity remains intact at 3712 and deeper at 3688–3686 (CP + OBS Buy Zone).
Sell-side liquidity zone identified at 3775–3777, likely to attract reactions if retested.
Larger liquidity magnet lies at 3824–3830, but only if bulls regain momentum above 3777.
🔑 Key Levels
Resistance / Sell Zones: 3775–3777 - 3791 - 3824–3830
Support / Buy Zones: 3712 - 3688–3686
📈 Scenarios & Trading Plan
✅ BUY ZONE (Main Setup): 3688–3686
SL: 3680
TP: 3696 - 3700 - 3705 - 3710 - 3720 - 3730 - …
✅ SELL ZONE (Liquidity Reaction): 3775–3777
SL: 3782
TP: 3770 - 3765 - 3760 - 3750 - 3740 - 3730 - …
⚠️ Risk Management Notes
Stay alert for false breakouts around 3775–3777, as price may sweep liquidity before reversing.
Avoid chasing entries mid-range; wait for price action confirmation in the buy/sell zones.
U.S. data and Fed commentary could trigger volatility spikes — adjust risk accordingly.
✅ Summary
Gold is consolidating after its record high at 3791, with traders waiting for new catalysts. The plan today: buy dips at 3688–3686, targeting a recovery towards 3720–3730, while looking for short-term sells at 3775–3777 if rejection occurs. A break above 3777 would re-open the path towards 3824–3830.
📢 Follow MMFLOW TRADING on TradingView for real-time liquidity setups and BIGWIN strategies as gold approaches its next critical levels.

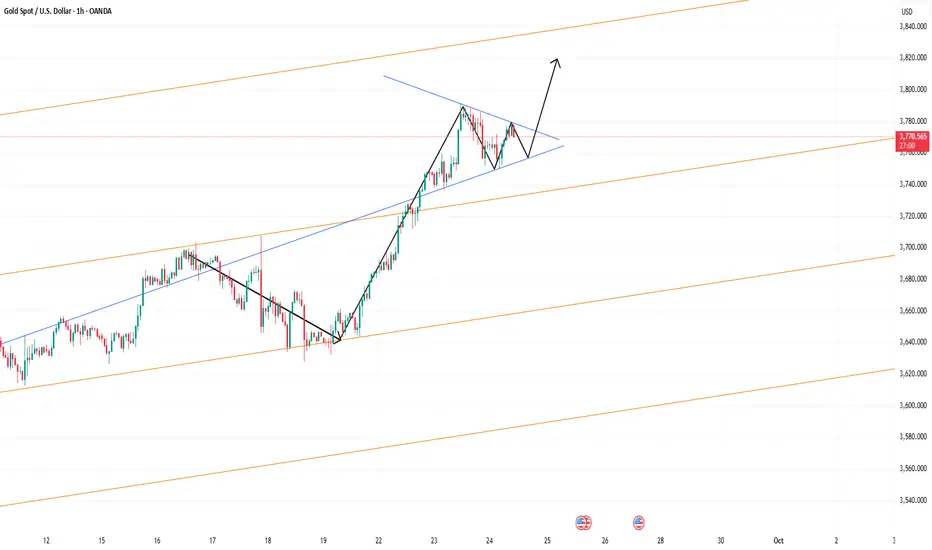
Quick Gold Long: Playing the Rebound GameGold has now fallen below the 3755 area, disconfirming the ascending triangle formation in the short term. The price has continued to fall below the downward channel support around 37740, signaling a short-term shift from strength to weakness. However, since gold hasn't shown clear signs of a peak, and the decline hasn't been a cliff-like drop, but rather a volatile downward pattern, the current technical pullback remains within normal limits and hasn't reached the level of a reversal. Therefore, gold still has the potential to rebound after this pullback.
Gold has retreated to the 3730-3725 area. While the decline hasn't completely stopped, the decline has certainly slowed. Furthermore, this area offers some technical support. Gold may rebound in the short term after fluctuating within this area, potentially reaching the 3740-3750 range.
Thus, for short-term trading, we can initially consider going long on gold in the 3730-3725 area, with a short-term rebound target of 3740-3750.

How to seize the certain opportunities in the gold market?Yesterday, gold continued its record-breaking rally, achieving its sixth consecutive week of gains and further entering an unknown price range. The core driving force behind this round of gains lies in the market's continued rise in dovish expectations for the Federal Reserve to further implement loose policies before the end of the year. Although the 25 basis point interest rate cut last week has been digested by the market, investors are increasingly expecting two more interest rate cuts in October and December, providing strong support for gold prices. In addition, ongoing geopolitical tensions, increased gold holdings by various countries and strong inflows of funds into gold ETFs have together constituted the multiple pillars of this bull market. Under the interweaving of risk aversion and loose expectations, gold has risen by more than 40% this year, highlighting its strong appeal.
From a technical perspective, the daily chart shows that gold prices closed with a large real body positive line, and the trend is extremely strong. The MACD indicator double lines sent a golden cross signal, confirming the short-term bullish trend. However, the indicator has deviated seriously into the overbought area, suggesting that there is a large risk of technical correction in the later period. Strategy analysis needs to focus on the support role of the MA5 moving average below. If it falls below, it may trigger a deeper adjustment. It is recommended to remain cautious in operation. You can consider light positions and try to arrange short orders on rallies. The upper resistance focuses on the 3780-3800 range, and the lower support is around 3745-3730. Although the current market trend is upward, we need to be vigilant against the risk of high-level corrections.
Hack Gold. Win Fast. Inside XAUUSD trading secrets.
⚡ If you just chose Gold to trade, listen up. This market doesn’t forgive.
It’s fast, brutal, violent, yet equally rewarding. But if you don’t know what you are doing, it will chew you up and spit you out before you even finish your first coffee.
Here are 5 Hacks to help you every single day instead of the same Mistakes that keep new traders in losses, frustrated, and blaming “manipulation” instead of fixing their own game:
🔔1. Trading Blind With Zero Knowledge
Everyone wants quick cash, and most traders do not want to study. If you don’t know about liquidity, order blocks, or imbalances, you are just guessing. And Gold punishes guesses.
Copying random signals online won’t save you. You need a system, discipline, and screen time. Period.
🔥HACK 1: Learn the game before you risk the money. Demo, daily chart study & repeat hundreds of times. If you treat this like a casino, you will always leave broke.
✨2. Pretending Risk Management Is Optional
This one kills more accounts than anything else. No stop loss, no take profit, just “I’ll close it when it comes back.” And then the market doesn’t come back. Sometimes ever.
Gold can drop 300 pips in minutes, and if you are sitting unprotected, you will blow up faster than you can blink.
🔥HACK 2: Risk max 0.3 per trade. Place your SL. Place your TP or watch profits like a hawk. And if you don’t know where to place them, you are not ready to trade real money. Find real premium help, not fake flashy plastic scams.
💥3. Loading the Gun With Too Many Trades
Gold moves fast. One wrong click, and if you are stacked with five positions, you are done.
I have seen traders open buys, sells, hedges, all at once, thinking they are “diversified.” No. You are just multiplying risk. A 1% move against you and XAUUSD can wipe your entire account if you are over-leveraged.
🔥 HACK 3: Stick to one clean setup, manage the size, and stop spraying bullets like you are in an arcade game.
🔴4. FOMO Buying Tops (and Selling Bottoms)
Gold hits a new high. Like yesterday. Traders scream “To the moon!” You panic and click Buy. Two minutes later, your drawdown hits rock bottom. Happens all the time.
FOMO is the fastest way to donate your money to smarter traders.
🔥HACK 4: Plan your trades before the price gets there. If you were not ready before the move, you missed it. Accept it. The market is not closing tomorrow or ever.
😡5. Revenge Trading Like a Maniac
You take a loss. Then your brain screams: “I’ll get it back!” So you double the next position. Then triple. Guess what? XAUUSD is so volatile that it will run over your feelings and leave you in depression. You are not getting your money back, just gaining more anxiety and daily stress.
🔥HACK 5: Close the platform. Step away. One good trade tomorrow is worth more than five revenge trades today.
🖊️Homework:
Memorize your hacks, stick them on a post-it by your screen, in your wallet, and read them as many times as needed; learn them like a mantra. Daily.
If this article helped you today and brought you more clarity:
Drop a 🚀 and follow us✅ for more trading ideas and trading psychology. Thank you.

Ascending Triangle Hints at One More Push to 3800?Currently, gold is encountering resistance around 3790-3800, and the bullish momentum has slightly weakened, but the overall pattern is still bullish. Moreover, judging from the two recent pullbacks, although the bears were given the opportunity to escape from the predicament, they were supported near 3750 and rebounded many times. The strong buying support below greatly limited the retracement space.
Gold has formed an ascending triangle structure in the short term. If this structure is valid, then gold as a whole may still hit 3800, or even continue the upward trend to the 3820-3830 area, which is also the upward limit area I mentioned earlier; but this condition must be established under the premise that gold cannot fall below the 3760-3750 area during the short-term retracement.
Therefore, it is clear that the short-term structural support of gold is located in the 3760-3750 area, and the further strong support below is located in the area around 3730. At present, gold is in the ascending triangle structural resistance area of 3775-3785, so there is still a chance of a pullback in the short term.
Therefore, for short-term trading:
1. For the time being, consider shorting gold in the 3775-3785 area, with a retracement target of 3765-3755.
2. Once gold retraces to the 3765-3755 area, consider going long on gold based on market fluctuations and structural support.
Gold Bulls Dominate MarketGold Bulls Dominate Market
Gold price started a fresh surge above $3,750 and traded to a new all-time high.
Important Takeaways for Gold Price Analysis Today
- Gold price rallied to a new all-time high and traded close to $3,800 against the US Dollar.
- A short-term bullish flag pattern is forming with resistance at $3,770 on the hourly chart of gold.
Gold Price Technical Analysis
On the hourly chart of Gold, the price formed support near $3,625. The price remained in a bullish zone and started a fresh increase above $3,660, as mentioned in the previous analysis.
The bulls pushed the price above $3,750 level and the 50-hour simple moving average. Finally, it traded to a new all-time high at $3,791. The price is now consolidating gains below $3,770 and the RSI is above 50.
Initial support on the downside is near the 23.6% Fib retracement level of the upward move from the $3,627 swing low to the $3,791 high at $3,750 and the 50-hour simple moving average.
A downside break below $3,750 could start a larger downside correction. In the stated case, Gold could drop toward the 50% Fib retracement at $3,710. The next area of interest for the bulls might be $3,690. A daily close below $3,690 could spark bearish moves and send the price to $3,625.
If there is a fresh increase, the price could face resistance at $3,770 and a short-term bullish flag pattern. The next sell zone might be $3,790. An upside break above the $3,790 resistance could send Gold price toward $3,820. Any more gains may perhaps set the pace for an increase to $3,850.
This article represents the opinion of the Companies operating under the FXOpen brand only. It is not to be construed as an offer, solicitation, or recommendation with respect to products and services provided by the Companies operating under the FXOpen brand, nor is it to be considered financial advice.

LETS GOO GOLD FLY 3830 SOON Gold Have A Super Sharp X Setup
Gold Buy Now Hold Till Physcology Level 3830
Support + RBS + Buy Trendline + Sell TL Breakout
Lets gooo
Good Luck Guys !

Rejection Before 3800: A Final Window for ShortsDriven by market sentiment, gold has now reached a high of around 3792, just one step away from the 3800 mark. Judging from the current structure, gold is undoubtedly in a unilateral bull trend and has completely replicated the rising pattern of the previous wave, with almost no decent retracement during the rise.
Now gold continues to break through historical highs and enter unknown areas. In addition, due to the promotion of market sentiment, the current technical level has been distorted, so there is no good reference target at present. It can only be calculated based on space and cycle; the foreseeable upper limit area in the short term is in the 3820-3830 area; but because there are obvious signs of stagnant growth before reaching the 3800 mark, gold may be the first to experience a pullback.
Because gold is in an extreme rising mode, most funds may not have the opportunity to participate in long transactions, so in order to increase liquidity, gold also has a need for a retracement; however, because the current market enthusiasm remains unabated, it can be expected that the retracement space for gold is limited. The foreseeable retracement area is in the 3760-3750 area, and the second is in the area near 3730.
In addition, look at it according to the cycle. It is not difficult to see from the financial calendar that China, a major gold holder, will usher in the National Day holiday. Before the holiday, some funds may take profits, which will also lead to a decline in gold prices. After the holiday, gold may end its retracement and return to the upward trend.
So if you hold a short position, then when gold falls back to the 3760-3750 area, or even around 3730, it will be an opportunity for gold bears to get out of trouble. Once gold retreats to this area and escapes the predicament, it could be a good opportunity to re-enter the long position!
