GOLD 12H CHART ROUTE MAPPlease review our updated 12H chart route map with the latest levels.
The 1H and 4H timeframes I shared earlier played out exactly as expected. Now, I’m sharing the 12H GOLD chart to give you a clearer, bigger-picture outlook. Please read the caption carefully.
Price is currently trading within the broader on 12H Chart between 4000 - 4230 range. The channel half-line and symmetrical top line continue to act as major resistance, with the BB (Breaker Block) adding further resistance just below the supply area.
If the current support holds and price rejects from the BB Or the supply zone, or below the half-line, we can expect a move toward the 4130 target and this could open the swing range for a deeper test before a potential bounce. A clean break above 4230 would confirm bullish continuation to the upside.
We will factor all of this into our buy setups from dip levels. Our updated levels and weighted zones will help us monitor downside movement and capitalize on bounces through smaller-timeframe strategies.
Our long-term bias remains bullish, so we welcome corrective pullbacks. These dips provide safer opportunities to buy from strong levels rather than chasing the bullish move at the top.
Thank you all for your likes, comments, and follows — we truly appreciate your support!
The Quantum Trading Mastery
Goldtrendanalysis

The Charge Sounds Again — Marching Toward 4240–4250!Currently, gold has once again hit a new high in a volatile upward manner and touched around 4228. Although the bullish momentum has slowed down compared with before, it still has enough strength to control the situation and dominate. Coupled with the support of multiple safe-haven factors, the market bulls can still continue to move upward after a brief rest!
It can be clearly seen from the current technical form and structure that gold has rebounded again after retreating to the area near 4180 several times. There are many obvious lower shadows in the candle chart. It can be seen that gold has built a new rising relay platform near 4180 in the short term. Gold may use this as a springboard to continue to rise and launch a charge towards the 4240-4250 area in the short term!
According to the trend structure, as the center of gravity of gold continues to move up, the support area has moved up to the 4215-4205 area in the short term. If gold cannot fall below this area during the retracement, gold may continue to rise with this as support. Then, the first thing we need to pay attention to is the 4240-4250 area.
So, for short-term trading:
1. If gold first retreats to the 4215-4205 area, we can consider going long on gold in small quantities. Since the entry level is relatively high, it's important to set up protection measures during the trade.
2. If gold continues to rise to the 4240-4250 area, if gold first touches this area, we can consider going short on gold in small quantities. Since this is a counter-trend trade, it's also important to set up protection measures during the trade.

4100 Breakout in Sight! Gold Bulls Target 4130 Next!Gold is still maintaining a strong upward position and has broken through the recent high of 4050-4060 in the short term. There is no clear suppression area above and no obvious signs of turning back. According to the current structural form, gold still has the potential to continue to rise and is expected to hit 4100 or even around 4130. Currently, we need to pay special attention to three areas:
1. Market sentiment: around 4100;
2. Key area for continued gains: around 4130;
3. Short-term support below: 4055-4045.
Therefore, when executing short-term trades, we should avoid excessively chasing gold prices. We can consider waiting for gold to retreat to the 4055-4045 area before initiating small long positions.
If you’re following this rally, don’t just watch — prepare your next move.
💬 Like & Follow for real-time updates and in-depth gold insights.
📈 Follow me for real-time gold insights &to my traders' channel for exclusive setups in bio!

Bulls Regain Control!Is 4100 the Next Big Target?After touching the 3945-3955 area three times during the week, gold rebounded quickly and showed a clear lower shadow in the candle chart. It also showed an oscillating upward structure in the short-term structure, and formed a secondary springboard in the 3970-3980 area to rise again, and closed above 4010 on Friday. It can be seen that after the gold pullback, the bulls regained dominance and continued the bullish trend.
The short-term technical structure is biased towards bulls, the center of gravity is gradually moving up, and the buying support below is strong. I believe that gold still has the potential to continue to rise. The current short-term resistance of gold is in the 3930-3940 area. Once gold breaks through this resistance area, it could retest the previous highs of 3950-3960, or even extend its upward trend to around 4100.
So, how do you execute the trade next? I think we can consider going long on gold when it retraces to the 4000-3990 area, initially aiming for a short-term upside target of the 4030-4040 area.
Gold is showing renewed bullish momentum as buyers defend the 3970 zone.
Could this be the start of another strong rally toward 4100?
Follow me for real-time gold insights &to my traders' channel for exclusive setups!

Clash of Titans — Bulls vs Bears: Who Will Win This Round?Gold rebounded quickly after touching 3945 twice, and rebounded again after touching 3953. Three long lower shadows were shown in the candle chart. This area happens to be the 50% area of the previous rising wave. There are obvious signs of bottoming out in the short term. From the overall trend, although the short-term retracement of gold is not small, it has not fallen below the 3930 trend channel support, and has not even effectively fallen below 3950. Therefore, the overall gold trend is still bullish.
Judging from the current structure, if gold breaks through the key level of 4010-4030 during the rebound, gold will resume its strong bullish pattern and has the potential to test or even break through the recent highs again; if gold cannot recover the key level of 4010-4030 in the short term, gold may maintain a volatile pattern in the 4010-3950 area or the 4030-3970 area.
Therefore, in short-term trading:
1. If gold continues to rebound, we can first consider shorting gold in the 4010-4030 area; then patiently wait for gold to retrace.
2. If gold retreats first, we can first consider longing gold in the 3970-3950 area; then patiently wait for gold to rise.

Smart Money Strategy: Short Now, Go Long LaterAs I expected, gold touched around 3950 during the rise. According to the current structure, gold is currently in a very strong bullish trend, the market has a strong bullish consensus, and gold still has room to continue to rise. If gold can break through 3950 during the rise, it may open up space to higher levels.
However, it should be emphasized that when market sentiment is high and gold prices continue to rise, volatility may increase significantly and the risk of chasing the rise will increase significantly. From the current perspective, the short-term upward trend has been suppressed, and there is obvious pressure near the 3950 level, so gold may show signs of pullback in the short term.
To be honest, although gold prices have risen sharply, there have not been many opportunities to enter the market and go long on gold during the rise. So I have already shorted gold in the 3930-3950 area according to the previous trading strategy. First aim for the retracement target: 3920-3910 area.

Bulls on Fire! The 4000 Challenge BeginsWhen summarizing the trading on Sunday, it was clearly pointed out that gold would inevitably hit 3900 or even 3930 this week. However, it was unexpected that gold had reached 3920 so early. Although it retreated slightly after reaching around 3920, according to the current structure and trend, the bull trend has not ended yet and there is still room for growth.
Since gold has once again broken through the recent high of 3895, the double top structure constructed in this horizontal area has become invalid and temporarily has no resistance effect. In fact, after the top and bottom conversion, this position area may play a supporting role to a certain extent in the future. As gold breaks through 3900, market bullish confidence may expand unprecedentedly, and the enthusiasm for buying will be pushed to another level. As the center of gravity of gold moves up, the current technical structural support has moved up to 3880-3870; and the strong support is located in the 3850-3840 area.
If gold cannot effectively fall below these two key support areas during the retracement. Gold will continue to maintain its bullish trend and continue its strong upward trend. It is even expected to continue to set new highs and reach around 3930 or even 3950. Once gold rises and breaks through 3950, the 4000 mark will follow!
So in terms of short-term trading, we can first try to start buying gold in small batches in the area around 3880-3870. After all, the entry price is relatively high, so we must control the lot of transactions and set up protection.
If you want to continue to follow and pay attention to my trading strategies and signals, be sure to follow me!

3717 Won’t Hold—Gold’s Next Breakdown AheadThe highest point of gold during the day was around 3761. It can be clearly seen that as the bullish momentum of gold gradually declines, the high point of the candlestick chart is also gradually moving downward. Judging from the daily candlestick chart, a bearish candlestick chart appeared for the second consecutive day today, and it is very likely to close in a doji pattern, suggesting that gold is likely to continue to fall.
From the perspective of short-term morphological structure, gold has currently perfectly constructed a downward trend channel based on the wave top areas of 3790, 3778 and 3761; and upper shadows appear on many candlestick charts, suggesting that the selling pressure from above is relatively large, and the center of gravity continues to move downward and test the lower support area many times. Based on the current structure, 3717 is likely not the current low, and gold will continue to fall. The upper short-term resistance is in the 3750-3760 area; the lower support is in the 3715-3705 area, followed by the 3695-3690 area.
Therefore, for short-term trading:
1. Prioritize waiting for a gold rebound and then continue shorting gold within the 3750-3760 area; the short-term target is 3725-3715.
2. If gold first retreats to the 3715-3705 area, we can take advantage of the initial pullback and go long gold in that area, with the short-term target being 3730-3740.

Bearish Grip Tightens as 3585 Comes Into ViewAs gold continuously tests and falls below the 3650-3640 area, the space below has been opened to a certain extent. According to the current gold trend structure, as the candle chart shows a long upper shadow line near 3705, there are obvious signs of profit-taking, and there is strong selling pressure from above; a downward-opening trend channel is formed in the structural form, and the center of gravity of gold is gradually shifting downward. The bears are relatively stronger, and there is no obvious bottoming signal below at present. Gold still has the potential to continue to decline!
Although gold has rebounded slightly after several attempts at the 3635-3625 area, the strength of these rebounds has fallen far short of expectations, indicating relatively weak bullish momentum. As gold gradually moves downward, short-term resistance has shifted to the 3660-3670 area. Strong resistance is around 3685, but given the current rebound strength, it is unlikely that gold will reach this resistance area in the short term.
And I think gold will easily continue to decline and test the 3620-3610 area. Once gold falls below this area, the space below will be completely opened. Gold is likely to continue its downward trend to around 3585, and may even experience a deeper correction to around 3550.
Therefore, in a bearish market, we must firmly adhere to a short-gold trading strategy. If gold rebounds weakly to the 3655-3665 area, I would likely prioritize shorting gold. The short-term retracement target will first target the 3625-3615 area.

Market Analysis: Gold Rockets to New HighMarket Analysis: Gold Rockets to New High
Gold price rallied to a new all-time high above $3,670.
Important Takeaways for Gold Price Analysis Today
- Gold price started a major increase from $3,500 against the US Dollar.
- A key bullish trend line is forming with support at $3,635 on the hourly chart of gold.
Gold Price Technical Analysis
On the hourly chart of Gold, the price formed a base above $3,500. The price remained in a bullish zone and started a strong increase above $3,550.
There was a decent move above the 50-hour simple moving average and $3,620. The bulls pushed the price above the $3,640 and $3,650 resistance levels. Finally, the price climbed to a new all-time high at $3,674 before there was a pullback.
The price dipped below the 23.6% Fib retracement level of the upward move from the $3,511 swing low to the $3,674 high, and the RSI declined below 50. Initial support on the downside is near $3,635 and the 50-hour simple moving average.
There is also a key bullish trend line forming with support at $3,635. The first major support is near the 50% Fib retracement at $3,592. If there is a downside break below $3,592, the price might decline further. In the stated case, the price might drop toward $3,575. Any more losses might push the price toward $3,510.
Immediate resistance is near $3,655. The next major hurdle for the bulls is $3,675. An upside break above $3,675 could send Gold price toward $3,688. Any more gains may perhaps set the pace for an increase toward $3,700.
This article represents the opinion of the Companies operating under the FXOpen brand only. It is not to be construed as an offer, solicitation, or recommendation with respect to products and services provided by the Companies operating under the FXOpen brand, nor is it to be considered financial advice.

High-Level Consolidation: A Playground for Both Bulls and BearsToday, I clearly predicted that "cyclical patterns suggest a 600-pips drop in gold." Gold surged to around 3675 before retreating, reaching a low of around 3626, a fluctuation of 490 pips. It was very close to my expectation, so according to my trading model, I won a big victory in long and short trading today!
Day Trading Results:
1. First, we shorted gold near 3658 and closed the trade at TP: 3638, for a profit of 200 pips.
2. We shorted gold twice at 3655-3656, closing the positions manually at 3647 and 3645, respectively, for a total profit of 190 pips.
3. We shorted gold in batches near 3667 and 3673, closing the trade at TP: 3650, for a total profit of 400 pips.
4. We longed gold in batches near 3632 and 3628, closing the trade at TP: 3642, for a total profit of 240 pips.
Thus, today's total profit on both long and short trades was 1030 pips. I am very satisfied with today's trading model and results.
As for my view on the gold market in the future, I believe that the current gold market is still in an environment of interest rate cut expectations, and the macroeconomic background still has a significant supporting effect on gold. The current bullish trend of gold has not changed, and short-term fluctuations will not affect the overall direction. Therefore, before the interest rate cut is implemented (the Federal Reserve announces its interest rate decision on September 17), gold will still maintain an upward structure.
Judging from the candlestick chart, as long as gold remains above 3600, gold will remain in a bullish structure and maintain an overall upward trend. Although gold began to retreat after touching around 3675, and the bullish momentum no longer seems strong, I believe that gold has limited room for retreat in the short term. Even if the bulls no longer recover their previous strong momentum, gold is expected to maintain a high-level volatile trend, with the short-term support below at 3630-3620. If it is difficult for gold to fall below this area in the short term, gold may still hit the 3670-3680 area during the rebound.
Therefore, in the next short-term trading, if gold first retreats to the 3630-3620 area, we can consider trying to go long on gold, first looking at the 3650-3660 target area;If gold touches the 3670-3680 area again during the rebound, we can still try to short gold again, and the retracement target will first look at the 3655-3645 area.
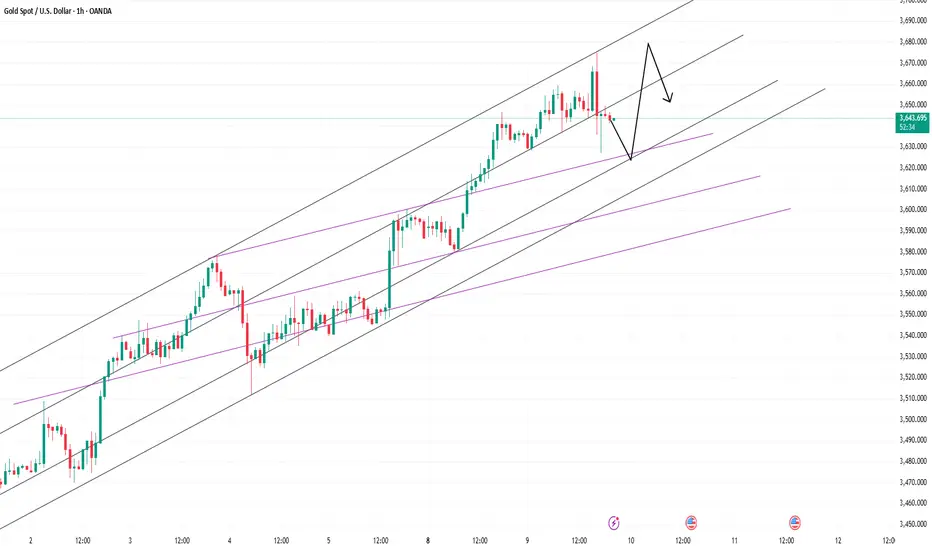
Breaking Free: How Bears Can Win Back in GoldAfter touching the trend line resistance area of 3640-3650, gold fell back as expected, showing a high "doji" in the hourly candle chart and signs of stagflation. It is expected to become a market turning point in the short term. The gold market may usher in a good correction in the short term due to this technical turning point. However, we need to note that as long as gold remains above 3580, the current situation is still a strong bullish pattern, so we must pay attention to the extent of the retracement.
As gold continues to rise, the current short-term support is at 3620-3610, so I think it is necessary for gold to retrace its support in this area. Once gold is supported in this area, it may rebound again and retest the high area of 3640-3650. If gold falls below the short-term support area of 3620-3610, then gold will further retrace its steps to 3590-3580, which is the lifeline of bulls and the dividing line between bulls and bears.
If gold falls below the 3590-3580 area during the backtest, the current gold bull advantage will no longer exist, and the bears will likely regain control of the situation. As most long funds take profits and the market experiences panic selling, gold will completely turn into a bearish trend and fall further.
At present, I still hold short position in gold, and first aim at the short target area: 3620-3610 area. Once gold falls below this area, the target area will be postponed to 3600-3590 area. I am currently holding my short position and have already realized some profits. I very much hope that gold will fall back to the target area as expected!

Gold near 3500, Who Wins—Bulls or Bears?Today, after gold touched around 3437 during the retracement, it was pushed up to around 3490 again by market sentiment. The bullish momentum was extremely strong and it is currently in a strong bullish trend. According to the current gold trend, there may be room for continuation above. However, in the transaction, I have made it clear that I will no longer aggressively chase the rise of gold!
First, gold has risen sharply under the influence of fundamentals, and it is difficult to follow up in time on the technical level, resulting in a technical pullback demand for gold; in addition, gold has shown obvious signs of acceleration during the rise, and the market often easily has turning points after acceleration, and although gold is in an obvious bullish trend, it is still under considerable pressure before breaking through the previous high of 3500. These are the reasons why I am unwilling to continue chasing the rise in gold. The most important point is that since the market expectations of interest rate cuts have increased, a large amount of buying has appeared to push up gold prices before the Federal Reserve announced the interest rate cut. It is very likely that the phenomenon of "buying expectations and selling facts" will occur.
Therefore, in the current transaction, I do not advocate continuing to chase gold at high levels. On the contrary, in the 3475-3495 area, I will consider creating as many short positions as possible as a swing trade, and be ready to welcome gold to retreat to the 3435-3415 area at any time.
Of course, because swing trading requires a certain period of time, we can still participate in intraday short-term trading during the execution of swing trading, follow the mainstream trend and try to go long on gold with the support area. The support area we must first pay attention to is in the 3460-3450 area. If gold first touches this area during the retracement process, we can consider going long on gold in intraday short-term trading.
CAPITALCOM:GOLD FX:XAUUSD TVC:GOLD FOREXCOM:XAUUSD OANDA:XAUUSD

I might be the first to start shortingAgainst the backdrop of strengthened expectations of interest rate cuts and Trump's continued tough stance, gold rose above the 3400 mark and continued to above 3410. The upward momentum was relatively strong and market sentiment was optimistic. But the more this happens, the more dangerous it feels! In fact, from a short-term perspective, the foreseeable target area above is: 3415-3425 area, which has only 100-150pips of room for growth from the current gold price. So I think there is no need to continue chasing long gold for the time being.
From the current structure, although gold is in a fluctuating upward structure, the trading volume is gradually decreasing after gold broke through 3410, proving that as gold continues to rise, the market has gradually become more cautious. Judging from the candlestick pattern, the trend line constructed from the highs of 3500 and 3440 is currently facing resistance near 3415, while the resistance of the trend line constructed from 3452 and 3440 is currently near 3425. Therefore, the current more obvious resistance area is in the 3415-3425 area. In comparison, there is a larger retracement space below, firstly in the 3395-3385 area, and then in the 3375-3365 area.
Therefore, at this stage, I will no longer aggressively chase the rise of gold; instead, I will start shorting gold in batches above 3410, and then patiently wait for gold to retrace!

Explosive Rally Ahead: Gold Eyes a 3400 BreakoutThere is no doubt that as long as gold is above 3350, the current gold market will maintain a strong bullish structure. After today's sideways trading, gold has clearly established a support platform in the 3370-3360 area. Although it has repeatedly fallen back under pressure in the 3380-3390 area, it has rarely fallen below the short-term support platform of 3370-3360. In addition, the candlestick charts have repeatedly shown long lower shadows, proving that the buying momentum is strong and the market bullish enthusiasm is high! Therefore, in short-term trading, we can try to go long on gold based on the 3370-3360 support level.
However, it's important to note that gold has repeatedly come under pressure at the 3380-3390 resistance level. If gold consistently fails to break through this resistance level during its upward trend, bullish sentiment could be affected. Therefore, gold may need to retest support before any further gains. If it falls below the 3370-3360 level during this retest, it could extend to the 3355-3350 level, which is strong support in the short term. Therefore, if gold falls below the 3370-3360 level, it could retest the 3355-3350 level, prompting bulls to launch a counterattack.
Therefore, in the short term, given that gold maintains a bullish structure, I would primarily consider going long on gold.
1. Consider initiating a long position in gold in the 3370-3360 area; first, see if gold can break through the 3380-3390 area as expected.
2. If gold retests the support area, consider resuming a long position in the 3355-3350 area.

Gold’s Pullback: Fueling the Next Surge Toward 3390-3400Today is the first trading day of this week. Gold has continued to fall since the opening, and has reached a low of around 3364 so far. Through the short-term trend, we can see that gold has insufficient willingness to continue to rise above 3400 and still faces considerable resistance. It needs more support and momentum to drive it forward before it can continue to rise. Currently, gold continues to retreat to around 3364. Has the trend of gold turned into a bearish trend? I think it's too early to draw such a conclusion!
Although gold has fallen significantly, there is still strong buying support below. The 3360-3350 area has become a key support level. As long as gold does not fall below this area, the bullish structure has not been completely broken. Therefore, there is still sufficient energy for gold to continue its rebound. This decline in gold is intended to increase liquidity and accumulate more upward momentum, which will help gold stabilize at 3400 and move towards higher targets!
Therefore, for short-term trading, I think we can still continue to try to go long on gold, but after all, the decline in gold has been so large. For short-term trading, we can appropriately lower the rebound expectations to the 3380-3390 area.

Gold Poised for a Surge: 3400 in Sight, 3430 Within ReachToday, gold retreated to a low of around 3350 before rebounding again, reaching a high of around 3390. During this process, we seized the opportunity to go long on gold near 3356 and closed the trade by successfully hitting TP: 3380, making a profit of 240 pips!
Although gold retreated after reaching 3390, I had originally planned to short gold near 3395, but gold didn't reach that level during the rally, so our shorting plan had to be shelved. Currently, it's trading in a narrow range around 3380. Clearly, I'm not considering shorting gold after a pullback.
Although gold retreated to around 3350 during the day, it did not destroy the current bullish structure of gold. In addition, gold regained the 3370-3375 area again during the rebound, and the gold bulls became even stronger. Therefore, I have now lost the desire and interest to short gold. Gold has currently reached a high near 3390. Given its current structure and strength, I don't believe 3390 is the current high. Gold is likely to attempt to break through 3400, and even has the potential to continue its rise to the 3420-3430 range. As the center of gravity of gold shifts upward, the current short-term support has moved up to the 3375-3365 area; and the relatively strong support is located in the 3360-3350 area.
Therefore, for short-term trading, I prefer to start trying to go long on gold after it retreats to the 3375-3365 area, and expect gold to hit 3400 as expected, or even continue to the 3420-3430 area.

Bullish Outlook Intact: Gold Targeting 3400-3410Gold encountered resistance and retreated several times on its way to 3400, but it remained above 3370 during the pullback, perfectly maintaining the integrity of its volatile upward trend. Therefore, even though gold's upward momentum has weakened, I still believe that due to structural support, gold still has the potential to reach the 3400-3410 area, and may even continue its bullish trend to the 3420-3430 area.
As gold prices rise, market sentiment tends to be more optimistic, and the price behavior reflected by the candlestick chart becomes clearer. The lows of gold continue to rise, and the highs always insist on setting new highs in the process of rising. The oscillating upward structure is particularly obvious. While greatly limiting the retracement space, it also greatly consolidates the support structure below and is conducive to further rises in gold. At present, gold has been confirmed to have stabilized above 3370, so gold may not give another chance to fall back to the 3360-3350 area.
Then in the next short-term trading, the gold pullback is a buying opportunity. We focus on the opportunity to participate in long gold after gold retreats to 3380-3370. The target will first look at the 3400-3410 area, and the higher target area is in the 3420-3430 area.

Gold Bulls Unshaken, 3400 in FocusGold prices retreated from a high of 3385 today, currently hitting a low near 3358. How far will gold fall? Are the bears back in control? I'm not worried about a gold pullback, but rather a lack of one, because only a pullback can provide a good entry opportunity. Clearly, I remain bullish on gold and optimistic about it reaching the 3400 mark.
Because gold fell all the way to around 3358, some voices in the market began to tout the strong return of the bears, but I remained unmoved. When many people were once in self-doubt, I was quietly taking advantage of the gold pullback to accumulate funds in batches and pick up bargains. We can clearly see that gold did not destroy the bullish structure during the decline, and as gold rebounded, the 3360-3350 area has become a dense trading area, indicating strong buying support. After the technical top and bottom conversion, it has become a relatively solid support area. It may be difficult for gold to fall below this support area in the short term.
So, why has gold repeatedly encountered resistance and retreated? I believe that gold has encountered resistance and retreated in the 3385-3390 area many times in order to repeatedly test the effectiveness of support and consolidate the strength of support. It is also to increase liquidity during the retreat period, thereby accumulating more upward momentum so that gold can rise further and break through the 3400 mark.
So I still hold a long position in gold, and I have not lost confidence in the gold bulls. On the contrary, I still expect that gold will be able to hit 3400 in one fell swoop after repeatedly testing the support, or even continue to rise to the 3420-3430 area.

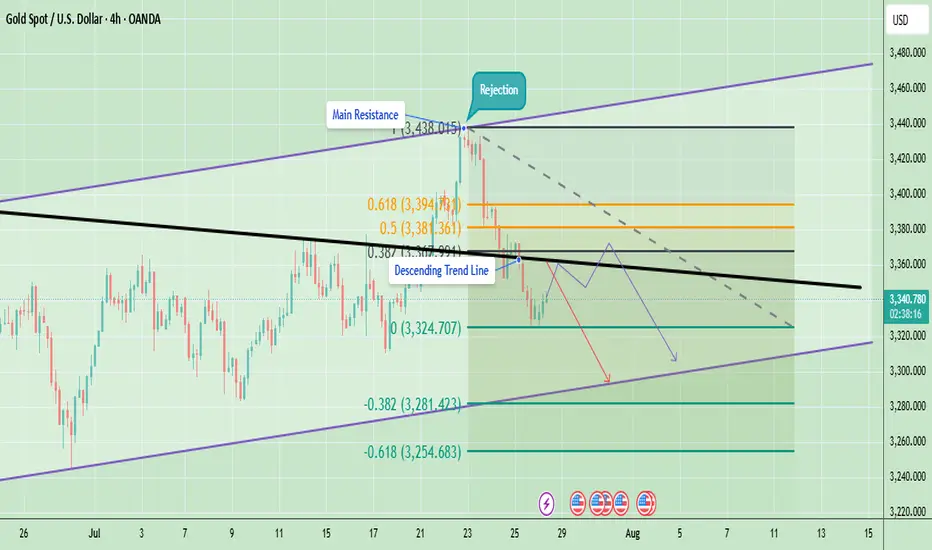
Technical Analysis - Gold Rejected at ResistanceGold is currently trading around $3,341 after facing a strong rejection from the $3,438 resistance area. This rejection coincided with the upper boundary of the trend channel and the main resistance zone, which also aligns with the Fibonacci 0.5–0.618 retracement levels. After the rejection, price fell below the descending trendline, indicating that short-term sellers have taken control.
On the downside, the immediate support sits at $3,324, which has acted as a short-term bounce level. A break below this could push gold lower toward $3,281 and potentially $3,254, which are key Fibonacci extension support levels. On the upside, the immediate hurdle is at $3,355–$3,360 (descending trendline). A breakout above this area will be critical for any bullish recovery attempt toward $3,381–$3,394 and eventually $3,420–$3,438.
At the moment, the short-term trend remains bearish because gold is trading below the descending resistance and showing lower highs. However, as long as gold holds above the $3,254 support zone, the medium-term structure remains neutral to bullish, giving bulls a chance if momentum shifts again.
Last week candle is pin bar bearish candle which is showing bearish momentum at the moment. The candle shows rejection near $3,400–$3,450, aligning with the triangle’s upper resistance trendline. If gold cannot reclaim and hold above last week’s high, price may drift lower to retest support zones around $3,248–$3,150 before another breakout attempt.
Note
Please risk management in trading is a Key so use your money accordingly. If you like the idea then please like and boost. Thank you and Good Luck!
350pips Secured — Focus Shifts to Dip-Buying StrategyToday's trading was very successful, and the grasp of the long and short rhythm was very accurate. Today's trading situation is as follows:
1. Close the short position with an overnight entry price of around 3386 near 3380, with a loss of 60 pips, and the loss amount exceeded $6K;
2. Directly short gold near 3380, manually close the position near 3366, profit 130pips, profit amount exceeded $12K;
3. Long gold near 3356, hit TP: 3372 and end the transaction, profit 160pips, profit amount exceeded $8K;
4. Long gold near 3362, hit TP; 3375 and end the transaction, profit 120pips, profit amount exceeded $6K.
Intraday trading summary: Today, the long and short sides completed a total of 4 transactions, one of which suffered a loss, but the net profit was 350pips, and the profit amount exceeded $20K. For short-term trading, I think I can submit a satisfactory answer to myself today!
How to execute the transaction next? Gold started to pull back from around 3438 and has now reached a low of around 3351, with a retracement of more than 870pips. The retracement space is not small. However, gold has stabilized above 3350 and has started a technical rebound repair, and the upward force is not weak, so gold may have completed the retracement. Under the support of these two technical conditions, gold may regain its upward momentum and hit 3400 again.
At present, the short-term resistance is obvious, located in the area near 3380. Once gold breaks through 3380, gold will inevitably continue to rise and hit 3400 again; but I think as long as gold stabilizes above 3350, it is not difficult to break through the short-term resistance of 3380, so gold will inevitably test the 3400 mark again; and the short-term support below is in the 3365-3355 area. Gold may still retreat to this area first during the rise in order to increase liquidity and accumulate momentum, helping gold to break through 3380 more easily.
So for the next short-term trading, I think it is feasible to go long on gold in the 3365-3355 area, first looking at the target area of 3380-3390, and then 3400.

The Myth of Gold Reversals – Why Traders Keep Catching the KnifeGold is a master of deception.
It shows a clean wick into a zone, but reacts just enough to pull in early buyers or sellers — then rips straight through their stops like they weren’t even there.
The reversal looked real and the candles seemed perfect.
But the move? It was never meant for them.
This isn’t bad luck, but traders who survive aren’t trying to guess, they are the ones reading the reaction after the trap.
Let’s break down how these traps happen — and how Smart Money actually operates when XAUUSD is loading a real move.
🟥 Sell Trap – The "Instant Short" Mistake
Price pushes up into a clear reaction zone — maybe an OB, maybe an imbalance, a FVG, or a gap.
Structure looks stretched. Traders recognize a premium zone and decide it’s time to short.
The trap? Jumping in immediately on the touch, with no confirmation.
This is where Gold loves to trap sellers.
No M15 CHoCH/ BOS on M5 or real liquidity swept. Just a blind move and hope.
Price often pulls slightly higher — sweeping internal liquidity, triggering SLs — then shows a real rejection.
📌 Here’s what needs to happen before selling:
• First: look for a liquidity sweep (equal highs or engineered inducement)
• Then: price must shift — CHoCH or BOS on M15 or M5
• Finally: confirmation via bearish engulf, imbalance fill, or break + retest
• For experts: M1 can offer refined sniper triggers with minimal drawdown
💡 If none of this appears, it’s not a setup — it’s a trap.
🟩 Buy Trap – The "Wick Bounce" Illusion
Price taps a demand zone — again, a refined OB or imbalance, liquidity zone.
A long bullish wick forms. Some candles pause. It looks like a reversal.
But there’s no shift.Just hovering.
Many jump in long the second they see the wick. And then price breaks straight through.
📌 Here’s how to flip this trap into a real buy:
• Let price sweep liquidity below the zone — signs of a purge - true wick bounce
• Watch for a CHoCH or BOS on M15, M5, or even M1
• Look for a strong bullish engulf from the reactive level
• Confirm via imbalance fill or price reclaiming broken structure
📍 If all that happens — the trap becomes your entry.
If not? Stand down.
📊 What Smart Traders Actually Do Differently
They don’t chase wicks.
And never enter just because price tapped a line.
IT IS ALL ABOUT READING STRUCTURE AND PRICE ACTION.
Here’s how:
• Mark the highest probability reaction zones — above and below current price;
• Set alerts, not blind entries;
• Wait for price to come into their zone and then watch what it does there;
• Look for confirmation: CHoCHs, BOS, engulfing candles, FVG fills, clean rejections;
• And always keep one eye on the news — because Gold reacts fast and violently when volatility hits.
• Repeat this work daily until they learn how to recognize signs faster and more secure.
That’s the difference between chasing the reversal… and trading the move after the trap.
Because in this game, patience isn’t just a virtue — it’s survival.
And Gold? Well, XAUUSD has no mercy for those in a hurry and not studying its moves day by day, month after month and so on. Learn structure and price action even if you join any channel for help if you are serious about trading this amazing metal.
If this lesson helped you today and brought you more clarity:
Drop a 🚀 and follow us✅ for more trading ideas and trading psychology.
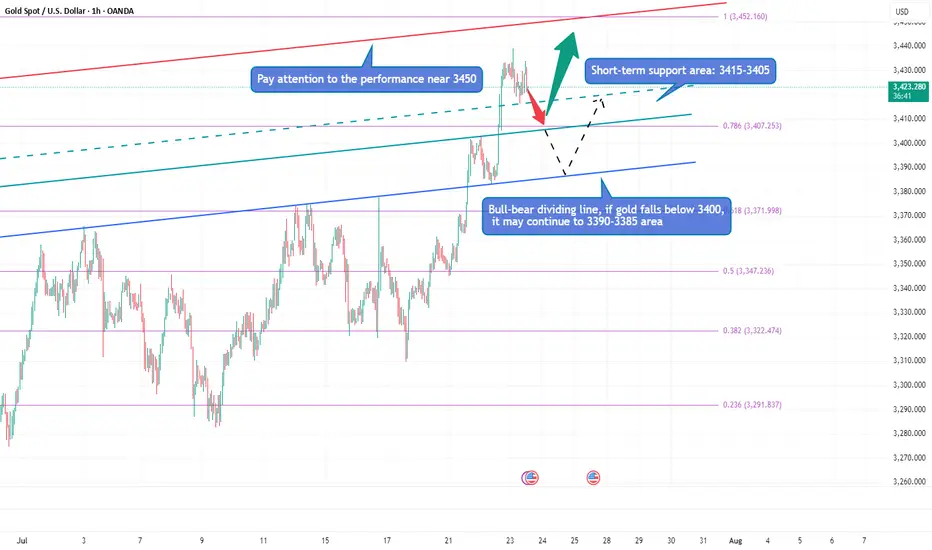
Gold is surging, can it hit 3500?Due to the trade tensions caused by tariffs and the continued conflict between the White House and the Federal Reserve, gold continued to rise, and the current highest has reached around 3438. Obviously, after gold rose strongly and broke through the 3400 and 3420 areas, the bullish sentiment of gold has been ignited. Next, we need to pay attention to whether gold can test and stand firm at 3450.
Gold is currently extremely strong, and there is basically no room for retracement during the rise. As gold rises, the short-term support below has also moved up to the 3415-3405 area; and the upper side needs to pay attention to the breakthrough of the 3450 mark. If gold continues to break through 3450, then gold has the potential to challenge 3500 again; however, if gold still cannot effectively break through when it touches the area near 3500 again, the sentiment of gold cashing out and leaving the market may be stimulated, resulting in gold There may be room for retracement in the short term. If gold falls below 3400 during the retracement, the decline may continue to the 3395-3385 area.
Therefore, for the next short-term trading, we can first wait for the opportunity for gold to pull back, and then consider going long on gold with the 3415-3405 area as support; if gold does not give a chance to pull back, then when gold first touches the area around 3440-3450, we can consider starting to short gold.