Gold Update 📌 Market Structure Overview
Gold is trading in a strong weekly uptrend, respecting the curved bullish structure. Price has recently formed a Liquidity Pool (LQ Pool) zone after an aggressive impulse move, indicating institutional accumulation rather than distribution.
The current consolidation looks healthy and suggests a continuation phase, not a top.
Bias: Bullish continuation while key support holds Target above 5200+.
2027 possible Target 6300 - 7500
🔑 Key Levels on Chart
LQ Pool Zone: 4160 – 3,950
Center of Gravity: 4123
Critical Reversal Level: 3699
Major Support:
3884
3699
3280
3128
Upside Targets (Expansion Zones):
4650
4747
5210
5573
6342
7571
📈 Bullish Scenario (Primary Plan)
As long as price holds above 3699, the market structure remains bullish.
Liquidity grab inside the LQ Pool can fuel the next Bullish move.
A sustained break and acceptance above 4123 (Weekly Center of Gravity) opens the path toward 5200+ levels.
This aligns with a trend continuation + expansion model.
⚠️ Bearish / Risk Scenario
A weekly close below 3699 would invalidate the bullish structure.
Below this level, probability shifts toward a trend reversal or deeper correction.
Next downside liquidity rests near 3258.
🧠 Smart Money Insight
This is not random volatility — price is respecting liquidity zones and higher-timeframe structure. Patience around the LQ Pool is key. Let the market show confirmation before aggressive positioning.
✅ Trading Insight
Wait for reaction at marked zones. Trade with structure, not emotions.
Goldupdate

XAU/USD (Gold) – H1 Analysis...XAU/USD (Gold) – H1 Analysis (As per my chart)
Market Structure
Price is in a strong bullish trend with higher highs & higher lows.
Trading above the Ichimoku cloud, showing buyers are in control.
Current consolidation above previous resistance indicates bullish continuation.
---
📈 Buy Scenario
Buy Zone: 4320 – 4340
🎯 Targets
Target 1: 4380
Target 2: 4420
---
❌ Invalidation
A strong H1 close below 4300 will weaken the bullish setup.
---
📌 Summary
Trend: Bullish
Bias: BUY
Expectation: Continuation toward higher resistance levels

How to navigate the volatile gold market?Gold Price Trend Analysis: Gold prices experienced a slight rise followed by a pullback during the day. Currently, gold continues to consolidate within a high-level range on the daily chart, with prices temporarily compressed between 4270 and 4350.
Gold Technical Analysis: On the hourly chart, short-term moving averages are basically converging and flat. Short-term focus is on the resistance zone around 4345. The short-term trend is likely to continue its sideways movement. There is currently some divergence on the hourly chart, with short-term moving averages starting to turn downwards. The candlestick chart is slowly putting pressure on the short-term moving averages, suggesting potential further downside in the short term. Monitor the short-term correction and recovery. Overall, the recommended trading strategy for gold is to primarily sell on rallies and secondarily buy on dips. Key resistance levels to watch are around 4345-4355, and key support levels are around 4305-4290. Please follow the trend closely.

GOLD OUTLOOK📌 Trade Setup:
• Entry Level: 4,271
• Stop Loss: 4,250
• Target: 4,322
Gold is showing bullish momentum from the current support zone. Buyers are gaining strength, and price may push upward toward the target level. The bullish setup remains valid as long as price stays above the stop-loss.
Disclaimer: This is not financial advice; it reflects only my personal market analysis. Please do your own research before trading.

GOLD | ANALYSIS📌 Trade Plan:
* Entry Level: 4,297
* Bullish Scenario: If price breaks above the resistance, the next target is 4,345.
* Bearish Scenario: If support breaks, price may extend downward toward 4,247.
Gold is sitting at a strong decision point where buyers and sellers are both active. A clear breakout from this zone will likely determine the next move. If momentum shifts upward, a clean push toward 4,345 is possible. But if price fails to hold support, a corrective drop toward 4,247 may follow.
This post highlights both sides of the market so traders can stay prepared for whichever direction unfolds.
Disclaimer: This is not financial advice; it reflects only my personal market analysis. Please do your own research before trading.

XAU/USD 10 December 2025 Intraday AnalysisH4 Analysis:
-> Swing: Bullish.
-> Internal: Bullish.
Analysis and bias remains the same as analysis dated 20 October 2025.
Price has printed as per previous intraday expectation by printing a bearish CHoCH which indicates, but not confirms, bullish pullback phase initiation.
Price is currently trading within an established internal range, however, I will continue to monitor price with regards to depth of pullback.
Intraday expectation:
Price to continue bearish, react at either discount of 50% internal EQ, or H4 supply zone before targeting weak internal high priced at 4,380.990.
Note:
The Federal Reserve’s sustained dovish stance, coupled with ongoing geopolitical uncertainties, is likely to prolong heightened volatility in the gold market. Given this elevated risk environment, traders should exercise caution and recalibrate risk management strategies to navigate potential price fluctuations effectively.
Additionally, gold pricing remains sensitive to broader macroeconomic developments, including policy decisions under President Trump. Shifts in geopolitical strategy and economic directives could further amplify uncertainty, contributing to market repricing dynamics.
H4 Chart:
M15 Analysis:
-> Swing: Bullish.
-> Internal: Bullish.
Analysis and bias remains the same as yesterday's analysis dated 02 December 2025.
Price has printed as per analysis dated 14 November 2025 where I mentioned price to trade down to either discount of 50% internal EQ, or M15 demand zone before targeting weak internal high, priced at 4,245.195.
Price subsequently printed a bearish CHoCH, however, as mentioned yesterday, I would closely monitor price with respect to depth of pullback.
Price did not pull back with any significance, therefore, I will apply discretion and not classify an iBOS. I have marked this with red dotted and dashed lines.
Price has since printed another bearish CHoCH.
We are currently trading within an established internal range, however, as per yesterday, I will continue to monitor price with respect to depth of pullback.
Intraday expectation:
Price to trade down to either discount of 50% internal EQ, or M15 demand zone before targeting weak internal high, priced at 4,264.700.
Note:
Gold remains highly volatile amid the Federal Reserve's continued dovish stance, persistent and escalating geopolitical uncertainties. Traders should implement robust risk management strategies and remain vigilant, as price swings may become more pronounced in this elevated volatility environment.
Additionally, President Trump’s tariff announcements, particularly against China, are expected to further amplify market turbulence, potentially triggering sharp price fluctuations and whipsaws.
M15 Chart:

XAU/USD 28 November 2025 Intraday AnalysisH4 Analysis:
-> Swing: Bullish.
-> Internal: Bullish.
Analysis and bias remains the same as analysis dated 20 October 2025.
Price has printed as per previous intraday expectation by printing a bearish CHoCH which indicates, but not confirms, bullish pullback phase initiation.
Price is currently trading within an established internal range, however, I will continue to monitor price with regards to depth of pullback.
Intraday expectation:
Price to continue bearish, react at either discount of 50% internal EQ, or H4 supply zone before targeting weak internal high priced at 4,380.990.
Note:
The Federal Reserve’s sustained dovish stance, coupled with ongoing geopolitical uncertainties, is likely to prolong heightened volatility in the gold market. Given this elevated risk environment, traders should exercise caution and recalibrate risk management strategies to navigate potential price fluctuations effectively.
Additionally, gold pricing remains sensitive to broader macroeconomic developments, including policy decisions under President Trump. Shifts in geopolitical strategy and economic directives could further amplify uncertainty, contributing to market repricing dynamics.
H4 Chart:
M15 Analysis:
-> Swing: Bullish.
-> Internal: Bullish.
As per analysis dated 14 November 2025, price has printed a bearish CHoCH to indicate, but not confirm bearish pullback phase initiation.
Price is currently trading within an established internal range.
Intraday expectation:
Price to trade down to either discount of 50% internal EQ, or M15 demand zone before targeting weak internal high, priced at 4,245.195
Note:
Gold remains highly volatile amid the Federal Reserve's continued dovish stance, persistent and escalating geopolitical uncertainties. Traders should implement robust risk management strategies and remain vigilant, as price swings may become more pronounced in this elevated volatility environment.
Additionally, President Trump’s tariff announcements, particularly against China, are expected to further amplify market turbulence, potentially triggering sharp price fluctuations and whipsaws.
M15 Chart:

XAUUSD BUYI took shot trade trade on asian session and price of gold went and touch demand zone were there was also bullish order block that push price to create another leg of W(Double bottom) and i expect price to pullback to a below marked Fair value gap and continue to BUY for a long term since buyers dominated the market for a while.

XAU/USD 27 November 2025 Intraday AnalysisH4 Analysis:
-> Swing: Bullish.
-> Internal: Bullish.
Analysis and bias remains the same as analysis dated 20 October 2025.
Price has printed as per previous intraday expectation by printing a bearish CHoCH which indicates, but not confirms, bullish pullback phase initiation.
Price is currently trading within an established internal range, however, I will continue to monitor price with regards to depth of pullback.
Intraday expectation:
Price to continue bearish, react at either discount of 50% internal EQ, or H4 supply zone before targeting weak internal high priced at 4,380.990.
Note:
The Federal Reserve’s sustained dovish stance, coupled with ongoing geopolitical uncertainties, is likely to prolong heightened volatility in the gold market. Given this elevated risk environment, traders should exercise caution and recalibrate risk management strategies to navigate potential price fluctuations effectively.
Additionally, gold pricing remains sensitive to broader macroeconomic developments, including policy decisions under President Trump. Shifts in geopolitical strategy and economic directives could further amplify uncertainty, contributing to market repricing dynamics.
H4 Chart:
M15 Analysis:
-> Swing: Bullish.
-> Internal: Bullish.
As per analysis dated 14 November 2025, price has printed a bearish CHoCH to indicate, but not confirm bearish pullback phase initiation.
Price is currently trading within an established internal range.
Intraday expectation:
Price to trade down to either discount of 50% internal EQ, or M15 demand zone before targeting weak internal high, priced at 4,245.195
Note:
Gold remains highly volatile amid the Federal Reserve's continued dovish stance, persistent and escalating geopolitical uncertainties. Traders should implement robust risk management strategies and remain vigilant, as price swings may become more pronounced in this elevated volatility environment.
Additionally, President Trump’s tariff announcements, particularly against China, are expected to further amplify market turbulence, potentially triggering sharp price fluctuations and whipsaws.
M15 Chart:

XAU/USD Chart Analysis: Market Volatility Eases (Again)XAU/USD Chart Analysis: Market Volatility Eases (Again)
As the daily XAU/USD chart shows today, the ADX indicator is trending downwards following the extremely turbulent swings in October. This suggests:
→ gold price volatility is decreasing;
→ the market is finding balance around the psychological $4,000 level;
→ it recalls mid-July, when we noted a period of reduced volatility.
At that time, we:
→ drew an ascending channel;
→ observed that supply and demand were balancing each other, effectively reflecting all factors influencing the price.
Looking back, it can be noted that the market was in a consolidation phase (A) before the rally resumed (B) with renewed strength, as the price broke through the R1 resistance of the consolidation pattern.
It is reasonable to suggest a similar scenario may be occurring now, with the market in a new consolidation phase (C), and price fluctuations around the psychological $4,000 level reflecting new factors, including:
→ Anticipation of Fed action: Traders are hesitant to push prices to new highs ($4,400) without assurances of further monetary easing, yet are reluctant to sell below $3,900, as the global rate-cut cycle is not yet complete.
→ Dollar strength (DXY) at the end of October – early November.
→ Stabilisation of the geopolitical backdrop.
According to analysts from JPMorgan, Goldman Sachs, and independent experts, gold may remain within a range of $3,950 – $4,150 until the end of 2025.
By analogy with the previous situation, we can expect R2 to hold, with bulls “taking a break” while gold drifts towards the lower boundary of the current channel.
This article represents the opinion of the Companies operating under the FXOpen brand only. It is not to be construed as an offer, solicitation, or recommendation with respect to products and services provided by the Companies operating under the FXOpen brand, nor is it to be considered financial advice.

Gold continued to fluctuate on November 24th.Gold is currently trading on the hourly chart, with short-term moving averages remaining flat and converging, compressing the price between 4000-4120 and further narrowing the range to 4100-4130. Based on the current trend, the US session is likely to maintain a slightly range-bound movement. On the hourly chart, the price has broken out of the previous low-level consolidation range, and the candlestick pattern is gradually maintaining a slightly stronger upward trend along the short-term moving averages, suggesting potential for further short-term gains. However, the strength of these gains needs to be assessed, and attention should be paid to any short-term corrections or adjustments.
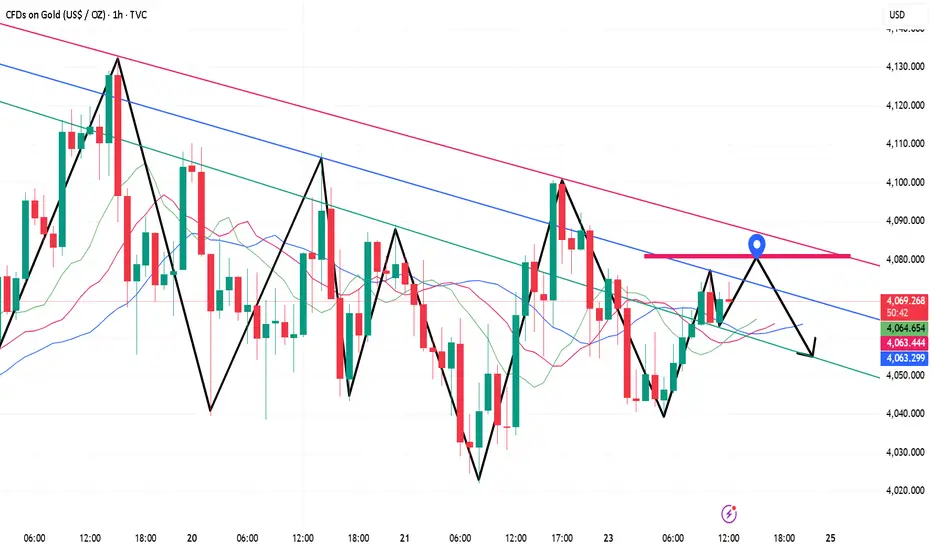
XAU/USD – Short-Term Structure & Key Reaction ZonesThis chart highlights the current short-term structure on XAU/USD. Price is holding below a recent intra-day range and showing reactions around a lower support zone. If the market pulls back into the highlighted mid-zone, it may form a corrective structure before continuing its broader downward momentum.
The upper yellow zone marks an important reaction area where price previously paused, while the lower blue zone represents the current region where price is stabilizing. The projected path illustrates a possible liquidity grab and retest phase before the market decides its next move.
This analysis focuses only on market structure, reaction zones, and potential movement behavior — not trade signals.

XAU/USD 12 October 2025 Intraday AnalysisH4 Analysis:
-> Swing: Bullish.
-> Internal: Bullish.
Analysis and bias remains the same as analysis dated 20 October 2025.
Price has printed as per previous intraday expectation by printing a bearish CHoCH which indicates, but not confirms, bullish pullback phase initiation.
Price is currently trading within an established internal range, however, I will continue to monitor price with regards to depth of pullback.
Intraday expectation:
Price to continue bearish, react at either discount of 50% internal EQ, or H4 supply zone before targeting weak internal high priced at 4,380.990.
Note:
The Federal Reserve’s sustained dovish stance, coupled with ongoing geopolitical uncertainties, is likely to prolong heightened volatility in the gold market. Given this elevated risk environment, traders should exercise caution and recalibrate risk management strategies to navigate potential price fluctuations effectively.
Additionally, gold pricing remains sensitive to broader macroeconomic developments, including policy decisions under President Trump. Shifts in geopolitical strategy and economic directives could further amplify uncertainty, contributing to market repricing dynamics.
H4 Chart:
M15 Analysis:
-> Swing: Bullish.
-> Internal: Bearish.
You will note how price remains contained in consolidation between a supply and demand zone. The rest of my analysis and bias remains the same as bias date 29 October 2025.
As expected, price has printed a bullish CHoCH to indicate bullish pullback phase initiation.
Price is now trading within an established internal range.
Intraday expectation:
Price to continue bullish, react at either premium of internal 50% EQ or M15 demand zone before targeting weak internal low, priced at 3,886.465.
Note:
Gold remains highly volatile amid the Federal Reserve's continued dovish stance, persistent and escalating geopolitical uncertainties. Traders should implement robust risk management strategies and remain vigilant, as price swings may become more pronounced in this elevated volatility environment.
Additionally, President Trump’s tariff announcements, particularly against China, are expected to further amplify market turbulence, potentially triggering sharp price fluctuations and whipsaws.
M15 Chart:

XAU/USD 05 November 2025 Intraday AnalysisH4 Analysis:
-> Swing: Bullish.
-> Internal: Bullish.
Analysis and bias remains the same as analysis dated 20 October 2025.
Price has printed as per previous intraday expectation by printing a bearish CHoCH which indicates, but not confirms, bullish pullback phase initiation.
Price is currently trading within an established internal range, however, I will continue to monitor price with regards to depth of pullback.
Intraday expectation:
Price to continue bearish, react at either discount of 50% internal EQ, or H4 supply zone before targeting weak internal high priced at 4,380. 990.
Note:
The Federal Reserve’s sustained dovish stance, coupled with ongoing geopolitical uncertainties, is likely to prolong heightened volatility in the gold market. Given this elevated risk environment, traders should exercise caution and recalibrate risk management strategies to navigate potential price fluctuations effectively.
Additionally, gold pricing remains sensitive to broader macroeconomic developments, including policy decisions under President Trump. Shifts in geopolitical strategy and economic directives could further amplify uncertainty, contributing to market repricing dynamics.
H4 Chart:
M15 Analysis:
-> Swing: Bullish.
-> Internal: Bearish.
Analysis and bias to remain the same as yesterday's bias date 29 October 2025.
As expected, price has printed a bullish CHoCH to indicate bullish pullback phase initiation.
Price is now trading within an established internal range.
Intraday expectation:
Price to continue bullish, react at either premium of internal 50% EQ or M15 demand zone before targeting weak internal low, priced at 3,886.465.
Note:
Gold remains highly volatile amid the Federal Reserve's continued dovish stance, persistent and escalating geopolitical uncertainties. Traders should implement robust risk management strategies and remain vigilant, as price swings may become more pronounced in this elevated volatility environment.
Additionally, President Trump’s tariff announcements, particularly against China, are expected to further amplify market turbulence, potentially triggering sharp price fluctuations and whipsaws.
M15 Chart:

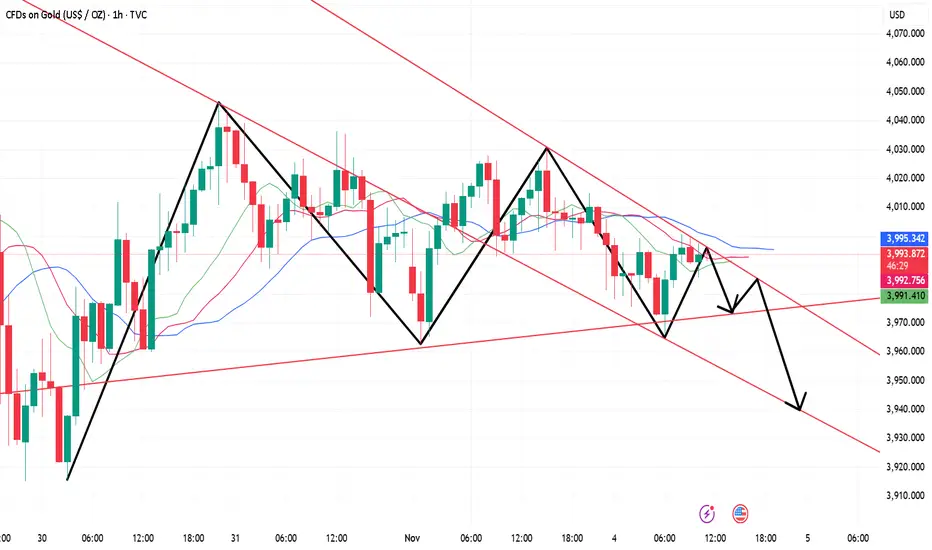
Gold Short-Term Technical Analysis Guide (November 4th)!!!Gold is showing a converging pattern on the 1-hour chart, with moving averages clearly intertwined and failing to establish a strong directional trend. Gold is currently facing resistance around the 4000 level and hasn't shown a strong upward breakout. If gold breaks through and holds above 4000, then the 4020-4030 resistance zone should be monitored during the US session. Overall, gold is expected to remain in a range-bound market.
XAU/USD 31 October 2025 Intraday AnalysisH4 Analysis:
-> Swing: Bullish.
-> Internal: Bullish.
Analysis and bias remains the same as analysis dated 20 October 2025.
Price has printed as per previous intraday expectation by printing a bearish CHoCH which indicates, but not confirms, bullish pullback phase initiation.
Price is currently trading within an established internal range, however, I will continue to monitor price with regards to depth of pullback.
Intraday expectation:
Price to continue bearish, react at either discount of 50% internal EQ, or H4 supply zone before targeting weak internal high priced at 4,380. 990.
Note:
The Federal Reserve’s sustained dovish stance, coupled with ongoing geopolitical uncertainties, is likely to prolong heightened volatility in the gold market. Given this elevated risk environment, traders should exercise caution and recalibrate risk management strategies to navigate potential price fluctuations effectively.
Additionally, gold pricing remains sensitive to broader macroeconomic developments, including policy decisions under President Trump. Shifts in geopolitical strategy and economic directives could further amplify uncertainty, contributing to market repricing dynamics.
H4 Chart:
M15 Analysis:
-> Swing: Bullish.
-> Internal: Bearish.
Analysis and bias to remain the same as yesterday's bias date 29 October 2025.
As expected, price has printed a bullish CHoCH to indicate bullish pullback phase initiation.
Price is now trading within an established internal range.
Intraday expectation:
Price to continue bullish, react at either premium of internal 50% EQ or M15 demand zone before targeting weak internal low, priced at 3,886.465.
Note:
Gold remains highly volatile amid the Federal Reserve's continued dovish stance, persistent and escalating geopolitical uncertainties. Traders should implement robust risk management strategies and remain vigilant, as price swings may become more pronounced in this elevated volatility environment.
Additionally, President Trump’s tariff announcements, particularly against China, are expected to further amplify market turbulence, potentially triggering sharp price fluctuations and whipsaws.
M15 Chart:

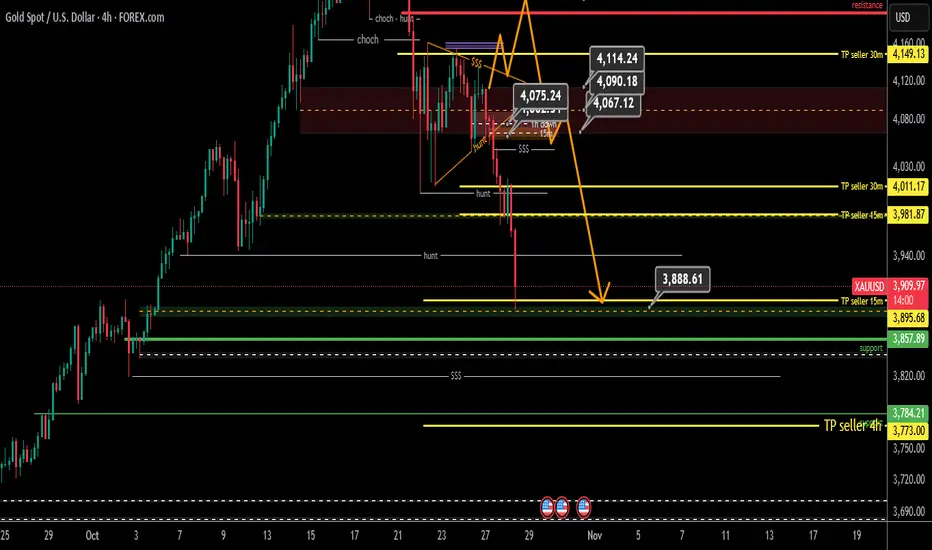
Update Two 4-Hour Gold Analysis
Hello Traders
So far, yesterday's analysis target has been touched, but the seller is still present in the market, and today the 4-hour seller entered the market, and the long-term 4-hour analysis that we had last week gained more strength, the 4-hour sellers target was defined as 3773, which was explained in the relevant post about the entry of sellers. So, every pullback will still have more sellers in the market. For the sell, all the yellow lines of the TPs settled by the candlestick failure act as current resistance and are considered the pullback zone.
Good luck.
Links to the two analyses:
Beware of Black Friday as gold prices fall againOn Friday, the Asian session reaffirmed the upper resistance level of the channel at 4142-4144, further declining to 4081.
Can this trend continue, with the market holding highs and breaking lower, and breaking through the lower double-line on the hourly chart, the next support area to watch is the lower channel at 3990-3980.
The 3980 area is what we call the target point, representing a gap of exactly $400 compared to the historical high of 4380.
The hourly chart is sweeping the double-line range, with a breakout further opening up the market.
The upper channel is slightly further away at 4180, while the lower channel is getting closer. In the 4035 range
Support and resistance levels are shifting. If the market breaks below the lower double-line at 4035, the next target is the 4014-4004 low. The next target is the lower channel line, and breaking through it will continue the trend.
Holding highs is key, and breaking lows is crucial. Although the market fluctuates greatly, each initial move follows its own pattern.
Starting an uptrend, holding lows and breaking highs, holding lows throughout the process, and continuing the bullish climb.
Starting a downtrend, holding highs and breaking lows, holding highs throughout the process, and continuing the bearish decline.
To summarize, two points:
1. Maintain a cycle Regarding the rhythm of the decline, the area around 4100 should be considered as the dividing line. Looking down, we should look to the 4080 area. A break below this level could lead to further trading volume (don't expect a large rebound to confirm resistance).
2. A wide-ranging sweep, with the high of 4144 as a defensive measure, requires considering the 4133-4135 area, and then looking for leverage to complete a break below the lower low (this rebound will be more powerful, requiring additional attention to the highs).
Thus, regarding the future gold price, we should refer to the above-mentioned approach. First, the 4144 high should be used as a defensive measure. Here, we should consider the 4133-4135 area, and then look for leverage to complete a break below the lower low (this rebound will be more powerful, requiring additional attention to the highs). Pressure around 00: A slow decline is needed to break the lows. Time is used to buy space to find the lower band of the channel.
First, pressure at 4135 represents a correction. A break above 4080 will be leveraged to move lower, followed by a large-scale decline.
Focus on gains and losses at 4080. If it breaks below, the next target is the lower double line at 4035. Breaking through this level will lead to lower points at 4014-4004. Finally, focus on the lower band of the channel at 3990-3980.
Note: A break above this high will indicate a change in the nature of the market.
Clearly define your defenses, establish your strategy, implement risk control measures, and strictly enforce them.

Gold Fundamentals | Smart Money Buy Zones (10/21/2025)BELOW IS DETAILED ANALYSIS ON GOLD (10/21/2025)
Central Bank Buying Surge 🏦
Central banks, especially from BRICS nations, added 77% more gold reserves in 2025, hitting record highs and pushing prices up amid de-dollarization fears.
🥇 Silver benefits indirectly as industrial demand grows 17% YoY from solar and EVs.
This trend could add $200-300/oz to gold by year-end.
ETF Inflows Hit $41B 📈💸
Gold ETFs saw $38B inflows in H1 2025, strongest since 2020, while silver ETFs added $3.6B (95M oz).
This reflects retail and institutional flight to safety, but overbought RSI warns of 5-10% pullback risk soon ⚠️.
Silver Deficit Deepens ⚙️🥈
Cumulative silver deficit reached 750M oz over 4 years (75% of annual supply), driven by booming industrial use in renewables.
Expect prices to test $55+ if deficits persist into 2026 💥.
Latest Tweets from Key Figures Impacting Gold/Silver 🐦
Influencers warn Trump’s tariffs could spike silver to $60 on supply chain chaos.
highlights Fed dovishness fueling $4,300 gold breakouts amid trade war fears.
Option Inflows💬📊
SLV open interest peaks at Oct 17/Nov 21 expiries, with put IV at 62.9% vs call 53.8% at $46 strike showing downside hedge bets amid tariff buzz.
Net bullish $36M call premium at $49-50 strikes signals $55 targets if squeeze hits 🚀.
Latest Geopolitical Events 🌎🔥
US-China tensions escalate with new export controls on rare earths and batteries, driving safe-haven buys
gold tops $4,300, silver $54.
Russia-Ukraine stalemate and Middle East flares add volatility,
but BRICS de-dollarization supports long-term uptrend 🏦.
Latest Fundamentals 📊💵
Gold up 58% YTD on inflation hedges and $38B ETF inflows;
silver surges 79% from 1B oz supply deficit and 17% industrial demand growth.
Fed rate cuts lower holding costs, targeting gold $4,400 and silver $57 by mid-2026 🎯.
Current Prices (as of Oct 21, 2025) ⏰💰
Gold spot: $4,362 USD/oz, up 0.10% today and 16.41% monthly.
Silver spot: $51.20 USD/oz, down 5.6% from $54.47 record but up 74% YTD.
Conclusion 💎
Gold and silver are in a strong bull run, fueled by trade wars, Fed easing, and supply shortages ideal for safe-haven plays.

10.20 Gold short-term resistance looks at 4280Gold prices twice confirmed their all-time high of 4380 before falling, the first time by $100 and the second time by nearly $200.
Last Friday, gold prices were insane, plummeting from 4380 to 4279, leaving $100 of room for further gains, before rising another $100 to find 4380.
After confirming resistance at 4380 for the second time, the price continued to rise, signaling a downward trend. Pressure was placed on the short side at 4380, 4355, 4350, 4321, and 4364. The price continued to move around the established downward trend, gradually shifting between levels, and finally accelerating to 4186 before ending the decline.
The price rebounded in late trading, returning to the 4250 mark to end the week!
Judging from Monday's market action, the market has entered a broad range-bound sweep. Specifically, the bullish rally may have temporarily paused, gathering momentum for a subsequent rebound.
We must clearly understand the positioning of our defensive lines. When these lines are breached, adjustments and changes must be made:
1. Coordination between the two lines on the hourly and 30-minute charts
It has fallen back into the 30-minute chart's two-line range, between 4280 and 4110.
It remains above the upper limit of the two lines on the hourly chart, at 4221. Although it broke briefly last Friday, the closing price quickly recovered. Support is also being sought at 4221 in the European session this afternoon.
The upper limit of the two lines, 4280-4220, is where the support is being sought.
If the price breaks through this range, the nature of the market will begin to change.
2. Top and bottom reversal positions and Within the small channel, pressure is building up in the 4280-4385 area. The lower band is extending and expanding, focusing on the 4180-4200 range.
In the Asian session, prices fluctuated around the 4219-4271 range. In the afternoon, we confirmed that the 4268 area was beginning to bearishly bearish. Based on this strategy, we chose to enter a bearish position from above, targeting the 4220 area. Once the price started to move, we would aggressively chase the price, pursuing the bearish trend until it accelerated to the 4221 area.
Short-term strategies for the European and US sessions
1. Short-term trading in the 4278-4282 area, with the upper pressure at 4286, a stop-loss at 4298, and a target of 4250. The next target is 4225-4215.
2. After completing the $100 sweep, focus on the 4320 area for short selling. The specific target is a bit further out, so stay tuned for real-time alerts.
3. Currently, the price has returned to around 4260, so we will wait for the plan in the first point.

XAU/USD 16 October 2025 Intraday AnalysisH4 Analysis:
-> Swing: Bullish.
-> Internal: Bullish.
Analysis and bias remains the same as yesterday's analysis, however CHoCH positioning has moved closer to more recent price action.
Price has printed a further bullish iBOS, however, I will apply discretion and not classify it as such due to the insignificant depth of pullback relative to recent price action.
At the time of this analysis price is continuing to print bullish without pause, which, as a result, I am unable to confirm a fractal high.
Current bearish CHoCH positioning is denoted with a blue horizontal dotted line.
Intraday expectation:
Price to print bearish CHoCH to indicate bearish pullback phase initiation.
Note:
The Federal Reserve’s sustained dovish stance, coupled with ongoing geopolitical uncertainties, is likely to prolong heightened volatility in the gold market. Given this elevated risk environment, traders should exercise caution and recalibrate risk management strategies to navigate potential price fluctuations effectively.
Additionally, gold pricing remains sensitive to broader macroeconomic developments, including policy decisions under President Trump. Shifts in geopolitical strategy and economic directives could further amplify uncertainty, contributing to market repricing dynamics.
H4 Chart:
M15 Analysis:
-> Swing: Bullish.
-> Internal: Bullish.
Price has continued bullish printing further ATH's.
Price has printed a bullish iBOS and has reacted from discount of 50% EQ.
Intraday expectation:
Price to target weak internal high, priced at 4,242.380.
Alternative scenario: As all higher timeframes are requiring a pullback, and we are seeing a narrowing of internal structure, price could target strong internal low.
Note:
Gold remains highly volatile amid the Federal Reserve's continued dovish stance, persistent and escalating geopolitical uncertainties. Traders should implement robust risk management strategies and remain vigilant, as price swings may become more pronounced in this elevated volatility environment.
Additionally, President Trump’s tariff announcements, particularly against China, are expected to further amplify market turbulence, potentially triggering sharp price fluctuations and whipsaws.
M15 Chart:

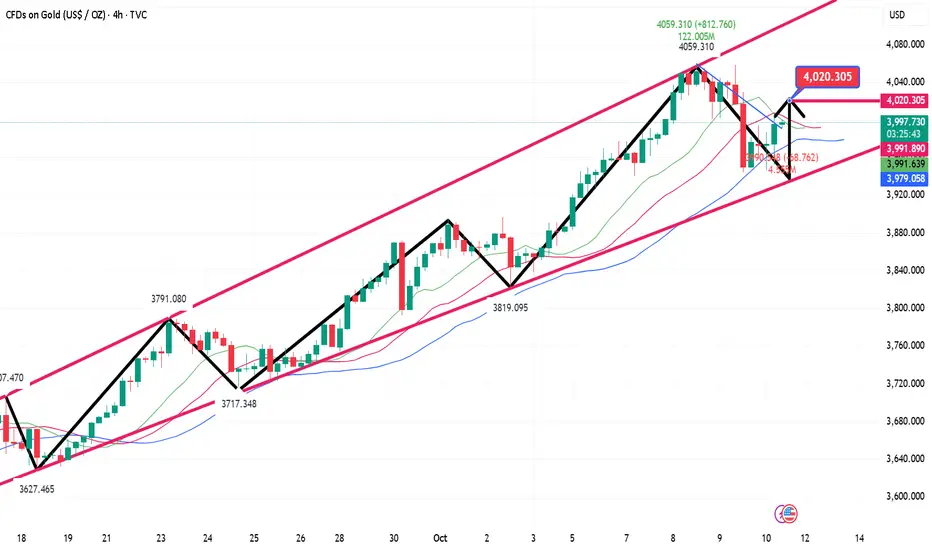
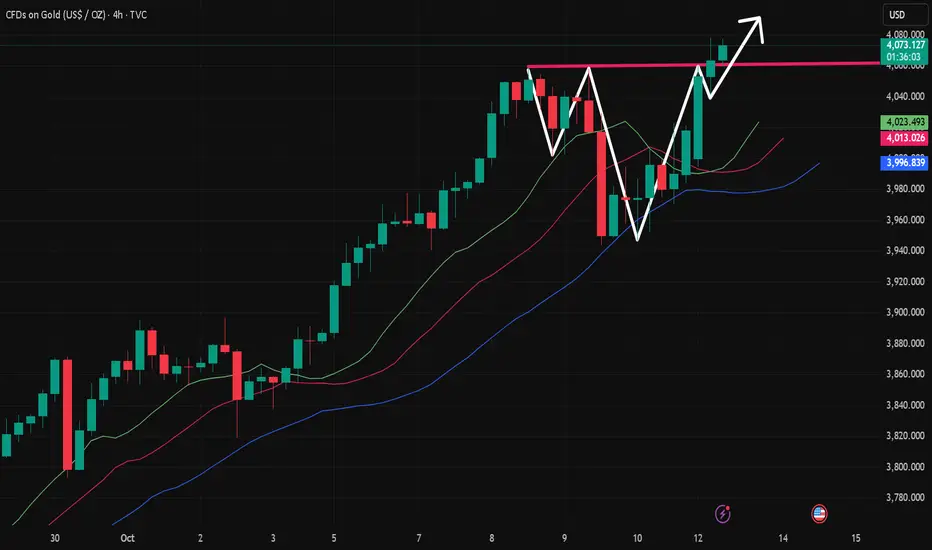
Monday's Gold Operation Analysis Guide!!!Gold has broken through its previous high, which is a standard continued upward trend and V-shaped reversal. The original horizontal pressure of 4060 has become a thing of the past. We can only focus on the expected decline opportunity of the trend line to buy!!!
Gold will continue to rise at the end of the week!!!Gold is currently consolidating at a high level on the daily chart, nearly forming an engulfing pattern at a high level, making today's daily close crucial. On the 4-hour chart, prices are currently fluctuating at a low level, finding support around 3950. On the hourly chart, after continuous fluctuations, the technical pattern is gradually adjusting. The short-term moving average is gradually diverging upward, and the K-line chart is slowly crossing the short-term moving average. The short-term trend is gradually strengthening, suggesting further upside potential. Keep an eye on the resistance zone around 4010.
Trade Recommendation: Buy around 3975-6, with a stop-loss at 3966.