XAUUSD , Its in way of going toward the targetHello everybody
Did you check our last analysis of GOLD ?
According to the chart you can see the price came to in important support zone area and we expect the price is ready to go up and reach to the target after making range price zone.
Previous analysis :
Good Luck
Abtin
Goldusdollar

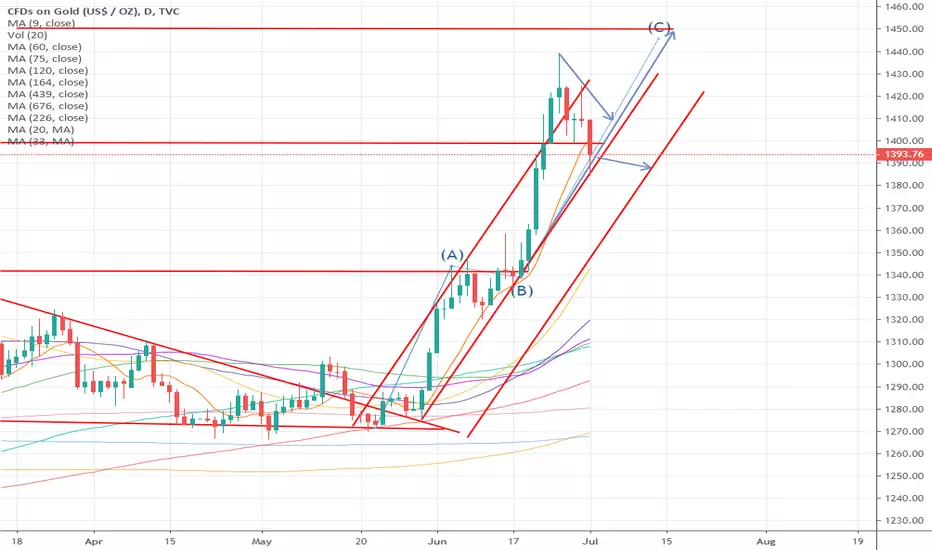
GOLD XAUUPDATE
#1 XAU - GOLD NEOWAVE ANALYSIS
I THINK GOLD CAN REACH ATH AGAIN
Gold is a chemical element with the symbol Au and atomic number 79, making it one of the higher atomic number elements that occur naturally. In a pure form, it is a bright, slightly reddish yellow, dense, soft, malleable, and ductile metal. Chemically, gold is a transition metal and a group 11 element.

GOLDInflation data in the USA are negative. Just like other developed countries. A rate hike may come. This could be positive for gold.

Gold Getting Ready For Higher Prices?As we examine the Gold chart we see the volatility has been increasing over the last few months. Many believe the price of Gold has become stagnant and will not perform well this year. As we look closely at the chart, we see the price has sold off over the last few weeks but seems to be holding support levels so far. It's possible we're seeing an Inverted Head & Shoulders pattern forming that could push the price above the 2011 previous all-time high. We'll need to be patient and see how price reacts over the next few weeks, but if we continue to see strength, then the likelihood of seeing new highs this year will increase by the day.

GOLD is super Bullish. Gold is bullish, and we look for a buy on a retest of 1880-1884 zone for a good buy, and our first target would be 1920 followed by 1950.
Go against the trend and especially in gold, is not a good idea.
This is not financial advice; It is just an idea. The market can go in the opposite direction, So follow proper risk management.

GOLD in a massive sell.Gold finally able to break the consolidation zone. We have to wait for a retest around 1719~1723 Area, another massive sell till 1700 followed by 1680.
Do not consider this as a piece of financial advice—this Above chart analysis based on experience with the combination of technical and fundamental Knowledge. Please follow proper risk management parameters to trade in the market.
Have a nice day.
The Financial Regime

GOLD IS BULLISH LONGTERMAiming towards 1910 on gold and then a breakout to higher resistance levels and hepfully pass the main ones i highlighed, specially the MAJOR resistance. 2K Stimulus strong possibility and a really good catalyst. Stimulus check might be a seperate standalone bill, so good news for gold if passes. More money printing for the other seperate bills that add up to similar government spending. GOLD bullish overall longterm. Maybe buy the rumor & sell the NEWS coming up(Christmas rally, Jan-Feb correction), Goodluck!

JNUG - Daily Junior Gold Miners Index 2x Bull;AMEX:JNUG
.
Gold Short Interest being at 16 year highs and all... (You know the deal -> just follow the arrows.)
.

GOLD - 8hr.; Short Interests @16 year high!! Here is what to do.COMEX:GC1!
Here is the G/S (Gold / Silver)
... and here is the USD - DXY

GOLD UPDATE- How far gold can Fall ?How far gold can fall, well harmonic patterns suggesting a probability of bat pattern , which can take gold price to 1716 levels, plus these levels are also aligned with price action support around 1680 levels.
There is a intermediate support around 1800 levels, so keep an eye on price action around this level, you might see temporary bounce from here.
So as of now, according to my analysis 1716- 1680 this is the zone up to which gold prices can or may fall.
This bat pattern probability would get negated if price closed above 1970 levels.
If in future I spot any changes in prices , I will update here accordingly.
If you are trading this, you are trading completely on our own risk.

GOLD BUY CONT. TO $1966UPDATE TO OUR BUY ALERT GIVEN LAST WEEK
WE STILL ARE BULLISH ON THIS ONE !
THE TRADING REGIME !
OANDA:XAUUSD

GOLD to 2200$Gold is staying on his uptrend and his push not yet finish.
Retracement Ligne have been crossed up already.
- Support at 1950$ with Double EMAs 50-100
- Second Support 1925$ with EMA200
Next push should propulse us around 2200$ according to Fibonacci.
Happy Tr4Ding !


My prediction on GoldGold is going to move down to the first target zone 1147-1266.
It will probably find support at the channel line or a bit below
and inside the target zone and then it wil turn bullish with
target the zone 1912-2156

buy goldBUY 1470 OR 1480
STOP LOSS : 1445
TARGET: 1546
risk/reward: 2.78
thanks please follow me see you later

Gold short positionComment: **Disclaimer** the content on this analysis is subject to change at any time without notice, and is provided for the sole purpose of assisting traders to make independent investment decisions.

ANALYSIS ON XAUUSD (goldusd)ANALYSIS ON XAUUSD (goldusd)
Welcome to my analysis
-
30Min CHart
-
Interesting Point of interest In the XAUUSD pair.
- Price below 100/200 day EMA.
- Buy reversal.
- Expecting more Upward momentum.
- Watch 1471.82-1481.00 for take profit.
- MACD showing bullish divergence
Stay Tuned

Gold Bearish trend is comingHi Guy
At the moment gold on strong resistance area around 1530, will reject from this area??
gold already try 3 times to cross 1530 but rejected, now this time again testing but will reject it and dump soon.
also stochastic RSI are overbought area and also 30 MA cross to 100MA. So most probably chances that will dump and this time will break strong support.

GOLD BUY TP_1775.47_17.37%_262.74pipsSL_1488.20_1.62%_24.53pipsGOLD BUY TP_1775.47_17.37%_262.74pipsSL_1488.20_1.62%_24.53pips

GOLD DOLLAR UPDATE - XAUUSD - BULL OR BEARKeep an eye out on this pair. Could give a good chance up or down
we are currently seeing a reversal at the moment but longer term upmove is expected.

Daily Gold price trend prediction !!30-Jun
Price forecast timing analysis based on pretiming algorithm of Supply-Demand(S&D) strength.
Investing position about Supply-Demand(S&D) strength: In Rising section of high profit & low risk
Supply-Demand(S&D) strength Trend Analysis: In the midst of an adjustment trend of downward direction box pattern price flow marked by limited rises and downward fluctuations.
Today's S&D strength Flow: Supply-Demand(S&D) strength flow appropriate to the current trend.
read more: www.pretiming.com
D+1 Candlestick Color forecast: RED Candlestick
%D+1 Range forecast: 0.1% (HIGH) ~ -0.3% (LOW), -0.2% (CLOSE)
%AVG in case of rising: 0.8% (HIGH) ~ -0.1% (LOW), 0.6% (CLOSE)
%AVG in case of falling: 0.3% (HIGH) ~ -0.7% (LOW), -0.4% (CLOSE)

Don't miss the great sell opportunity in GoldTrading suggestion:
. There is a possibility of temporary retracement to resistance support line (1280.90). if so, traders can set orders based on Price Action and expect to reach short-term targets.
Technical analysis:
. XAUUSD is in a range bound and the beginning of downtrend is expected.
. Price is below WEMA21, if price rises more, this line can act as dynamic resistance against more gains.
. The RSI is at 29.
Take Profits:
TP1= @ 1272.90
TP2= @ 1260.60
TP3= @ 1240.55
SL= @ 1285.25
