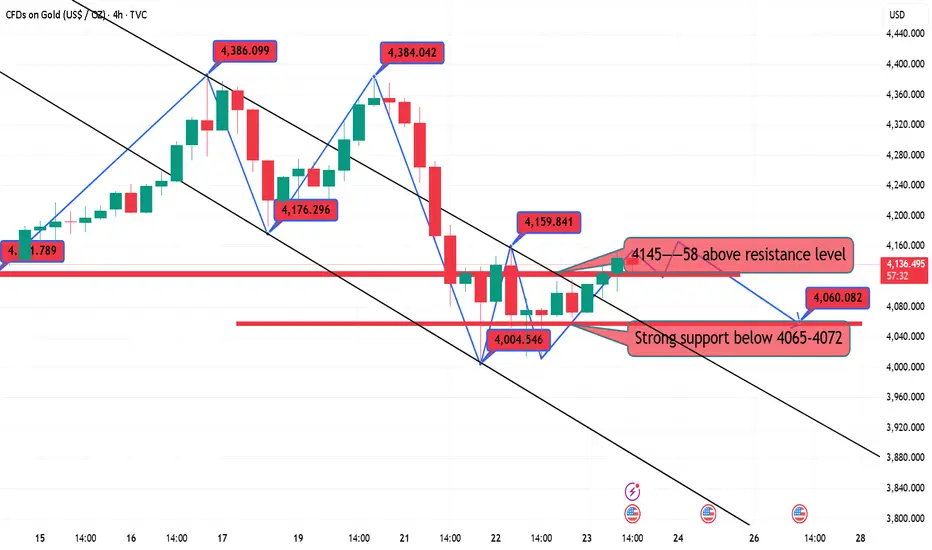
10.24 Gold US Trading Strategy, Bulls Bottom Out and Rebound as Looking at the 4-hour market trend, the current short-term resistance level at 4142-50 is being monitored on the upside, while the short-term support level at 4065-4070 is being monitored on the downside. Gold is under pressure and difficult to break through. For trading, the primary strategy is to go long on pullbacks. In the middle, be cautious and follow orders carefully, patiently waiting for key entry points. I will provide detailed trading strategies during the trading session, so please stay tuned.
Gold Trading Strategy:
1. If gold rebounds and doesn't break through the 4145-52 level, go short. Set a stop-loss at 4160, and target the 4015-4000 level. Hold if it breaks through!
2. If gold retraces to the 4085-93 level, go long. Set a stop-loss at 4073, and target the 4130-35 level. Hold if it breaks through!
Golem
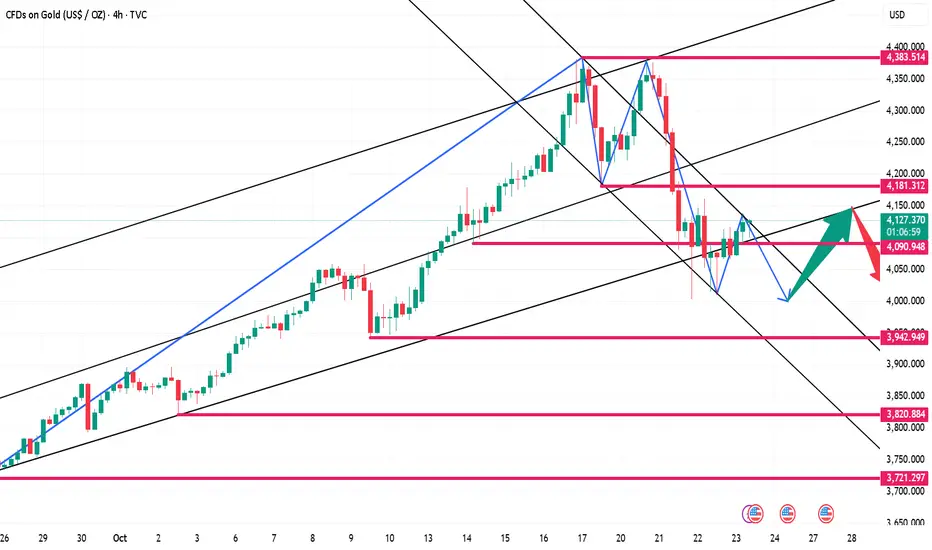
10.23 Gold Intraday Short-Term Technical Guide!!!From a big-picture perspective, gold should continue its upward trend as real interest rates are expected to continue to decline as the Fed's policy turns dovish. However, in the short term, a re-adjustment of interest rate expectations could trigger a further correction.
Technical Analysis:
On the 4-hour chart, gold prices have broken below the neckline of the double top pattern, strengthening bearish momentum. The neckline will now become a new resistance level, where bears may position themselves, with stops set above resistance, aiming for a further break below the trendline. Bulls, on the other hand, would like to see gold prices re-break through the neckline, thereby negating the bearish pattern and pushing prices back to higher levels.
Gold goes on a roller coaster ride. Continue to short below 4100Looking back at the price of gold since the beginning of the year, it has risen by over 50%, with an increase of over 25% in just two months. Those who bought in early on have made a killing, and at the first sign of trouble, they naturally want to sell to lock in profits. This concentrated sell-off can easily trigger panic. Leveraged margin calls exacerbate volatility: The recent surge has attracted many investors to leverage their positions. If prices fall rapidly, these leveraged positions will be forced to close, amplifying the decline like dominoes.
Returning to the one-hour gold chart, US gold will continue to fluctuate between 4100 and 4020. The current trend is volatile and weak, so adopt a high-sell strategy! Go short on a dip to 4080, with an eye on the 4000 area below!
Specific Strategy
Sell gold below 4100, stop loss at 4110, target 4000.

10.22 Gold rebounds and continues to be shortGold's 4-hour moving average has formed a death cross, signaling a downward bearish trend. Gold still has downward momentum. Despite today's rebound in the US market, it continued to decline rapidly. This suggests the bullish rally is weakening. Gold rebounded to around 4085 before turning downward. While gold remains under pressure at 4085, it's still a good time to continue shorting.
Gold has formed a short-term bearish double top, and the bullish rebound has failed to re-stabilize the neckline of the double top. Gold remains a bearish market, and rebounds continue to offer opportunities for short sellers.

GLM/USDT THE BEST COIN FOR 270% POWER ATH INCREASEGLM/USDT IS THE BEST COIN FOR 270% POWER ATH INCREASE
There are more coins on the coinmarketcap, GLM l looks depending on our study the best coin for 270% BREAK And new ATH listing 2025
There is a high volume from KRW, and already 2 whales first entries made.
Let's see what the time can bring.

GLMUSDT(Golem) Updated till 16-02-25GLMUSDT(Golem) Daily timeframe range. finally we can see some move here. almost reached close to 0.4504. now if it can get a valid close above 0.3355 it can revisit there again. local low and support still at 0.2323.

(GLM) golem network "most active in russia"data provided by crunchbase.com per semrush shows Golem is most active in Russia.

GLMUSD - Large W PatternThis is the non-log chart for GLMUSD which shows a possible W pattern forming with the right bullish side yet to be experienced.
This is similar to what I have seen on XRPUSD.
If we do see a bull move it will be one to complete this larger W structure.

Prime Opportunity: Golem (#GLMUSDT) Major Bullish Move!I’m excited to share a trade setup for my favorite coin at the moment: Golem (#GLMUSDT).
Both the GLMUSDT and GLMBTC pairs are showing extremely bullish potential, and the price action is aligning perfectly with our trading strategy.
Key Points:
*Elliott Wave Pattern: The current chart reveals a compelling Elliott Wave pattern. Notably, wave 5 hasn't commenced yet, presenting an excellent buying opportunity, especially with the recent completion of the ABC correction.
*Perfect Pullback: This recent pullback is exactly what I've been waiting for. It marks the end of the correction phase and the beginning of a potential new upward movement.
Trade Setup:
*Entry Triggered: Today, my trade setup was triggered, offering a solid 1:3 risk/reward ratio. The current setup is highly favorable for entering a long position, capitalizing on the anticipated wave 5.
Conclusion:
Bullish Outlook: The bullish sentiment for Golem is strong, and this setup provides a promising opportunity for substantial gains. If you follow this trade, you might be thanking me later.
Happy trading!

GLMUSDT(Golem) Daily tf Range Updated till 06-05-24GLMUSDT(Golem) Daily timeframe range. not far away from its old high and its retraced very well byfar. trying to break through 0.6308 if it can 0.7657 will be a place that can lead. another alt close to price discovery.

Golem GLM price is in an interesting and promising pattern#Golem CSE:GLM is a project with a history dating back to 2017
However, it attracted our attention not because of its history, but because of its high volatility in recent weeks and fairly good overall trading volume.
It seems that in 2024, they began to realize the growth for which they accumulated coins during 2022-23.
"The shadows" on top of the daily candlesticks over the past 3 days hint that someone is selling aggressively, locally, but selling. That is, a local correction is possible.
But it seems like a good idea to take a closer look at the #GLMUSDT long in the range of $0.40-0.43 with a target of +150% growth.
What do you think of this?

GLMUSDT(Golem) Daily tf Range Updated till 29-04-24GLMUSDT(Golem) Daily timeframe range. close to 0.5901 breaking it clean can led it to its old high. even on bigger mcap fluctuation its holding well for now. it got chances depend on holders, above 0.7319 is pretty much price discovery.

GLM, the DOGE of 2024?GLM / 3D
Shared this chart right before it bounced back from the 1.618 Fibonacci extension
IF it goes as the fractal suggests, we should be expecting a re-test of the 1.618 level.
Otherwise, next target is $1+

Golem (GLM) formed bullish Gartley for the next price reversalHi dear friends, hope you are well and welcome to the new trade setup of Golem (GLM) token with US Dollar pair.
Previously we caught almost 37% pump of GLM as below
On a 4-hr time frame, GLM has formed a bullish Gartley for the next price reversal.
Note: Above idea is for educational purpose only. It is advised to diversify and strictly follow the stop loss, and don't get stuck with trade.

Golem (GLM) forming bullish Gartley for upto 33% pumpHi dear friends, hope you are well and welcome to the new trade setup of Golem ( GLM ) token with US Dollar pair.
Recently we caught more than 36% pump of GLM as below:
Now on daily time frame, GLM has formed a bullish Gartley move for another price reversal.
Note: Above idea is for educational purpose only. It is advised to diversify and strictly follow the stop loss, and don't get stuck with trade

Golem (GLM) forming bullish Gartley for upto 14% pumpHi dear friends, hope you are well and welcome to the new trade setup of Golem ( GLM ) token with BTC pair.
Previously we had a nice trade of GLM:
Now on a 4-hr time frame, GLM is about to complete a bullish Gartley pattern.
Note: Above idea is for educational purpose only. It is advised to diversify and strictly follow the stop loss, and don't get stuck with trade

GOLEM NETWORK Rising WedgeGot news for you: GOLEM NETWORK's not the only token trending in a RW pattern. There are many others. Upper shadows are long and deep above microtrend resistance, volume is relatively low on the upthrusts. Blood is in the forecast, but perhaps not before another bull trap rally. Don't get fooled by the FOMO. Stay safe!
Be sure to subscribe for more clean, accurate, easy-to-follow swing charts with exceptionally high win ratios (80-85% average). I've been a fulltime crypto trader/investor since 2017, and I handpick all the runners myself after conducting a series of careful volume-to-spread reads and Wyckoff schematic comparisons.
Not financial advice. Always DYOR & trade at your own risk.

Golem GLM Bearish SentimentSeptember has major catalysts for the crypto market as well as for the stock market.
The Ethereum merge on September 6th, that will end on Sept 20, the inflation report on September 13 and the next FOMC meeting afterwards with the new interest rates hike.
That is reflected in the crypto space in general as a bearish outlook.
Golem GLM has a negative overall sentiment recently.
I have the following price targets:
GLM/USDT short
Entry Range: $0.21 - 0.26
Price Target 1: $0.19
Price Target 2: $0.166
Price Target 3: $0.149
Stop Loss: $0.285

Golem GLMBTC - Huge ascending triangle! + Breakout soon- On the weekly chart we can see an ascending triangle - the most bullish pattern!
- Great opportunity to 24x your capital in upcoming weeks/months.
- If we take a look at the volume indicator - bullish volume is definitely higher, which is great.
- The price is now above the 200 weekly moving average. This MA is considered as a strong support by huge institutions.
- Look at my ideas about another interesting altcoins in the related section down below ↓
- For more ideas please hit "Like" & "Follow"!

Golem (GLM) completed bullish Gartley for upto 398 huge moveHi dear friends, hope you are well and welcome to the new trade setup of Golem ( GLM ) token with BTC pair.
Previously we had a nice short-term trade of GLM:
Now on a monthly time frame, GLM has formed a big bullish Gartley pattern.
Note: Above idea is for educational purpose only. It is advised to diversify and strictly follow the stop loss, and don't get stuck with trade

Golem (GLM) completed bullish Gartley for upto 23% moveHi dear friends, hope you are well and welcome to the new trade setup of Golem ( GLM ) token with BTC pair.
On a 4-hr time frame GLM has formed bullish Gartley pattern.

GLMUSD Daily TimeframeSNIPER STRATEGY (new version)
It works ALMOST ON ANY CHART.
It produces Weak, Medium and Strong signals based on consisting elements.
NOT ALL TARGETS CAN BE ACHIEVED, let's make that clear.
TARGETS OR ENTRY PRICES ARE STRONG SUPPORT AND RESISTANCE LEVELS SO THEY CAN ACT LIKE PIVOT POINTS AND REVERSE THE WAVE (or act like a mirror that can reflects light) BASED ON STRENGTH OF THAT LEVEL.
ENTRY PRICE BLACK COLOR
MOST PROBABLE SCENARIOS TARGETS GREEN COLOR
LEAST PROBABLE SCENARIOS TARGETS RED COLOR
DO NOT USE THIS STROTEGY FOR LEVERAGED TRADING.
It will not give you the whole wave like any other strategy out there but it will give you a huge part of the wave.
The BEST TIMEFRAMES for this strategy are Daily, Weekly and Monthly however it can work on any timeframe.
Consider those points and you will have a huge advantage in the market.
There is a lot more about this strategy.
It can predict possible target and also give you almost exact buy or sell time on the spot.
I am developing it even more so stay tuned and start to follow me for more signals and forecasts.
START BELIEVING AND GOOD LUCK
HADIMOZAYAN

Golem is another old coin looking really goodFirst of all like DCR & ATOM, GLM didn't have a huge move to the upside in the previous alt season and is consolidating really hard in BTC terms. Like ATOM its chart has been a huge sideways move. GLMUSDT is looking great because it retested its old key resistance zone and bounced very nicely. The current rally is looking very healthy and actually stronger than that of DCR and ATOM.
GLM keeps having little test pumps in BTC terms and I think that's a signal for a big pump to come. GLMBTC is where it was back in 2016-2018 and has reclaimed those ATLs.
Golem is listed on Coinbase and Binance, but doesn't have many pairs. The addition to Coinbase Pro or the addition of USDT & BUSD pairs on Binance could definitely push it higher.
