GOOGL Short-term analysis | Trading and expectationsNASDAQ:GOOGL
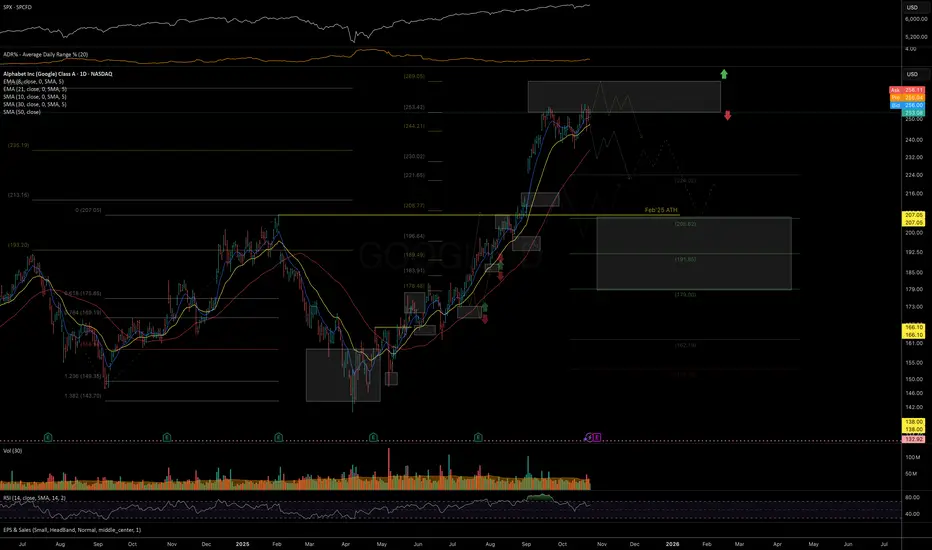
🎯 Wave III continued, price looks exhausted but just won’t stop rewarding investors. It may trap late trend-chasing investors, causing them to capitulate lower. Wave (B) of a corrective wave appears complete. Wave (C) has an initial target of the High Volume Node at $277, the 0.236 Fibonacci retracement. This is a likely area for a wave 4 correction to end in a bullish uptrend.
📈 Daily RSI has printed a bearish divergence from overbought for weeks
👉 Analysis is invalidated if price moves above wave III into all-time high
Volatility analysis | Expected range & extremities
🎯Google has been overheated for some time above the SD+3 threshold, where it is expected to spend <1% of the time. A large drop would not be surprising, but this sustained rally is reflecting the AI growth and could be setting google on a new, bullish path. Price is well above fv, not something I would be buying at this time
👉Fair value is ~$260
Safe trading

GOOGL: price at important resistance zonePrice has been following the outlined structure from the July and August updates, showing the expected relative outperformance versus SPX. However, instead of forming a prolonged Autumn consolidation, price moved almost directly to the target resistance zone for the uptrend since the April bottom: 250–270.
While one more short-term push toward the top of the resistance zone is possible, as long as price remains below 270, I am watching for rising selling pressure and a potential durable consolidation to develop in the coming weeks. If price manages to post a sustained breakout above 270, the current structural view would need to be reassessed.
Caution is advised with any new long exposure at these levels, and consider protecting open long positions in case of a reversal or broader market weakness.
Chart:
Previously:
• On resistance and potential consolidation (Aug 29):
Chart:
Link: www.tradingview.com
• On local support (Aug 11):
Chart:
Link: www.tradingview.com
• On upside potential & relative strength vs SPX (Aug 5):
Link: www.tradingview.com
• On breakout setup (Jul 13):
Chart:
Link: www.tradingview.com
GOOGL Alphabet Options Ahead of EarningsIf you haven`t bought GOOGL before the rally:
Now analyzing the options chain and the chart patterns of GOOGL Alphabet prior to the earnings report this week,
I would consider purchasing the 305usd strike price Calls with
an expiration date of 2026-1-16,
for a premium of approximately $8.30.
If these options prove to be profitable prior to the earnings release, I would sell at least half of them.

Is $GOOG breaking out to new highs?NASDAQ:GOOG is one of the best looking charts right now.
This week, price action pushed to new highs and retested resistance as support. If price keeps pushing higher, then I can see a potential move all the way up to the top target.
The move would need to happen quickly if it were to play out. Similar to the move in SNDK, AMD, ORCL, etc. A one day move of 20-40%.
I've bought some calls just incase this plays out as there is a ton of bullish flow.
Let's see what happens over the coming weeks.

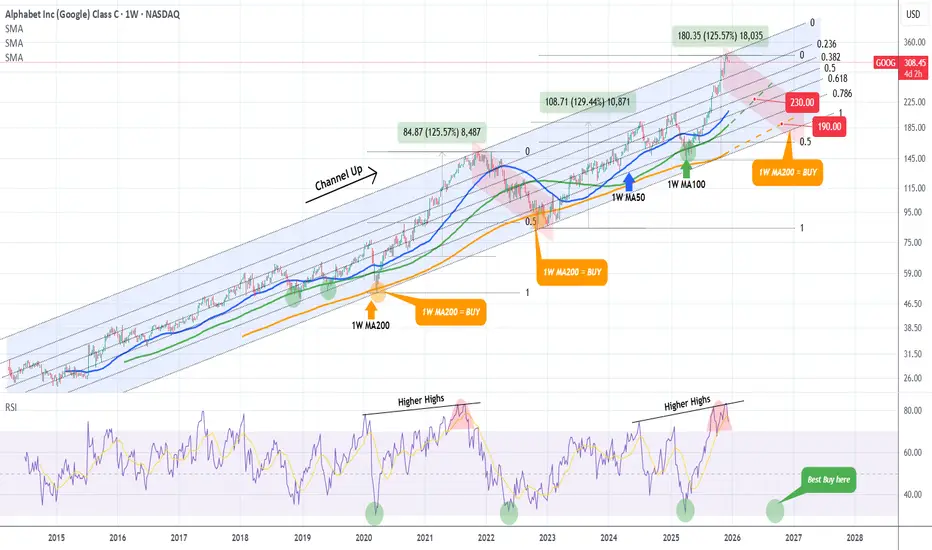
GOOGLE Is this the market Top??Google (GOOG) is now looking almost exactly like the November 2021 Top of the previous Bull Cycle. That was the one that made the first Higher High on its historic 12-year Channel Up.
The distinct signal is a double Higher Highs hit (November 24 2025 and today) similar to Aug - Nov 2021. This is a legitimate technical reason to expect that the 2023 - 2025 Bull Cycle has topped. The 1W RSI has even printed the same kind of peak formation it did in August 2021, completing an impressive rally from its oversold bottom at 32.00 (green circle), similar to the oversold bottom of the COVID flash-crash in March 2020.
So if this the start of a new Bear Cycle in 2026, same as the one in 2022, how low can the stock go before it bottoms and becomes a buy opportunity again?
We will answer that by going back to the multi-year Channel Up, where you can see that the 1W MA200 (orange trend-line) has acted as the ultimate Support, thus best buy entry, during the last three major market corrections: the March 2020 COVID crash, the October 2022 Inflation Crisis bottom and the April 2025 (almost) Tariff War. Before that, it was the 1W MA100 (green trend-line) that gave two excellent buy opportunities back-to-back.
As a result, even though the 2022 Bearish Leg correction bottomed on the 0.5 Fibonacci retracement level, this time we will 'limit' the new Bear Cycle to those MA trend-lines, the MA100 and MA200. If the price is contained on the MA100, its current trajectory shows a potential 'fair' contact around $235. If the market fails to rebound there, we expect a Q4 2026 bottom on the 1W MA200 around $195.
Regardless of that, we will also be looking at the 1W RSI. As we already mentioned, since the 2020 COVID crash, and those 3 in total major corrections that the Alphabet stock had, when the RSI hit the 32.00 level, it presented an objective buy opportunity, even though in 2022 it dipped even lower. As a result, if the 1W RSI hits 32.00 again before reaching any of the above Targets, we will be placing a buy regardless.
---
** Please LIKE 👍, FOLLOW ✅, SHARE 🙌 and COMMENT ✍ if you enjoy this idea! Also share your ideas and charts in the comments section below! This is best way to keep it relevant, support us, keep the content here free and allow the idea to reach as many people as possible. **
---
💸💸💸💸💸💸
👇 👇 👇 👇 👇 👇

Alphabet - This stock is reversing now!🔪Alphabet ( NASDAQ:GOOG ) is reversing very soon:
🔎Analysis summary:
Alphabet created a textbook all time high break and retest back in mid 2025. The recent rally has therefore been totally expected. But now, Alphabet is totally overextended, retesting a major resistance trendline and about to also create bearish confirmation.
📝Levels to watch:
$300
SwingTraderPhil
SwingTrading.Simplified. | Investing.Simplified. | #LONGTERMVISION

ALPHABET (GOOGL): The Gemini 3 Shock & The Blue Sky Breakout🧠 1. Fundamental Thesis: The "FrontierMath" Leak
We aren't just betting on a stock; we are betting on a technological leap.
The Insider Call: A notable insider on Polymarket (with a 100% track record on Google trends) is betting on a FrontierMath score of 70%+ for Gemini 3 by January 31, 2026.
The Context: Current top-tier models (including the Gemini 3 Preview) sit around 38%. A jump to 70% would represent a "mini-singularity," catapulting Google years ahead of OpenAI’s GPT-5.
The Date: Watch January 14/15. Google is intentionally shutting down older preview APIs—a classic signal that the final "General Availability" (GA) launch with the full post-training upgrade is imminent.
📊 2. Technical Analysis: The Lid is Off!
The chart confirms a textbook Bullish Continuation.
Blue Sky Breakout: Alphabet has exited its massive bull flag and sustained a breakout above the previous all-time high of ~$320.
The "Perfect Retest": Recent dips to ~$322 were immediately bought up, validating that former resistance has flipped into major support.
Indicators (Daily):
SQZMOM: Shifting to bright green, indicating accelerating bullish momentum.
WaveTrend (WT): Confirmed bullish crossover on the daily, while the weekly chart still shows significant runway.
ADX: Trending above 40, signaling an exceptionally strong trend.
Technical Target: The measured move of the current formation points to $350 - $360.
🔥 Bottom Line
Alphabet is currently the most undervalued AI story in Big Tech. The combination of the Apple Partnership (Gemini powering Apple Intelligence) and the upcoming Gemini 3 Upgrade creates an asymmetric risk-reward profile.
Trigger Watch: Jan 14/15 (API Switch) & Jan 31 (FrontierMath Deadline).

GOOG / GOOGLE / ALPHABETGOOG - following a cycle of 47 months. It bottoms out or tops out in the zone highlighted. Since the breakout in September 2025; seems headed for 381/416. Would make sense to book out any investments if it reaches there and wait for levels of 250 or lower.

GOOGL (daytrading)-D1 (Daily chart):
The price is moving inside a channel (read comment)
It touched the support line (the bottom line).
-H1 (1-hour chart):
Price is moving sideways (no clear up or down).
Expect going up
-R:R = 1:2 (Risk : Reward)
You risk $1 to try to make $2.
👉 This is good risk management

GOOG is trading at overhead resistance but chart is constructiveGOOG is pressing into overhead resistance near $325. The EMAs have turned bullish, with the shorter green EMA now above the longer orange EMA, and the RSI holding above 50. If momentum stays intact and the EMAs begin to widen with positive slope, the probability of a breakout above the resistance zone increases.
Noteworthy, Cantor Fitzgerald has turned bullish on Alphabet, arguing its AI edge will support further gains. The broker upgraded the shares to overweight with a higher $370 target, noting Gemini and Google’s wider AI stack remain under-appreciated. With regulatory pressure easing and revenue momentum building in search and cloud, Cantor thinks Alphabet’s competitive position is strengthening despite last year’s strong rally.

GOOGLE WHERE THE MONEY IS### 🚨 GOOG Technical Analysis: Is Google Ready to Blast Off in 2026? 🚀
Hey traders! As of **January 4, 2026**, Alphabet (GOOG) sits at **$315.32** (up ~0.48% recently), fresh off a monster **65% rally in 2025** – its best year since 2009. Your TradingView chart nailed the long-term uptrend perfectly: from 2022 lows around $80-100, through a sharp 2025 dip, to new highs near $328. That green ascending trendline is pure gold, projecting toward **$400+** by 2027 if bulls stay in control.
THAT MEANS, IF YOU POSITION WELL, ARE PATIENT, FOLLOW TRENDS AND INDICATORS, and time it correctly (Which is difficult, meaning watch the numbers and indicators to time the move), you can ride the down wave, into the up wave long. AND MANY TRADES ALONG THE WAY!! This means there is a LOT of money for well placed trades.
But is this the calm before another moonshot... or a sneaky top? Let's break it down **clearly and step-by-step** – no fluff, just actionable insights to hook you in and keep you reading.
#### 1. **Current Price Snapshot** (As of Jan 4, 2026)
- **Price**: $315.32
- **Recent Range**: High ~$328 (Nov 2025), Low ~$310
- **52-Week Range**: ~$143 to $329
- **Market Mood**: Neutral sentiment, but AI hype is strong after 2025's blowout performance.
#### 2. **The Big Trend: Bullish Ascent Intact**
- **Primary Trend**: Strong uptrend since 2022 bear market bottom.
- **Key Driver**: That green ascending support line (from ~$83 in 2022) has held every major dip, including the 2025 pullback to ~$156-210.
- **Current Status**: Price hugging resistance at ~$315-322. Break above = acceleration; hold = consolidation.
- **Projection Match**: Your chart's line points to ~$380-400 by mid-2027 – aligns with optimistic analyst views if AI (Gemini, Cloud) delivers.
#### 3. **Critical Support & Resistance Levels** (Watch These Like a Hawk)
- **Immediate Resistance**: $322 (recent high) → $328-329 (all-time high)
- **Key Resistance**: $340-350 (next upside targets on breakout)
- **Immediate Support**: $310 → Green trendline (~$300 near-term)
- **Major Supports**: $262 (38.2% Fib), $220-240 (prior consolidation), $181 (deeper retrace)
- **Breakdown Risk**: Below $290-300 trendline = potential drop to $262 or lower (bear warning!).
#### 4. **Chart Patterns & Signals**
- **Overall Structure**: Series of higher highs/lows with bullish flags and V-bottom reversals (e.g., 2025 dip).
- **Recent Action**: Zigzag consolidation near highs – possible ascending triangle forming.
- **Earnings Markers**: Mostly green "E" beats in 2025 fueled rallies; watch Feb 3, 2026 report for the next catalyst.
- **Volume Note**: Low volume on recent moves – needs spike for conviction breakout.
#### 5. **Bull Case: Why GOOG Could YOLO to $400+**
- AI dominance (Gemini, Cloud growth >30%)
- Strong fundamentals: Search engagement up, massive Cloud backlog
- Analyst Consensus: Median target ~$330-340 (up 5-8% from here), some as high as $385-400
- Momentum: Best Mag7 performer in 2025 – carryover potential huge
#### 6. **Bear Case: Risks That Could Trigger a Crash Scenario**
- Heavy 2026 capex (~$114B on AI/data centers) pressuring margins
- Antitrust heat & competition (e.g., OpenAI, Bing threats)
- Valuation: ~30x forward P/E – rich if growth slows
- Technical Risk: Failure at $329 high = double-top, potential pullback to $280-300
#### 7. **Quick Trade Ideas**
- **Bullish Play**: Buy dip to green trendline (~$300-310), target $340-350. Stop below $290.
- **Bearish Play**: Short on failed breakout above $329, target $262.
- **Safe Play**: Wait for volume breakout – add alerts on TradingView!
This chart screams **uptrend with upside bias**, but respect the resistance – 2026 could be epic if AI pays off, or choppy if capex bites. What's your take: Moon or correction? Drop your thoughts or another chart – let's discuss! 📈🔥
Ghost feed may not be accurate, please only use as a projected guideline.
*(Not financial advice – DYOR, markets can moon or crater anytime.)*

GOOGL: Triangle Breakout, Set-Up Confirmation, Target Zone.Hello There,
welcome to my new analysis about GOOGL. Recently I spotted an important pattern and setup. As the new year started, new patterns within the prices are unfolding. Therefore, it is interesting to watch which titles in the market are likely to yield appropriate returns and complete crucial trading setups. Looking at the 2-hour timeframe, the key setup of GOOGL caught my attention.
When looking at my chart, there is this major triangle formation that offers a substantial price range in which GOOGL is building up the whole time. Within this zone, the price action found several supports. One of them being the lower boundary of the massive triangle formation. Another being the uptrend line. Within these zones, GOOGL already bounced several times.
What are also important indicators are the 50-EMA and the 20-EMA. As marked in blue and green in my chart, these EMAs are substantial supports off which GOOGL has already bounced several times. Above these main supports, GOOGL is now continuing to form a crucial next formation. This formation is actually a bull-flag formation completing above the upper boundary of the zones.
Also, the volume profile seen on the right of my chart, measuring volume by price, offers a fundamental support. With the price action bouncing further from these levels, a continuation of the local trend is likely. Especially when the bull flag confirms the next, this will offer a central setup on the long side as it is marked. A breakout above the upper boundary of the bull flag will determine a conservative entry.
With this being said, it is great to consider the important trades upcoming.
We will watch out for the main market evolutions.
Thank you very much for watching!

GOOGL – Trendline Break, Pullback & Key Levels to WatchGOOGL maintains a bullish structure on the Daily timeframe — however, lower-timeframe price action has shifted into a more sensitive zone.
On the 4H chart, the ascending trendline has now broken, and price is actively pulling back to retest that structure.
The current area to observe is the $317 – $327 supply zone, where sell orders were previously triggered.
What stands out during this pullback is the decline in trading volume, suggesting buyers are losing momentum while price retraces.
As long as this zone is not engulfed (ENG), the expectation remains toward a corrective push — first into the $300 pocket.
If momentum accelerates during the correction, price may extend toward the second green zone marked on the chart, where a fresh decision awaits.
GOOGL is now positioned in a phase where patience and timing can make a meaningful difference.
For traders who follow structure and order-flow, the coming moves could define the next opportunity window.
📌 Regular updates will follow as the chart develops — staying connected ensures you won’t miss the next key shift.
`P NASDAQ:GOOGL NASDAQ:GOOGL ouryaabdi

Alphabet - The exceptional short setup!🔒Alphabet ( NASDAQ:GOOG ) is reversing right now:
🔎Analysis summary:
Alphabet is clearly indicating a major bearish move. With the current retest of major resistance, Alphabet is slowly reversing. Since Alphabet is also massively overextended, really everything is pointing towards a move lower. Just give it a couple of days to reverse.
📝Levels to watch:
$300
SwingTraderPhil
SwingTrading.Simplified. | Investing.Simplified. | #LONGTERMVISION

GOOGLE; Will we see continuation?📈 Hey Traders!
Here’s a fresh outlook from my trading desk. If you’ve been following me for a while, you already know my approach:
🧩 I trade Supply & Demand zones using Heikin Ashi chart on the 4H timeframe.
🧠 I keep it mechanical and clean — no messy charts, no guessing games.
❌ No trendlines, no fixed sessions, no patterns, no indicator overload.
❌ No overanalyzing the market; use only two time frames.
❌ No scalping, and no need to be glued to the screen.
✅ I trade exclusively with limit orders, so it’s more of a set-and-forget style.
✅ This means more freedom, less screen time, and a focus on quality setups.
✅ Just a simplified, structured plan and a calm mindset.
💬 Let’s Talk:
💡Do you trade supply & demand too ?
💡What’s your go-to timeframe ?
💡Ever tried Heikin Ashi ?
📩 Got questions about my strategy or setup? Drop them below — ask me anything, I’m here to share.
Let’s grow together and keep it simple. 👊

GOOG - From Erections Come CorrectionsAnytime you get an erection, move like this on a chart, rest assured, a correction is right around the corner.
Buffet's purchase of 1% of his cash holdings does not justify hundreds of billions in market capitalization gains.
GOOG has now exploded 53% since Sept. if you were long. GREAT! Take your profits and run! If you are chasing, you will ultimately get burned.
Remember, no matter where the price goes, you are always 100% from ZERO!
I will be the first to tell you that the most & easiest profits are always made at the tops of markets. When everyone and their grandmother is bullish! Therein is the problem! TOP!
GTFO and STFO!
THANK YOU for getting me to 5,000 followers! 🙏🔥
Let’s keep climbing.
If you enjoy the work:
👉 Boost
👉 Follow
👉 Drop a solid comment
Let’s push it to 6,000 and keep building a community grounded in truth, not hype.

GOOGL LONG SWING TRADEWe are buying calls for GOOGL out 3 weeks at the money for an ABC down entry for continuation higher.

Alphabet - CorrectionThe upward move started in mid-October 2025.
A full five-wave bullish cycle has been completed.
The market is now developing corrective wave A .
Targets:
Intermediate: 292
Primary: 280
---
Please subscribe and leave a comment.
You’ll get new information faster than anyone else.
---

GOOGLE Bear Cycle has started and this is its ultimate blueprintWe made this chart on Google (GOOG) a little more than a month ago, warning of a potential market top on the Higher Highs trend-line of the multi-year Channel Up.
Well 3 weeks ago, the market hit that trend-line and we have a legitimate technical reason to expect that the Bull Cycle has topped. The 1W RSI has even printed the same kind of peak formation it did in September 2021.
We have extended the Channel Up on today's analysis all the way back to Google's IPO and the Fibonacci retracement levels serve absolute justice since the beginning to identify tops and bottoms.
You can see that the 1W MA200 (orange trend-line) has acted as the ultimate Support, thus best buy entry, on the last three major market corrections: the March 2020 COVID crash, the October 2022 Inflation Crisis bottom and the April 2025 (almost) Tariff War.
Before that, it was the 1W MA100 (green trend-line) that gave two excellent buy opportunities back-to-back.
As a result, even though the 2022 Bearish Leg correction bottomed on the 0.5 Fibonacci retracement level, this time we will 'limit' the new Bear Cycle to those MA trend-lines, the MA100 and MA200. If the price is contained on the MA100, its current trajectory shows a potential 'fair' contact around $230. If the market fails to rebound there, we expect a Q3 2026 bottom on the 1W MA200 around $190.
Regardless of that, we will also be looking closing at the 1W RSI. Since the 2020 COVID crash, and those 3 in total major corrections that the Alphabet stock had, when the RSI hit the 32.00 level, it presented an objective buy opportunity, even though in 2022 it dipped even lower.
---
** Please LIKE 👍, FOLLOW ✅, SHARE 🙌 and COMMENT ✍ if you enjoy this idea! Also share your ideas and charts in the comments section below! This is best way to keep it relevant, support us, keep the content here free and allow the idea to reach as many people as possible. **
---
💸💸💸💸💸💸
👇 👇 👇 👇 👇 👇
Google is trading in a high-risk zone.Google (Alphabet) Stock Analysis
As shown on Chart A, Google is trading within a 5-year ascending channel on the weekly timeframe and has now reached the upper boundary of the channel.
On Chart B (daily timeframe), price has broken below its rising channel and has already moved toward the mid-level of the extended channel.
Given the strong bullish momentum in the most recent move, the probability of a sharp sell-off appears limited. However, considering the bearish divergence in the last price leg, along with the presence of a large unfilled gap that price has never revisited, a corrective move can be expected.
Based on these factors, a pullback at least toward the $217 level remains a plausible scenario.
This analysis will be updated accordingly.
Follow me on TradingView for more analyses and live stock trades.
NASDAQ:GOOG

Google: Pause?Over the past two weeks, Google's stock has been taking a breather, moving mostly sideways. Our primary scenario suggests that price will soon gather fresh upward momentum and swing into the red Target Zone between $377.44 and $418.64, where it should complete the overarching upward cycle of the beige wave I. Once this occurs, a new downward impulse is expected to begin, making the red zone suitable for entering short positions; a stop 1% above the upper boundary of the zone can provide protection.

Google - A major correction starts now!🚽Google ( NASDAQ:GOOGL ) is now creating a top:
🔎Analysis summary:
Over the course of the past couple of months, we witnessed a major rally on Google of about +100%. This rally was totally expected, following the underlying bullish rising channel. But with the current retest of the trendline, Google is heading for a major correction.
📝Levels to watch:
$300 and $200
SwingTraderPhil
SwingTrading.Simplified. | Investing.Simplified. | #LONGTERMVISION

November's Tech Shake-Up: Google vs. Nvidia DivergenceNovember marked the widest divergence yet between Google and Nvidia NASDAQ:NVDA . Nvidia’s pullback wasn’t just routine profit-taking—markets started pricing in a strategic shift by hyperscalers potentially moving away from GPU-only AI stacks. This narrative could dilute Nvidia’s moat, while bolstering demand for diversified AI infrastructure players like Google.
📊 GOOGL Setup: Strong Fundamentals, Strategic Support
Google remains fundamentally strong and technically well-supported. With earnings resilience and infrastructure independence, NASDAQ:GOOGL may outperform if tech rotation accelerates. The stock is sitting above a clear demand zone, offering a calculated risk-reward play.
🔔 Trade Idea
Entry Zone: $252 – $256 (support area)
Take Profit 1: $292
Take Profit 2: $327
Stop Loss: $225
📌 This aligns with multi-month support and potential breakout continuation.
