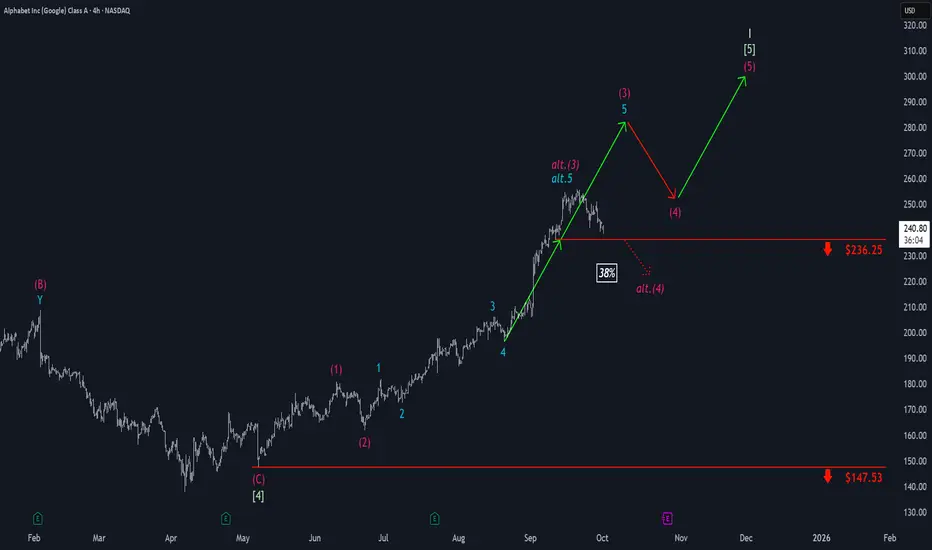
Google: Uptrend StallingFor Google, upward momentum has faded recently, with price edging closer to support at $236.25. If the stock drops below this level, we will need to consider magenta wave alt.(3) as already complete and anticipate an earlier—and lower—wave alt.(4) low (probability: 38%). However, our primary expectation remains for a higher high as the regular wave (3) progresses, with the wave (4) retracement holding above $236.25. With wave (5), waves in green and I in beige should ultimately conclude at new all-time highs.
Googleanalysis
Google Stock Surpasses $250Alphabet’s stock has started the week with a strong bullish bias, posting a gain of more than 4% in the short term. Buying pressure has remained solid as the company surpassed $3 trillion in market capitalization for the first time and delivered strong performance in its cloud services in recent months. Both factors have reinforced investor confidence, suggesting that demand could continue to play a relevant role in the coming sessions.
Aggressive Trend
Although Alphabet had already been sustaining an uptrend for much of the year, since late June the movement has become more aggressive, allowing the price to break above the $250 mark. For now, there are no signs of a trend reversal or bearish corrections that would challenge the main structure, which remains clearly bullish. However, the recent acceleration in price action could open the door to technical pullbacks, typical in scenarios of excessive buying pressure.
Technical Indicators
RSI: The RSI currently sits well above the overbought zone (70), highlighting a market imbalance. The excess of buying momentum could lead to short-term corrections, necessary to restore balance.
TRIX: The TRIX line continues to climb above the neutral 0 level, confirming that the broader picture remains bullish. This reduces the likelihood that eventual pullbacks will result in a trend reversal, reinforcing the dominance of buying pressure.
Key Levels to Watch:
$260 – Psychological Resistance: A round number level and the next objective in the absence of historical references. A sustained breakout above this point could encourage the trend to maintain its aggressive short-term pace.
$226 – Nearby Support: The area of recent lows, serving as the first line of defense against potential short-term corrections.
$204 – Main Support: Level aligned with the Ichimoku cloud. A drop back to this area would put the current bullish structure at risk and could trigger stronger selling pressure on Alphabet’s stock.
Written by Julian Pineda, CFA – Market Analyst

GOOG Bulls Loading Calls ($243.5) – Ride or Fade?
## 🔥🚀 GOOG Weekly Options Alert 🚀🔥
📊 **Cheap Weekly Call Setup – Big Risk / Big Reward!** 💎💰
### ✅ Key Takeaways
* 📈 **Flow & Volume:** Institutional call flow 🔥 (C/P ratio **295:1**) with 1.3x volume → Bullish bias.
* ⚡ **Volatility:** VIX \~17 → Favorable for short-term calls.
* 🛑 **Caution:** Daily RSI 70.6, Weekly RSI 77 → Momentum divergence 📉.
* ⏰ **Risk:** Only 2 days to expiry → Theta & Gamma risk sky high ⚡.
### 🎯 Trade Setup (High-Risk, Small Size)
* 🏦 **Instrument:** GOOG
* 🚀 **Strike:** \$243.00
* 💵 **Entry Price:** \$0.11
* 🛑 **Stop Loss:** \$0.06 (50%)
* 🎯 **Target:** \$0.22 (100% gain)
* 📅 **Exit Plan:** By **Thursday EOD** (don’t hold into Friday gamma risk)
* 📊 **Confidence:** 65%
### ⚠️ Key Risks
* 🕒 Time decay (theta) → Premium melts fast.
* 📉 Momentum exhaustion → RSI overbought, possible pullback.
* 📊 Liquidity → Tight spreads, use limit orders.
---
## 📌 Viral Tags (TradingView + SEO)
\#GOOG #OptionsTrading #WeeklyOptions #CallOptions #SwingTrade #Breakout #StockMarket #GOOGAnalysis #TechStocks #RiskReward #TradingSetup #GammaRisk #ThetaDecay #MomentumTrading

Alphabet Stock Price Soars By Around 8% After Court RulingAlphabet (GOOGL) Stock Price Soars By Around 8% After Court Ruling
At the end of August, we reported that Alphabet (GOOGL) stock price had reached a historic high, closing above $210. But today, the price is likely to climb to a new, significantly higher level. Yesterday, in after-hours trading, it surged by roughly 8%.
Why did Alphabet (GOOGL) shares rise?
The jump is explained by a court ruling in a case concerning alleged monopoly practices related to the Chrome browser. According to Investopedia, a federal judge ruled that the tech giant does not need to sell Chrome. This dispelled fears that Alphabet might have been forced to part with a core part of its business.
Interestingly, one of the factors behind the judge’s decision was the spread of AI solutions (such as ChatGPT and Perplexity), which offer competition to Chrome’s search and browsing functions.
Technical analysis of GOOGL shares
In our earlier review, we identified:
→ an upward channel (shown in blue), formed by long-term price movements;
→ an intermediate channel (in place since late spring).
If today’s trading in GOOGL opens around where the price settled in yesterday’s after-hours session (close to $226), this would mean:
→ the growth target at the upper boundary of the blue channel has been reached;
→ in the context of the summer’s price swings, Alphabet (GOOGL) shares will be in an extremely overbought zone.
Once the initial excitement following the news subsides, this could pave the way for a correction, which seems reasonable after a rise of more than 55% in the past five months.
In this case, the $215 level may serve as an indicative target for the correction to end:
→ it marks the lower boundary of a bullish gap that is highly likely to form today;
→ the market could then return within the aforementioned channels, giving the bulls renewed confidence to buy, as Alphabet (GOOGL) would no longer appear overbought, while the strong fundamental backdrop (as can reasonably be expected) would remain intact.
This article represents the opinion of the Companies operating under the FXOpen brand only. It is not to be construed as an offer, solicitation, or recommendation with respect to products and services provided by the Companies operating under the FXOpen brand, nor is it to be considered financial advice.
Alphabet (GOOGL) Shares Set an All-Time HighAlphabet (GOOGL) Shares Set an All-Time High
As the chart of Alphabet (GOOGL) shares shows, the price in August exceeded the February high. For the first time in history, the close price moved above $210.
The positive market sentiment is being driven by the development of AI technologies, as well as Alphabet’s (GOOGL) ambition to maintain a leading position in this field. Among the latest news, it is worth noting that Meta Platforms (META) has signed an agreement to use Google Cloud’s infrastructure for its AI projects, which is expected to bring Alphabet around $10 billion in revenue.
Technical Analysis of GOOGL Shares
In the long-term context, price fluctuations are forming an ascending channel (shown in blue). After falling to the lower boundary in early April (when Trump first announced his tariffs), the balance of sentiment shifted, and the price has since been moving within a new medium-term ascending channel (shown in purple), approaching the upper boundary of the blue channel.
At the same time, we can make the following observations, which generally point to a bullish market:
→ the price has confidently broken above the median line of the long-term channel;
→ the price has consolidated above the psychological level of $200, which acted as resistance at the start of the year;
→ this summer, the price has been trading near the upper boundary of the medium-term channel, highlighting strong demand – short-term declines towards the median line of the medium-term channel have quickly attracted buyers;
→ in August, the $205.75 level switched its role from resistance to support.
From a bearish perspective, the RSI indicator is showing signs of divergence, suggesting that the rally may be running out of steam. However, it seems that more significant drivers would be needed to shift the current positive sentiment:
→ Technically, Alphabet’s (GOOGL) share price reaching the upper boundary (which looks realistic given the bullish factors listed) could motivate buyers to take profits.
→ Major economic news, such as a change in the Federal Reserve’s interest rate policy.
This article represents the opinion of the Companies operating under the FXOpen brand only. It is not to be construed as an offer, solicitation, or recommendation with respect to products and services provided by the Companies operating under the FXOpen brand, nor is it to be considered financial advice.
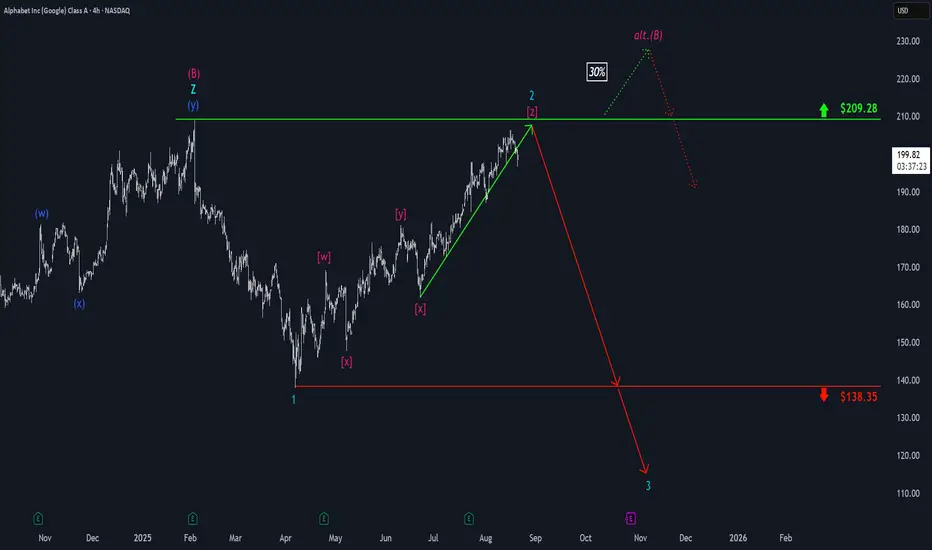
Google: Facing Key Resistance as Uptrend StallsGoogle has faced continued upward pressure, moving closer to the key resistance at $209.28. Turquoise wave 2 should reach its peak below this level – and indeed, recent bearish signals could suggest the top may already be in. Once wave 2 is confirmed complete, we anticipate a sharp sell-off below support at $138.35 in wave 3. However, if bullish momentum persists and price breaks above the $209.28 resistance, we will expect a new corrective high for magenta wave alt.(B) , which would temporarily delay the anticipated decline (probability: 30%).
GOOG 2026 LEAPs: $205 Calls for the Next Big Tech Wave!## 🚀 GOOG LEAP Setup (2025-08-08) 🚀
**Bias:** 📈 **Moderate Bullish** (short-term momentum + low volatility)
**Strategy:** Buy Call LEAP – Target upside with managed risk.
**🎯 Trade Plan**
* **Instrument:** \ NASDAQ:GOOG
* **Type:** CALL (LONG)
* **Strike:** \$205 (0.6-0.7 delta sweet spot)
* **Entry:** \$27.40
* **Profit Target:** \$54.80 (+100%)
* **Stop Loss:** \$18.22 (-30%)
* **Expiry:** 2026-09-18
* **Size:** 1 contract
* **Confidence:** 72%
**📊 Key Notes:**
* RSI (Weekly): 70.1 → strong momentum
* VIX: 15.4 → favorable for LEAP entries
* High valuation (90% of 52-week range) = pullback risk ⚠️
* OI = 0 → possible liquidity challenges

Big Money is Buying GOOGL Calls — Are You In?
## 🚨 GOOGL WEEKLY TRADE IDEA (Aug 4–8)
**Institutional CALL Buying Surges — \$197.50 CALL Setup Triggered**
---
### 📊 Model Consensus Breakdown:
* **🔁 Call/Put Ratio**: **3.33** — strong bullish options bias
* **📉 RSI**: Weak Daily & Weekly = ⚠️ caution zone
* **💰 Volume**: Institutional call flow ✅ but light overall volume ❌
* **🧠 AI Model Split**:
* ✅ **Grok, Gemini**: Bullish lean
* ⚠️ **Claude, DeepSeek**: No trade – weak conviction
* ⚖️ **Meta**: Wait-and-see bias
🧭 **Net Sentiment: MODERATE BULLISH** (With structural caution)
---
### 🎯 Trade Setup:
| 🔧 Strike | 💵 Entry | 🎯 Target | 🛑 Stop | 📅 Expiry | 🔒 Confidence |
| ------------- | -------- | --------- | ------- | --------- | ------------- |
| \$197.50 CALL | \$0.69 | \$1.05+ | \$0.34 | Aug 8 | 65% ✅ |
🕰 **Entry Timing:** Market open
🔍 **Volume Note:** Trade ONLY if opening volume aligns with premarket flow
📉 **Momentum Flag:** Falling RSI = quick exits if invalidated
---
### 🔥 WHY IT MATTERS:
* **Whales Are Loading Calls** despite momentum weakness
* **VIX Low = Options Cheap** = better R\:R on call spreads or singles
* **Target Return**: \~52% upside on premium w/ tight risk guardrails
---
### 🚨 RISKS:
* RSI trend down → invalidates quickly
* Weak market breadth = easy rejection on fakeouts
* Earnings hangover & macro drag = overhang risk
---
### 🏷️ Hashtags / Tags:
`#GOOGL #Alphabet #OptionsTrade #CallOption #AITrading #BullishFlow #TradingView #WeeklySetup #StockSignal #RiskReward`

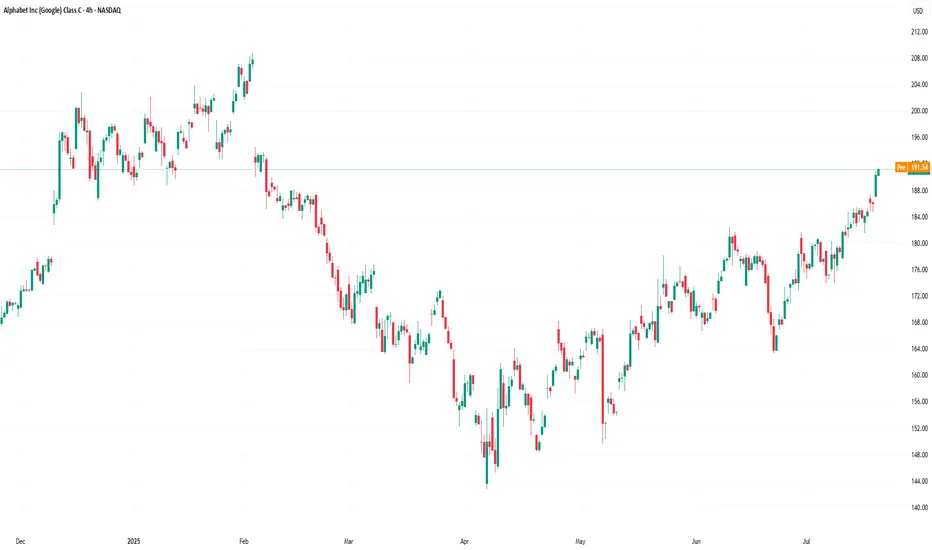
Alphabet (GOOGL) Stock Chart Analysis Following Earnings ReleaseAlphabet (GOOGL) Stock Chart Analysis Following Earnings Release
Earlier this week, we highlighted the prevailing bullish sentiment in the market ahead of Alphabet’s (GOOGL) earnings report, noting that:
→ an ascending channel had formed;
→ the psychological resistance level at $200 was of particular importance.
The earnings release confirmed the market’s optimism, as the company reported better-than-expected profits, driven by strong performance in both its advertising and cloud segments.
In his statement, CEO Sundar Pichai noted that AI is positively impacting all areas of the business, delivering strong momentum.
The company is expected to allocate $75 billion this year to expand its AI capabilities.
As a result, Alphabet (GOOGL) opened yesterday’s trading session with a bullish gap (as indicated by the arrow). However, as the session progressed, the price declined significantly, fully closing the gap.
This suggests that:
→ the bulls failed to consolidate their gains, allowing the bears to seize the initiative;
→ the ascending channel remains valid, with yesterday’s peak testing its upper boundary;
→ such price action near the $200 level reinforces expectations that this psychological mark will continue to act as resistance.
It is possible that the positive sentiment following the earnings report may weaken in the near term. Accordingly, traders may consider a scenario in which Alphabet’s (GOOGL) share price retraces deeper into the existing ascending channel. In this case, the former resistance levels at $180 and $184 may serve as a support zone.
This article represents the opinion of the Companies operating under the FXOpen brand only. It is not to be construed as an offer, solicitation, or recommendation with respect to products and services provided by the Companies operating under the FXOpen brand, nor is it to be considered financial advice.
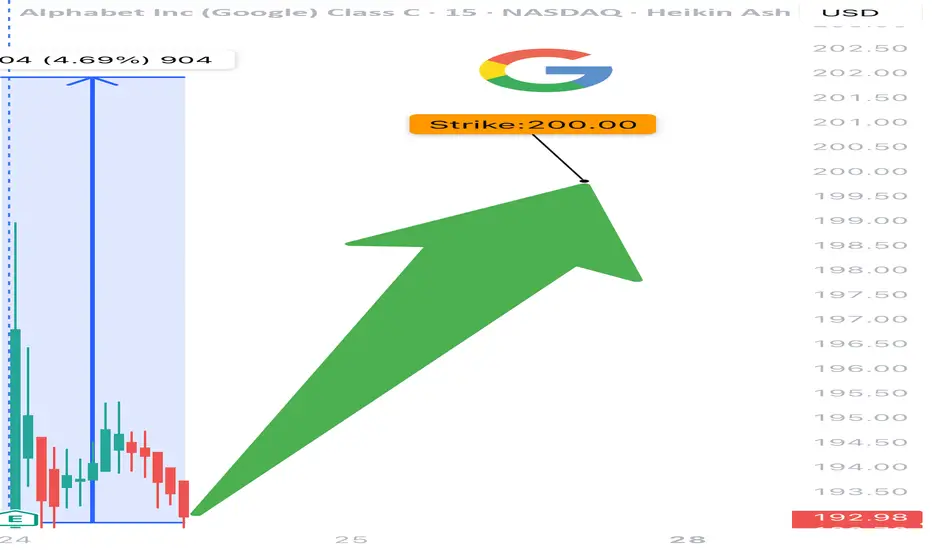
GOOGL TRADE IDEA (07/24)
🚨 GOOGL TRADE IDEA (07/24) 🚨
💥 Big institutional flow. 1 DTE. High gamma = high reward (⚠️ high risk too)
🧠 Quick Breakdown:
• Call/Put Ratio: 2.44 → ultra bullish
• Weekly RSI climbing (67.3) 📈
• Daily RSI falling from 77.5 → 🔻 short-term pullback risk
• Reports split: trade or wait? We’re in.
💥 TRADE SETUP
🟢 Buy GOOGL $200 Call exp 7/25
💰 Entry: $2.09
🎯 Target: $3.14–$4.18 (50–100%)
🛑 Stop: $1.25
📈 Confidence: 70%
⚠️ Expiry in 1 day = tight execution needed. Gamma can cut both ways. Watch it like a hawk. 👀
#GOOGL #OptionsFlow #CallOption #GammaSqueeze #TechStocks #UnusualOptionsActivity #TradingView #StockAlerts #BigMoneyMoves #DayTrading #OptionsTrading
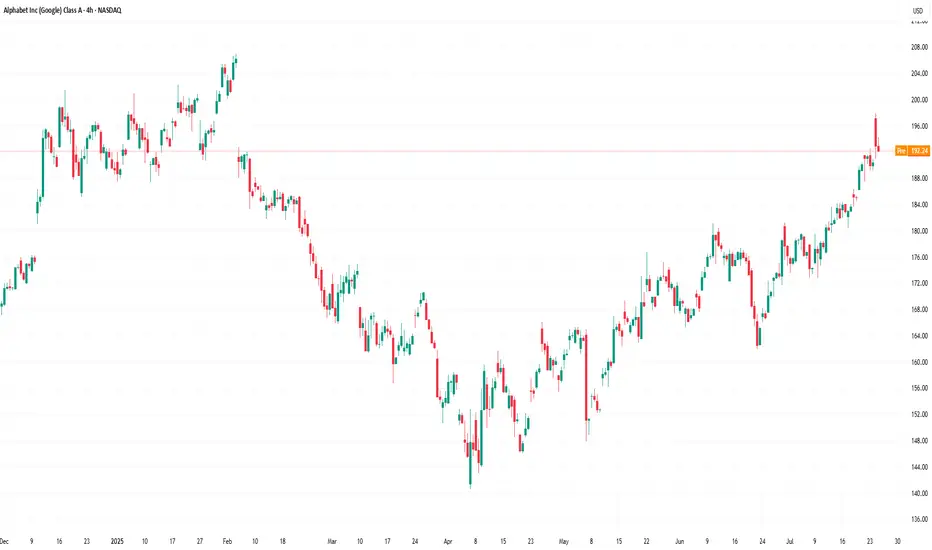
Alphabet (GOOGL) Stock Approaches $200 Ahead of Earnings ReleaseAlphabet (GOOGL) Stock Approaches $200 Ahead of Earnings Release
According to the Alphabet (GOOGL) stock chart, the share price rose by more than 2.5% yesterday. Notably:
→ the price reached its highest level since early February 2025;
→ the stock ranked among the top 10 performers in the S&P 500 by the end of the day.
The positive sentiment is driven by expectations surrounding the upcoming quarterly earnings report, scheduled for release tomorrow, 23 July.
What to Know Ahead of Alphabet’s (GOOGL) Earnings Release
According to media reports, Wall Street analysts forecast Alphabet’s Q2 revenue to grow by approximately 11% year-on-year, with expected earnings per share (EPS) of around $2.17 — up from $1.89 a year earlier. Notably, the company has consistently outperformed estimates for nine consecutive quarters, setting a positive tone ahead of the announcement.
Despite the optimism, investors are closely monitoring two key areas:
→ Cloud computing competition , where Google Cloud contends with Microsoft Azure and Amazon AWS;
→ Growing competition in the search sector , linked to the rise of AI-based platforms such as ChatGPT.
In response, Alphabet is significantly increasing its capital expenditure on AI infrastructure, planning to spend around $75 billion in 2025. These investments are aimed at both defending its core search business and advancing the Gemini AI model, while also strengthening Google Cloud’s market position.
Technical Analysis of Alphabet (GOOGL) Stock
Since April, GOOGL price fluctuations have formed an ascending channel (marked in blue).
From a bullish perspective:
→ the June resistance level at $180 has been breached and may soon act as support;
→ previous bearish reversals (marked with red arrows) failed to gain momentum, suggesting sustained demand is pushing the price higher.
From a bearish standpoint, the price is approaching:
→ the psychological level of $200, which has acted as a major resistance since late 2024;
→ this barrier may be reinforced by a bearish gap formed in early February.
Strong results from the previous quarter, combined with optimistic forward guidance from Alphabet’s management, could provide bulls with the confidence needed to challenge the $200 level.
This article represents the opinion of the Companies operating under the FXOpen brand only. It is not to be construed as an offer, solicitation, or recommendation with respect to products and services provided by the Companies operating under the FXOpen brand, nor is it to be considered financial advice.
GOOGL Raid Plan: Bulls Set to Hijack the Chart!💎🚨**Operation GOOGL Grab: Robbery in Progress! Swing & Run!**🚨💎
🌟Hi! Hola! Ola! Bonjour! Hallo! Marhaba!🌟
Dear Money Makers & Silent Robbers, 🤑💰💸✈️
Get ready for another high-stakes market heist – this time, we’re raiding the vaults of GOOGL (Alphabet Inc.) using the Thief Trading Strategy™. Based on sharp technical intel and subtle fundamental whispers, the setup is clear: the bulls have cracked the code, and it’s time to grab our loot.
🟢 🎯 ENTRY POINT - THE LOOT ZONE
"The vault is wide open!"
Snatch your bullish entry anywhere on the chart, but the pros will place limit buys on recent pullbacks (15m/30m zones), either on swing lows or highs. The pullback is your door in — don’t miss it!
🛑 STOP LOSS - ESCAPE ROUTE
Set the Thief SL at the recent 2H swing low (162.00).
But remember, each robber’s risk appetite is unique — adjust your SL based on your size, cash, and courage.
🎯 TARGET - GETAWAY MONEY
💼 Main Target: 186.50
Or if heat rises early, vanish with your gains before the full score hits. Disappear like a ghost — profit first, questions later!
🧲 FOR SCALPERS – THE QUICK GRAB
Only ride the long wave — shorting is off-limits in this mission.
If your wallet is loaded, dive in. If not, join the swing crew.
Use trailing SL to protect your cash stack 💰.
📈 THE SETUP – WHY THIS RAID WORKS
The GOOGL Market is bursting with bullish energy — a classic Red Zone robbery moment.
Overbought tension, fakeouts, trend shifts — exactly where we love to strike! Consolidation and reversals = opportunity for the brave.
📣 TRADING ALERT - NEWS AHEAD!
🚨 Avoid entries during news releases – they trigger alarms!
Use trailing SL to lock in your stash, especially during high-volatility windows.
🔍 TIPS FROM THE THIEF’S DESK
Stay updated with the latest whispers — from fundamentals to geopolitical noise, COT positioning to sentiment swings. The market changes faster than a thief on the run — so adapt fast!
💖 Show some love: 💥Hit that Boost Button💥
Let’s fuel this robbery plan with more power and precision.
Every day in the market is a new heist — let’s win like thieves, not sheep. 🏆💪🤝❤️🚀
I'll be back soon with another masterplan...
📡 Stay sharp, stay hidden — and always aim for the vault. 🤑🐱👤🎯

Google: Upcoming TopWe locate Google in turquoise wave 2 (of a downward impulse). In more detail, we see the stock developing a complex - - - pattern and expect turquoise wave 2 to conclude imminently with wave . All the while, the price should maintain a safe distance from resistance at $209.28. Looking ahead to turquoise wave 3, we anticipate sell-offs down into our magenta Target Zone between $123.92 and $98, before wave 4 likely triggers a temporary rebound up to the $138.35 level. Ultimately, the entire turquoise downward impulse should bottom out again in the magenta zone, which would also mark the completion of waves (C) in magenta and in green. Since a new larger upward phase should begin afterward, the magenta zone presents an opportunity to establish long positions. However, if Google were to break above the $209.28 resistance next, we would have to expect a new high for magenta wave alt.(B) —which would only temporarily postpone the anticipated sell-off though (probability: 24%).
📈 Over 190 precise analyses, clear entry points, and defined Target Zones - that's what we do.

GOOGL Dips: Buy Opportunity Looms at $173.5FenzoFx—#GOOGL broke below the previous day's low at $175.68, aiming toward the $173.53 support.
This zone is backed by the anchored VWAP, which can provide a discount price to join the bull market.

Google (Alphabet): Overarching Downside PotentialAlphabet (GOOGL) hasn’t been able to reclaim its May 22 high and has settled into a consolidation range around the $170 level. Still, under our primary scenario, we expect the current corrective upswing to continue for a bit before turquoise wave 3 resumes the downtrend. That move should break below $138.35 and carry the price into the magenta Target Zone between $123.92 and $98. After that, a rebound within wave 4 is likely, though it probably won’t be strong enough to retake the $138.35 level. A final leg down in wave 5 should then complete the correction, driving the price deeper into the zone and establishing the low of green wave . This area also marks a potential turning point for the next major move upward. Meanwhile, a detour above resistance at $209.28 for a new high of magenta wave alt.(B) is 24% likely.
📈 Over 190 precise analyses, clear entry points, and defined Target Zones - that's what we do.

"GOOGL Technical Play: MA Bounce for Swing Traders!"🚀 GOOGL Stock Heist: The Ultimate AI & Ad-Tech Gold Rush (Swing Trade Plan)
🌟 Market Pirates, Ready to Raid? 🏴☠️💰
🔥 Thief Trading Blueprint for GOOGL (Alphabet Inc.)
🎯 Entry (The Vault is Open!)
Pullback Breakout Strategy:
Buy Zone: Wait for a pullback near the Moving Average "Wall" (e.g., 200-day LSMA, depending on trend alignment).
Confirmation: Enter long if price bounces off the MA with volume support or breaks above a tight consolidation.
Exact Entry: $175.00 (key psychological level + MA confluence). Use buy limits for precision.
Breakout Add-On: If GOOGL clears $180 with momentum, consider adding to the position.
🛑 Stop Loss (Escape Route)
SL: Place below the recent swing low (4H/1D timeframe) or 2-3% below entry (~$170.50 if entering at $175).
Trailing SL: Adjust upward as price climbs to lock profits.
🏆 Target 🎯: $200.00 (The Ad-Tech & AI Jackpot!)
Why $200?
Cantor Fitzgerald’s bullish $200 target for NVDA reflects AI-sector optimism—similar tailwinds apply to GOOGL (AI integration in ads, cloud, and Gemini AI growth) 5.
Resistance levels and institutional liquidity zones align with this round-number target.
📈 Why GOOGL?
AI & Cloud Momentum: Google Cloud + Gemini AI adoption mirrors NVDA’s AI hype 15.
Technical Strength: Reclaimed 200-day SMA? Check for higher lows and sector leadership (like NVDA’s recent behavior) 314.
Fundamental Catalyst: Upcoming earnings or AI partnership announcements could fuel FOMO.
⚠️ Risk Management
Avoid news spikes: Earnings/regulatory news = volatility traps.
Scale out: Take partial profits at $190, let runners aim for $200.
💥 Pirate’s Bonus
Like/Boost if this plan helps! More heists incoming (TSLA? AAPL?). Stay tuned!

Alphabet (GOOGL) Shares Drop Over 7% in a Single DayAlphabet (GOOGL) Shares Drop Over 7% in a Single Day
According to the Alphabet (GOOGL) stock chart, yesterday’s main trading session opened around $163.70 but then saw a sharp decline, hitting an intraday low of approximately $148 per share. By the close, bulls managed to recover only a small portion of the losses. As a result, Alphabet (GOOGL) shares fell by more than 7% during the session – marking the worst performance among the S&P 500 constituents (US SPX 500 mini on FXOpen).
Why Did GOOGL Shares Fall?
The drop followed remarks by Eddy Cue, Apple’s Senior Vice President of Internet Software and Services, who:
→ noted a decline in search traffic on Safari;
→ revealed plans to expand Safari’s search capabilities using artificial intelligence.
These developments heightened concerns over Google’s dominance in search and its advertising revenue. According to media reports, analysts are warning of rising competition from AI-powered search platforms such as OpenAI, Grok, and Perplexity.
Technical Analysis of Alphabet (GOOGL) Shares
In our 23 April analysis, we identified a descending price channel and emphasised the psychological significance of the $150 level, which had served as a key support in 2024.
Since then, bulls showed confidence by pushing the price above the red channel. In addition, the chart has begun to outline a potential ascending trend channel (marked in blue).
However, yesterday’s statement from competitors shifts the outlook. The current GOOGL stock price is positioned at the lower boundary of the blue channel – which could act as support, reinforced by the psychological $150 level.
On the other hand, a bearish breakout below this area may revive the downtrend that began in February, potentially paving the way for a test of this year’s lows.
This article represents the opinion of the Companies operating under the FXOpen brand only. It is not to be construed as an offer, solicitation, or recommendation with respect to products and services provided by the Companies operating under the FXOpen brand, nor is it to be considered financial advice.

Alphabet (GOOGL) Shares Hover Near Psychological LevelAlphabet (GOOGL) Shares Hover Near Psychological Level Ahead of Earnings Report
On 31 March, we noted that bearish sentiment could push Alphabet’s (GOOGL) share price towards the psychological level of $150. As the current price chart suggests, GOOGL is now trading close to that very level.
Moreover, the price is approximately equidistant from the recent highs and lows (marked A and B), which may be interpreted as a sign of balanced supply and demand — and a wait-and-see stance from market participants ahead of Alphabet’s Q1 earnings release (scheduled for tomorrow, 24 April).
Awaiting the GOOGL Earnings Report
With the Nasdaq 100 index (US Tech 100 mini on FXOpen) having fallen by around 13.5% since the beginning of the year, investors are approaching tech earnings with caution. According to Barron’s, three key themes are expected to dominate the narrative:
→ management forecasts amid continued uncertainty around the White House’s tariff policy;
→ plans for major capital investment in AI-related infrastructure;
→ signs of softening consumer demand.
Given the current climate of uncertainty, Alphabet’s earnings report could prove particularly influential — serving as a benchmark for shaping market expectations ahead of other major tech company reports.
Technical Analysis of Alphabet (GOOGL)
The $150 level has served as key support throughout 2024, and over the coming days it may act as a springboard for a new price movement, potentially driven by the earnings results.
From a bearish perspective, the market remains in a downward trend (indicated in red) following a breakout below the lower boundary of a previously active rising channel (marked in purple) that had held since last autumn. However, if Alphabet’s management maintains an upbeat outlook for 2025, this could give the bulls the confidence to challenge the upper limit of the red channel.
This article represents the opinion of the Companies operating under the FXOpen brand only. It is not to be construed as an offer, solicitation, or recommendation with respect to products and services provided by the Companies operating under the FXOpen brand, nor is it to be considered financial advice.

GOOGLE I Potential growth within the ascending channelWelcome back! Let me know your thoughts in the comments!
** GOOGLE Analysis - Listen to video!
We recommend that you keep this pair on your watchlist and enter when the entry criteria of your strategy is met.
Please support this idea with a LIKE and COMMENT if you find it useful and Click "Follow" on our profile if you'd like these trade ideas delivered straight to your email in the future.
Thanks for your continued support!Welcome back! Let me know your thoughts in the comments!

Alphabet (GOOGL) Stock Drops 10% – What's Behind the Decline?Alphabet (GOOGL) Stock Drops 10% – What's Behind the Decline?
As the stock chart for Alphabet (GOOGL) shows, on 4 February, the share price reached a historic high above $205. However, despite surpassing analysts’ expectations, GOOGL shares dropped sharply after the earnings report was released:
→ Earnings per share: actual = $2.15, forecast = $2.12
→ Gross revenue: actual = $187.8 billion, forecast = $187.3 billion
As a result, GOOGL's current price is approximately 10% below its all-time high. Market sentiment may have turned negative due to several factors:
→ Cloud revenue fell short of expectations, raising concerns about Alphabet’s ability to compete in the rapidly evolving AI sector.
→ Weaker-than-expected advertising revenue from Google, Alphabet’s core business. While advertising revenue grew by 10.6% to $72.46 billion in Q4 2024, analysts had anticipated a 12% increase.
→ Alphabet announced plans to significantly increase capital expenditures next year to around $75 billion, prompting questions about the impact on depreciation and profitability.
Additionally, news that China has launched an antitrust investigation into Alphabet—potentially in response to tariffs imposed on Chinese goods by the Trump administration—may have weighed on the stock price.
Technical Analysis of Alphabet (GOOGL)
GOOGL remains within an upward trend channel (marked in blue on the chart), with the price having pulled back to key support levels, including:
→ The lower boundary of this trend channel
→ The $180.90 level, marking the top of the bullish gap from 10 December
→ The psychological level of $180, which acted as resistance in late 2024 (indicated by arrows)
This suggests that the downward momentum caused by the earnings report could slow down or even reverse, meaning the current price action may be a pullback within the prevailing uptrend.
Should You Buy GOOGL Stock Now?
According to a report from The Smart Investor via Yahoo, investors should not be overly concerned, as:
→ Alphabet's strong cash flow will allow it to fund its planned $75 billion in capital investments without issue.
→ The company’s leadership stated that demand for its AI-driven products currently exceeds supply.
Meanwhile, analysts surveyed by TipRanks believe Alphabet can overcome its challenges:
→ 27 out of 37 analysts recommend buying GOOGL, with none advising to sell.
→ The 12-month average price target for GOOGL is $215.85.
Overall, while short-term volatility remains, long-term prospects for Alphabet appear solid. Investors with a longer time horizon may see this dip as a buying opportunity.
Trade on TradingView with FXOpen. Consider opening an account and access over 700 markets with tight spreads from 0.0 pips and low commissions from $1.50 per lot.
This article represents the opinion of the Companies operating under the FXOpen brand only. It is not to be construed as an offer, solicitation, or recommendation with respect to products and services provided by the Companies operating under the FXOpen brand, nor is it to be considered financial advice.

Google: Room to Head HigherFor the past two months, GOOGL has been stuck in a sluggish sideways phase, with even its latest breakout attempt quickly sold off. During the magenta wave , we still expect a new high, though a direct transition into the subsequent wave remains technically possible. In our 33% likely alternative scenario, we would have to reckon with a significantly delayed continuation of the overarching upward cycle. In this case, GOOGL would still be working through the (intermediate) correction of the green wave alt. , which would bottom below the support at $147.22.

GOOGLE $GOOG | AD DOLLARS & AI POWER, GOOGLE'S EARNINGS Feb4'25GOOGLE NASDAQ:GOOG | AD DOLLARS & AI POWER, GOOGLE'S EARNINGS ALPHABET'S EARNINGS Feb4'25
Google Zones:
Google BUY/LONG ZONE (GREEN): $199.00 - $215.00
Google DO NOT TRADE/DNT ZONE (WHITE): $193.50 - $199.00
Google SELL/SHORT ZONE (RED): $180.00 - $193.50
Google Trends:
Google Weekly Trend: Bullish
Google Daily Trend: Bullish
Google 4H Trend: Bullish
Google 1H Trend: Bullish
NASDAQ:GOOG earnings are set for Tuesday, Feb 4 (post-market), will the earnings report fuel further upside, or is a pullback on the horizon? All of my timeframes on my indicator show bullish trends. NASDAQ:GOOG has been in a strong uptrend since early December, gaining ~15% since Dec 9. Leading up to earnings, price formed an ascending pattern, breaking out past resistance on Jan 30. My bullish zone projects a ~6% upside, while the bearish zone mirrors this range.
I am linking my previous NASDAQ:GOOG analysis, from nearly a year ago.
This is what I would personally look at before entering trades, everything is subject to change on a daily basis and as I analyze different timeframes and ideas.
ENTERTAINMENT PURPOSES ONLY, NOT FINANCIAL ADVICE!
trendanalysis, trendtrading, priceaction, priceactiontrading, technicalindicators, supportandresistance, rangebreakout, rangebreakdown, rangetrading, chartpatterntrading, chartpatterns, spy, sp500, s&p, fed, federalreserve, fedrate, fedratecut, interestrate, jeromepowell, fedchair, 50bps, volatile, volatility, goog, google, googleearnings, googearnings, googleoptions, googoptions, optionsplay, earningsplay, earningsgamble, googlereport, googlestock, googletrade, googleidea, googlecombo, googlestrangle, googlestraddle, googlevolatility, googleiv, googlesetup, googleanalysis, googanalysis, googleads, googleearningsreport, googleearningsrelease, googleai, gemini, geminiai, googleadsandai, alphabet, alphabetsearnings, alphabetgoogle, alpabetstock,

Google: There We Go!Since late October, the Alphabet stock has been rejected twice at the $181.61 resistance. This Monday, though, it achieved an impulsive rally above this critical level. This advance aligns perfectly with our primary scenario by propelling the magenta wave further upward, and we expect additional gains as this movement progresses. However, the development of the ongoing upward impulse would be significantly delayed in our 33% likely alternative scenario. In this case, Alphabet’s stock would still be working on the corrective green wave alt. and sell off below the support at $147.22.
