Happy New Year!
Hello, traders!
If you "Follow" us, you'll always get the latest information quickly.
Have a great day.
-------------------------------------
(BTCUSDT 12M Chart)
The pattern of a 3-year uptrend and a 1-year downtrend appears to have undergone a slight change, with the 2025 bearish candlestick closing.
The key areas to consider are the 69K-73K range and the 42K-44K range.
Prices below the 42K-44K range are expected to be unseen again.
Therefore, as the price approaches these levels, it's a good time to buy from a long-term perspective.
If the price declines near the Fibonacci level of 1.618 (89050.0), it could touch the 69K-73K range.
However, just as it failed to reach the expected target level of 2.618 (133889.92), the decline could also fall short of the 69K-73K range.
Therefore, if the price declines from 1.618 (89050.0), we need to check for support near 1.414 (79902.66).
Considering the previous pattern of three-year upswings and one-year downswings, 2026 is expected to be a challenging year, so caution is advised when trading.
The Fibonacci ratios currently displayed on the chart are based on the second wave.
Therefore, the Fibonacci level 3.618 (178729.84), which appears to be the end of the second wave, is expected to be the target area for the next bullish trend.
-
(1M chart)
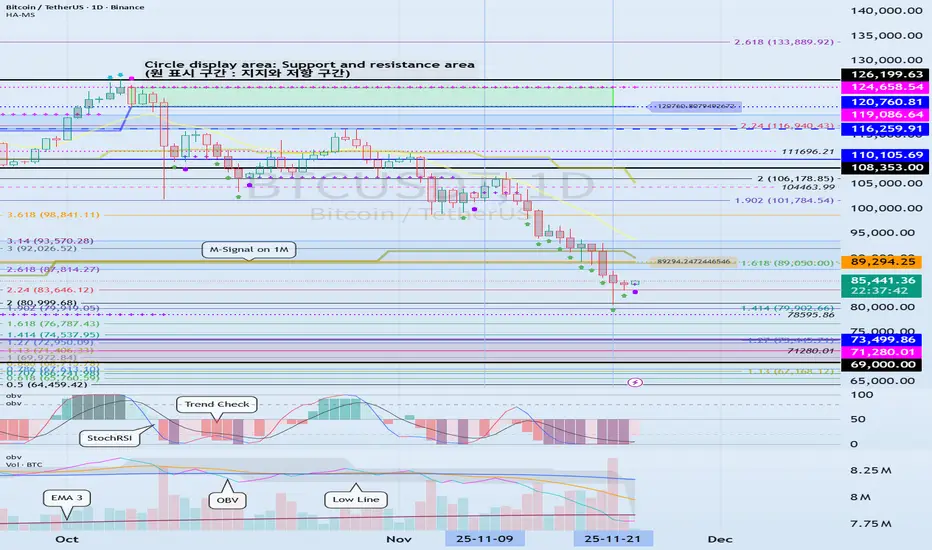
Since the HA-High indicator on the 1M chart formed at 110105.69, a decline is likely until it meets the DOM (-60) or HA-Low indicators.
Currently, the price is positioned near the StochRSI 50 indicator and the M-Signal indicator on the 1M chart, and the StochRSI 20 indicator is showing signs of forming a new line.
Therefore, support near the Fibonacci level 1.618 (89050.0) is crucial.
If the price declines, the DOM (-60) indicator and the HA-Low indicator are expected to form a low soon. Therefore, we need to check for support near the previously mentioned levels:
1st: Fibonacci 1.414 (79902.66),
2nd: 69K ~ 73499.86.
For the price to rise at a key point or range and continue the uptrend, the StochRSI, TC, and OBV indicators must show upward trends.
Currently, the StochRSI indicator is showing signs of entering an oversold zone,
the TC indicator is showing a downward trend below 0,
and the OBV indicator is showing a downward trend between the Low Line and High Line.
-
(1W Chart)
Since this is currently a volatile week, we need to monitor the movements below this week.
The next volatile week is expected to occur around the week of January 26th.
Therefore, the key is whether the price can rise along the uptrend line and remain above the M-Signal indicator on the 1M chart.
If it fails to do so and falls, a downward trend is expected, as mentioned earlier.
My basic trading strategy is to buy in the DOM(-60) ~ HA-Low range and sell in the HA-High ~ DOM(60) range.
Therefore, a decline in the HA-High ~ DOM(60) range can be considered a normal decline, and it is difficult to determine a buy point at this time.
Therefore, I recommend waiting until the DOM(-60) or HA-Low indicators are met.
-
(1D Chart)
The HA-Low indicator on the 1D chart is forming at 87944.84, so the key question is whether it can find support near this level and rise.
However, since the M-Signal indicator on the 1M chart is passing, it's crucial to see if the price can rise above it and maintain its upward momentum.
Including these factors, a rise in the 84739.74 ~ 93.5K range is highly likely to trigger an uptrend.
The next period of volatility is expected to be around January 10th, so we should monitor whether the price rises along the rising trendline (1) after this period.
We should also monitor whether the price can break above the rising trendline (2).
The TC indicator is above zero,
and the OBV indicator is rising above the High Line to see if it can be sustained.
The StochRSI indicator is falling in the overbought zone.
Therefore, I believe that for the uptrend to continue, the StochRSI, TC, and OBV indicators must show upward trends.
If the price finds support in the 84739.74 to 87944.84 range (DOM(-60) to HA-Low range on the 1D chart) and rises, and the StochRSI, TC, and OBV indicators show upward trends, the uptrend is expected to continue.
As mentioned in the 12M chart explanation, this year is expected to be a difficult year. Therefore, when trading spot, it's important to increase the number of coins (tokens) corresponding to profits. When trading futures, it's important to minimize losses by trading short positions. This will prevent you from missing opportunities due to insufficient funds when the trend turns upward.
It's best to increase the number of coins (tokens) representing profit during a stepwise downtrend.
This is because a stepwise downtrend usually ends in an uptrend.
A stepwise downtrend occurs when the price falls between DOM (-60) and HA-Low.
However, because it's difficult to predict the end of a downtrend, you must carefully distribute your purchase amounts.
Furthermore, when profit is generated by each purchase price, you should sell the amount equal to the purchase price, leaving the coins (tokens) representing profit.
This will quickly convert to profit when the price rises.
-
Thank you for reading to the end.
We wish you successful trading.
--------------------------------------------------
HA

How to interpret charts and trade...
Hello, fellow traders!
If you "Follow" me, you'll always get the latest information quickly.
Have a great day.
-------------------------------------
The Trend Check (TC) indicator is a comprehensive evaluation of the PVT, OBV, and StochRSI indicators.
Therefore, a breakout above the zero level indicates strong buying pressure and a high probability of a price increase.
The StochRSI indicator is a coincident indicator that can be used as a trading signal by quickly detecting overbought and oversold levels in a stock price.
The OBV indicator is a volume indicator that measures buying and selling pressure by adding the trading volume on days when the price is rising and subtracting the trading volume on days when the price is falling. It was developed based on the assumption that trading volume precedes the price.
The PVT indicator is a technical analysis tool that analyzes buying and selling pressure and trends in the market by reflecting both stock price movements and trading volume. It combines accumulated trading volume with price volatility to sensitively reflect market supply and demand and trends.
By comprehensively evaluating these indicators, it can be used to determine trading timing.
However, since the trend may fluctuate depending on whether the StochRSI indicator is in the overbought or oversold zone, the StochRSI indicator has been displayed accordingly.
If the StochRSI indicator enters the overbought zone, upside is likely to be constrained, and if it enters the oversold zone, downside is likely to be constrained.
Therefore, it is recommended to check the StochRSI indicator's fluctuations along with the TC indicator.
If the On-Bottom Volume (OBV) indicator is between the Low Line and High Line, the price is likely to move sideways.
Furthermore, if it rises above the High Line, it is likely to be bullish, and if it falls below the Low Line, it is likely to be bearish.
To confirm this, the On-Bottom Volume (OBV) indicator has been added separately.
In summary, if the TC indicator shows an upward trend or remains above 0, the price is likely to rise.
However, the movements of the StochRSI and OBV indicators are checked to determine whether the upward trend can be maintained or whether a downtrend will occur.
Therefore, for the price to continue its upward trend,
1. the TC indicator must show an upward trend above 0,
2. the StochRSI indicator must show an upward trend without entering an overbought zone, and
3. the OBV indicator must remain above its High Line or show an upward trend.
For the price to continue its downward trend, this is the opposite of the above conditions for a sustained upward trend.
If the StochRSI or OBV indicators show a different trend than the TC indicator, the price is likely to move sideways, so be mindful of this when trading.
-
Since most indicators are based on 1D charts, it's important to first check the movements of the 1D chart.
Next, it's best to trade by reflecting the movements of the 1D chart with the movements of the timeframe chart you're trading.
In other words, if the 1D chart shows an upward trend, you should trade based on the expectation that the price will rise on the timeframe chart you're trading.
Therefore, when prices are falling, it's best to trade with a smaller investment amount and a shorter investment period to react quickly (with a short stop-loss point). When prices are rising, it's best to trade with a larger investment amount and a longer investment period (with a more generous stop-loss point).
-
Auxiliary indicators should be considered as supplementary indicators, as their name suggests, in interpreting charts.
The key is to identify support and resistance points or ranges for the price and the movements of the M-Signal indicator on the 1M, 1W, and 1D charts.
To determine the overall chart movement, check the movements of the M-Signal indicator on the 1M, 1W, and 1D charts.
For the price to continue its upward trend, it must remain above the M-Signal indicator on the 1M chart.
If it fails to do so, a downward trend is highly likely, so you should consider a strategy to counter a bearish market.
If the price is below the M-Signal indicator on the 1M chart, it is recommended to shorten the investment period.
Consequently, it is also recommended to set a shorter stop-loss point.
For this purpose, the HA-MS indicator includes indicators designed to indicate support and resistance points.
The most representative indicators are the HA-Low and HA-High indicators.
The HA-Low and HA-High indicators are designed for trading using the Heikin-Ashi chart.
The HA-Low indicator indicates the low range, so if it encounters support, it's a buy signal.
The HA-High indicator indicates the high range, so if it encounters resistance, it's a sell signal.
To make this more clear, the DOM(60) and DOM(-60) indicators have been added.
The DOM(-60) indicator, like the HA-Low indicator, indicates the low range.
The DOM(60) indicator, like the HA-High indicator, indicates the high range.
Therefore, if support is found within the established DOM(-60) ~ HA-Low or HA-Low ~ DOM(-60) range, it's a buy signal.
If resistance is found within the established HA-High ~ DOM(60) or DOM(60) ~ HA-High range, it's a sell signal.
-
When assessing support at these points or intervals, adding the interpretation of the auxiliary indicators mentioned above will be a significant aid in determining support.
In other words, if price movements indicate support, but the auxiliary indicators do not support it, the price is likely to decline.
-
If you trade based on indicator movements, you may suddenly find yourself trading against them.
This happens because you prejudge the indicators' movements based on your own thinking and then trade accordingly.
To prevent this problem, it's important to ensure that all auxiliary indicators are moving in the same direction.
Also, while you can buy to some extent in spot trading, you should never initiate a trade based on price movements when trading short positions in futures.
This is because price volatility is higher when prices are falling.
Therefore, when starting a short position, it's best to initiate the trade at support and resistance levels.
-
We begin trading based on indicator movements or chart analysis, but we lose something.
That's our trading strategy.
When actually trading, we must first determine:
1. How long will the trading period be?
2. How much capital will we invest?
3. How will we conduct the trade?
If we simply analyze the indicator movements and charts without deciding on these factors, we are likely to trade in a state of constant anxiety.
This is because maintaining a stable mental state is more important than profit when trading.
A stable mental state during a trade increases the likelihood of a successful trade.
This is because it allows us to respond more effectively.
Therefore, establishing a basic trading strategy that suits your investment style is paramount.
By considering the investment period for the stock or coin you're considering, you can determine your investment amount accordingly and choose a detailed trading method.
Therefore,
1. Investment Period
2. Investment Size
3. Trading Method
When conducting a trade, consider the three factors above.
When investing for a medium- to long-term or longer, it's important to carefully manage your purchases to lower your purchase price.
If your average purchase price is high, it can be psychologically burdensome to trade with a medium- to long-term investment horizon.
Therefore, in this case, you should trade for shorter periods of time, generating cash profits while lowering your average purchase price.
Lowering your average purchase price isn't easy in the stock market.
This is because trading is done on a weekly basis.
However, the coin market allows for decimal trading, so you can lower your average purchase price by increasing the number of coins corresponding to your profit.
For coins corresponding to profit, you trade by purchase price. When profits are generated for each purchase price, you sell the amount equivalent to the purchase price (including transaction fees) for each purchase price, thereby retaining the remaining coins.
Since the purchase price of these remaining coins is 0, as the number of these coins increases, the average purchase price will decrease.
-
Investment size is crucial, as it determines how you allocate your total investment capital to conduct your trading.
If your investment is misallocated, even with high returns, actual profits may be small, and even with low loss rates, actual losses may be large.
Furthermore, the most important aspect of investment size is always maintaining a reserve fund.
The amount of reserve fund you should keep will vary depending on your individual investment style.
I recommend approximately 20% of your total investment capital.
This reserve fund is used for emergencies. If you start trading with this reserve fund, you must sell it quickly to secure the reserve fund.
Failure to do so can lead to extreme anxiety and the inadvertent execution of unintended trades.
Depending on your investment size, you should consider how many stocks (coins) you will trade at a time.
Investing in too many stocks (coins) can lead to a small purchase amount or simultaneous trading, which can hinder your ability to execute your trades effectively.
Therefore, you should always consider the number of stocks (coins) you can manage simultaneously.
Typically, the number of stocks (coins) you can manage simultaneously is 1-3.
Long-term investments, even if managed concurrently, often require time to respond, so they don't need to be included in the number of concurrent investments.
However, it's recommended to include mid-term and shorter investments in your concurrent management count.
-
Once you've chosen a stock (coin) based on your investment horizon and investment size, you can then proceed to detailed trading based on chart analysis and indicator movements.
Therefore, it's best to keep chart analysis as short as possible.
This is because prolonged chart analysis increases the likelihood of your subjective opinions incorporating them into your analysis, which can result in inaccurate chart analysis.
Furthermore, prior to chart analysis, if you first review non-chart-related issues (such as company news, politics, or the economy) and then analyze the chart based on those, you may end up basing your analysis on your own subjective opinions. Therefore, it's important to be mindful of this.
It's important to remember that over-information can actually be detrimental to your trading.
-
When developing a detailed trading strategy, I outlined the basic trading strategy of buying in the DOM(-60) ~ HA-Low range and selling in the HA-High ~ DOM(60) range.
By adhering to this principle, even if you don't achieve significant returns, I believe you'll be able to ensure consistent profits.
Looking at the basic trading strategy broadly, it follows a trading pattern within a box range.
However, the length of that box range is unknown.
To achieve significant profits, it is necessary to break beyond the box range.
Therefore, if the price rises within the HA-High ~ DOM(60) range, a stepwise upward trend is likely, transitioning into a trend trade.
Conversely, if the price falls within the DOM(-60) ~ HA-Low range, a stepwise downward trend is likely, transitioning into a trend trade.
However, it's important to note that a stepwise upward trend ends in a decline, while a stepwise downward trend ends in a rise.
In other words, while a stepwise upward trend is likely to lead to a significant upward trend, it also means a significant downward trend.
Therefore, when entering a trade during a stepwise upward trend, it's important to respond quickly to minimize losses.
Failure to do so could result in a significant decline, resulting in losses that are difficult to recover from.
Conversely, a continuous step-down trend is more likely to lead to a significant decline, but it also carries the potential for a significant rise.
Therefore, we must consider how to implement tranche purchases during a step-down trend to lower the average purchase price or secure more stocks (coins).
Therefore, we should execute more trades during a step-down trend.
However, in the stock market, tranche purchases during an actual downtrend can lead to a loss of purchases, so caution is advised.
In the coin market, transactions are processed in decimals, reducing the burden of trading.
This means that trades can be organized by purchase price and executed at each purchase price.
Therefore, in a step-down trend, it's important to execute trades at each purchase price to retain a profit-making number of coins (tokens). This can lower the average purchase price or increase the number of coins (tokens).
There are two ways to retain a profit-making number of coins (tokens): buying and then selling, or selling and then selling.
Any method is fine, but if possible, it's best to trade using a buy-then-sell method.
This is because a cascading downtrend ends in an uptrend.
Therefore, in a cascading downtrend, you should trade less aggressively and execute more trades.
Downtrends are more likely to exhibit volatility than uptrends, so buying and then selling may actually feel easier.
However, you should avoid being greedy.
The root cause of all losses stems from greed.
-
If you can consistently generate profits, regardless of the trading method, then that's the best trading method.
We invest a lot of time and money in finding this, and remain in the investment market.
Charts ultimately represent the movement of money.
Therefore, charts should always be the top priority.
The main problem with the stock market is that issues outside of the charts dominate the market.
This problem prevents investors from seeing the movement of money, and they are constantly being misled by things outside of the charts.
As the coin market is being incorporated into the stock market, I believe that many people are dragging the main problems of the stock market into the coin market, leading to a rise in new losses.
The biggest difference between the stock and coin markets is that coins are relatively unusable in real life.
Therefore, I don't think analyzing them like the stock market is appropriate.
In the stock market, too, capital movements are often reflected in charts, so it's best not to check news outside of the charts first.
Such news can be toxic to individual investors who lack the ability to gather and analyze information.
-
Thank you for reading.
I wish you successful trading.
--------------------------------------------------

Next Volatility Period: Around January 10, 2026
Hello, fellow traders!
Follow us to get the latest updates quickly.
Have a great day!
-------------------------------------
#BTCUSDT
This volatility period will end on December 29th.
The key question is whether the price can maintain support near 87944.84 and rise above the M-Signal indicator on the 1M chart.
Therefore, we should examine whether the price can rise above and find support near 90588.23.
If the price does not fall below the rising trend line (1), an uptrend is expected.
To determine this, we should examine how the price moves after the next period of volatility, around January 10th.
-
Based on the current price position, the rising trend line (1) is a key trend line.
If the price moves along the rising trend line (1), it will rise above the 87944.84 level around January 20th.
Therefore, our focus is on whether the price can find support near 90588.23.
If the M-Signal indicator on the 1W chart breaks above, we believe a sharp rise is highly likely.
-
If the price falls below the uptrend line (1), it should check for support around 79K-81K.
If it fails to find support, it could fall to the crucial 69,000-73,499.86 level.
If it falls below 69,000-73,499.86, it's likely to take a long time to rise.
It could gradually approach the 42K-43K level, a level it will likely never touch again.
However, there's a possibility of an upward turnaround around 56,204.13.
-
The 56K-65K range corresponds to the peak of the first wave, which began a sharp upward trend.
Therefore, even if it declines this time, it is likely to rise around the 56K-65K range.
For a description of the big picture, please refer to the section below.
However, due to price fluctuations, I believe a major bear market is likely to begin in the first quarter of 2026.
It would be interesting to see if this year's candlesticks can close as bullish candles to create a three-year bull market and one-year bear market pattern.
-
Thank you for reading to the end.
I wish you successful trading.
--------------------------------------------------
- This is a description of the big picture.
(3-year bull market, 1-year bear market pattern)
I will explain in more detail when the bear market begins.
------------------------------------------------------

Next Volatility Period: Around December 28th
Hello, traders!
Follow us to get the latest information quickly.
Have a great day.
-------------------------------------
#BTCUSDT
This volatility period will end on December 24th, and the next one will be around January 10th, 2026.
However, it's important to observe the movement after the newly formed trend line passes around December 28th.
The rising trend line (1) is drawn on the 1W chart. The key is whether it can rise along this trend line and break out of the short-term downtrend line.
The low point is 84739.74-87944.84, so a bullish trend is likely to occur if the price finds support near this level and rises above the M-Signal indicator on the 1M chart.
To break above this key point or level and continue the uptrend, the StochRSI, TC, and OBV indicators must show upward trends.
If possible,
1. The StochRSI indicator should not have entered the overbought zone.
2. The TC indicator should remain above zero.
3. The OBV indicator should remain above the High Line.
Therefore, we need to determine if the above conditions can be met while finding support near the low point (84739.74-87944.84).
The most important support and resistance level is 69000-73499.86.
Therefore, volatility may occur as the price approaches this level.
If support is found at this level, I believe it's definitely a good time to buy.
I believe the price level we won't see again is below 42K.
-
Thank you for reading to the end.
I wish you successful trading.
--------------------------------------------------
- This is an explanation of the big picture.
(3-year bull market, 1-year bear market pattern)
I will explain in more detail when the bear market begins.
------------------------------------------------------

See if it can rise above 0.04246-0.04296
Hello, fellow traders!
Follow us to get the latest information quickly.
Have a great day!
-------------------------------------
(1000RATSUSDT.P 1M chart)
The HA-Low indicator formed at 0.02620.
Accordingly, the key question is whether it can find support near 0.02620 and rise.
-
(1W chart)
The key question is whether it can find support above the 0.02620-0.02774 level and rise above 0.06150, signaling an uptrend.
If it falls below the 0.02620-0.02774 level, a step-down trend is likely, so stop trading and observe the situation.
-
(1D chart)
Ultimately, the key question is whether it can break above the 0.02426-0.04296 level and rise above 0.06150.
The support level is 0.01692-0.02774.
If the price breaks above the 0.02426-0.04296 level and rises, a step-like uptrend is likely.
Therefore, the first resistance level is expected to be the 0.06150-0.07811 level.
-
(15m chart)
If you think trading is difficult, it will only feel endlessly difficult, which will lead to significant trading pressure.
Therefore, you should establish a basic trading strategy and execute your trades accordingly to reduce the burden of trading.
The DOM(-60) ~ HA-Low range represents a low point. If it finds support in this area, it is likely to rise. If it finds resistance, it is likely to experience a step-like downtrend.
Conversely, the HA-High ~ DOM(60) range represents a high point. If it finds support in this area, it is likely to experience a step-like uptrend. If it finds resistance, it is likely to experience a downtrend.
Therefore, you should use a split trading strategy.
It's helpful to refer to the movements of auxiliary indicators to determine the direction of movement.
For the price to break above a key point or range and continue the upward trend, the StochRSI, TC, and OBV indicators must show upward trends.
If possible,
1. The StochRSI indicator should not have entered an overbought zone.
2. The TC indicator should remain above zero.
3. The OBV indicator should remain above the High Line.
-
Thank you for reading.
We wish you successful trading.
--------------------------------------------------

Next Volatility Period: Around December 28th
Hello, traders!
Follow us to get the latest information quickly.
Have a great day.
-------------------------------------
#ETHUSDT
With the formation of a new trend line, the next volatility period is expected to occur around December 28th - January 1st.
At this time, the key will be whether the price can find support near the lows of 2828.57-2887.66 and rise above the M-Signal indicator on the 1M chart.
However, the most important support and resistance area is the 2419.83-2706.15 range, so it's crucial to maintain the price above this level.
To turn into an uptrend and establish a bullish trend, it must rise above the 3321.30-3438.16 level.
Therefore, you should develop or adjust your medium- to long-term trading strategy based on the movements of the upcoming volatility period.
If it falls below the 2419.83-2706.15 level, a bear market is likely to begin, so you should consider a response plan.
If it finds support and rises, consider this the final uptrend and focus on finding a time to take profits.
This is because, as mentioned in the explanation of the BTC big picture, 2026 is expected to be a major bear market.
-
Thank you for reading to the end.
I wish you successful trading.
--------------------------------------------------

Selection and Focus
Hello, traders.
By "Following," you'll always receive the latest information quickly.
Have a great day.
-------------------------------------
We are always at a crossroads.
We choose which instruments and coins (tokens) to trade and take responsibility for that choice.
You can see in the chart above that the price has fallen back to near the HA-Low indicator on the 1W chart.
And, the 1D chart shows a stepwise downward trend.
In other words, the price fell below the HA-High indicator, exhibiting a normal decline, and then encountered the HA-Low indicator, forming a stepwise downtrend.
A normal downtrend is formed from a high and then declines, while a stepwise downtrend is formed from a low and then renewed.
While both types of downtrends ultimately represent the same decline, the difference is that in a stepwise downtrend, you can choose the criteria for entering a trade.
Therefore, we can look for charts where a stepwise downtrend transitions to an uptrend and trade based on whether support and resistance are present.
Looking at this example chart, the price fell below the HA-High indicator on August 14th and then exhibited a normal downtrend.
Then, on October 10th, it fell below the HA-Low indicator, forming a stepwise downtrend.
Looking at the larger 1W chart, we can see that the price has been in a normal downtrend since February 3rd, falling below the HA-High indicator.
Then, after October 6th, it touched the HA-Low indicator, indicating that it had reached a low.
It appears to be currently testing support near the HA-Low indicator level of 0.00544.
Therefore, whether support is found near the HA-Low indicator level of 0.00544-0.00611 on the 1W and 1D charts indicates a different meaning from the stepwise decline seen so far.
However, the point at which the downtrend turns into an uptrend and the uptrend is likely to begin is when the price rises above 0.01090 and holds, giving us time to decide on a trade.
Therefore, we can buy when the price rises after finding support in the 0.00544-0.01090 range.
The buy zone, or support zone, is too wide, making it difficult to trade.
In this case, we buy when the price rises after finding support in the key zone, such as the 0.00544-0.00611 range or near 0.01090.
Most traders are afraid to buy at the lowest price, so they will buy when the price rises to around 0.01090.
This phenomenon is called a breakout trade.
In other words, the psychological pressure to buy arises when the price breaks above 0.01090.
Therefore, you should buy when the price rises after finding support in the DOM(-60) ~ HA-Low range, and sell some of the gains, gradually buying during a stepwise downtrend.
By leaving behind coins (tokens) that represent profits, you can reduce the burden of buying at the bottom.
However, if you're not familiar with day trading, you may continue to use your investment funds to buy.
However, don't be afraid of this.
This is because the start of a stepwise downtrend means that the likelihood of a bullish turn has increased.
What you should be afraid of is the HA-High ~ DOM(60) range, i.e., when you buy during the high and then the downtrend begins.
This is because you don't know how far the decline will go.
Only when you encounter the DOM(-60) or HA-Low indicators will you know the end of the decline is near.
Therefore, you need to understand the current position of your chosen asset or coin (token) and consider how to set your trading timing and how to proceed with the trade.
------------------------------------------------------------------
From this perspective, looking at the BTC chart reveals the significance of its current position.
In other words, if the price declines from the current position, it marks the beginning of a stepwise downtrend. If it rises, it indicates the possibility of an upward trend until it encounters the HA-High or DOM(60) indicator.
The M-Signal indicator on the 1M chart passes through this crucial crossroads, making it even more crucial.
The same holds true for the ETH chart.
Therefore, rather than focusing on whether the price will rise or fall, you should check for support near the established low point, i.e., the DOM(-60) to HA-Low range, and respond accordingly by making split purchases.
In other words, trading that leaves behind the coins (tokens) that represent profits from day trading is a useful strategy.
If you're not familiar with day trading, you should purchase at the lowest possible price between DOM(-60) and HA-Low.
Since these purchases should be made every time a cascading downtrend occurs, it's best to purchase in small amounts.
If you find a profitable purchase price within the DOM(-60) to HA-Low range on a certain day, you can sell the amount of each purchase price, leaving the coins (tokens) that represent profits.
It sounds simple, but actually executing a trade is not easy.
Therefore, this trading method (leaving coins corresponding to profits) should be practiced during a cascading downtrend to become familiar with it.
Therefore, until you become accustomed to it, trade with small amounts of capital.
-
Thank you for reading to the end.
I wish you successful trading.
--------------------------------------------------

Examples of How to Determine When to Trade
Hello, fellow traders!
Follow us to get the latest information quickly.
Have a great day!
-------------------------------------
How can you profit from trading with charts that show the above movements?
To trade, you need a basic trading strategy.
This basic trading strategy varies from person to person, so it's important to create a basic trading strategy that suits you.
The basic trading strategy I'm suggesting is to buy in the DOM(-60) ~ HA-Low range and sell in the HA-High ~ DOM(60) range.
However, if the HA-High ~ DOM(60) range rises, a step-up trend is likely, while if the DOM(-60) ~ HA-Low range falls, a step-down trend is likely.
Therefore, you should trade using a segmented trading method.
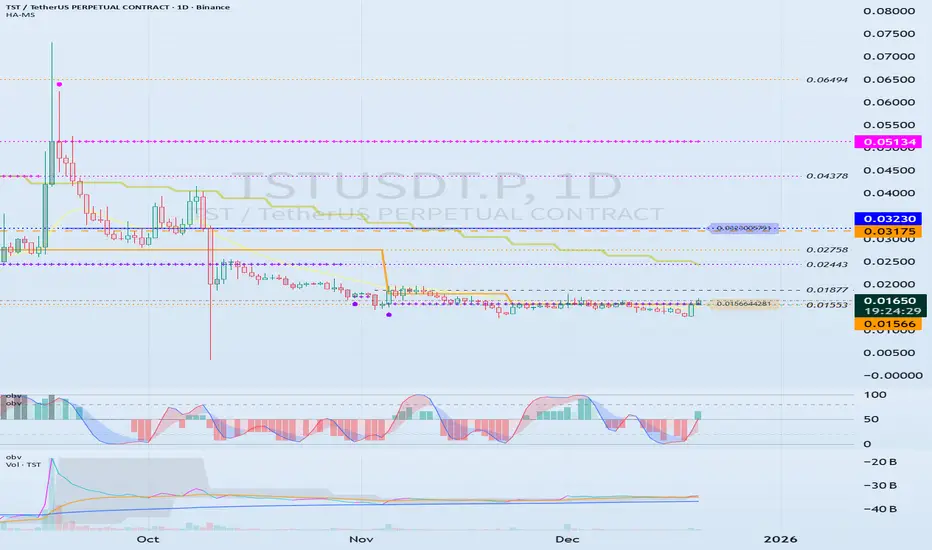
Looking at the chart, you can see that a step-down trend is occurring, and the HA-High indicator has been created for the first time.
Therefore, if the current HA-Low indicator level of 0.01566 is supported and the price rises, the wave will end around 0.03230.
If you zoom in on the chart, you can see that the M-Signal indicator on the 1D chart has risen above the HA-Low indicator and has broken above it.
Therefore, we can see that short-term trading is possible.
The following evidence supports this:
1. The TC indicator has risen above the 0 level.
2. The StochRSI indicator is showing an upward trend.
3. The OBV indicator is showing signs of rising above the High Line.
Therefore, we can initiate a trade around the HA-Low indicator level of 0.01566, depending on whether there is support.
However, since the price is in a stepwise downtrend, if it falls below 0.01566, we should cut our losses or sell in installments to secure funds for future purchases.
A full-scale uptrend is likely to begin when the M-Signal indicator on the 1W chart rises above it.
-
Unlike the TST chart, the CHZ chart has the M-Signal indicator from the 1M chart.
Therefore, to sustain a long-term uptrend, the price must rise above the M-Signal indicator on the 1M chart.
Currently, the price is in a stepwise downtrend, but it has risen above the M-Signal indicator on the 1W chart.
Therefore, if the price remains above the M-Signal indicator on the 1W chart, an uptrend is expected.
As mentioned earlier, the basic trading strategy considers the HA-High ~ DOM (60) range as a sell zone.
Therefore, we should respond based on the presence of support around the 0.04363-0.04631 range.
If the HA-High ~ DOM (60) range supports the price and rises, a stepwise uptrend is likely.
At this point, the key is whether the price can sustain itself by breaking above the M-Siganl indicator on the 1M chart.
-
To continue the uptrend by breaking above a key point or range, the following conditions must be met:
1. The TC indicator must be trending upward. If possible, it should remain above the zero level.
2. The StochRSI indicator must be trending upward. If possible, it should not enter the overbought zone.
3. The OBV indicator must be trending upward. If possible, it should remain above the High Line.
Based on the above conditions, the current price movement appears highly likely to continue upward.
However, if the price breaks above the next important level, the 0.04363-0.04631 range, we must reassess whether the above conditions are met.
------------------------------------------------------------
To trade, we strive to gather as much information as possible.
This information includes issues beyond the chart itself.
However, if you identify issues outside of the chart before the chart analysis is complete, you may end up analyzing the chart subjectively. Therefore, it's best to explore other issues after the chart analysis is complete.
The most important thing when looking at a chart is the flow of funds.
However, it can be difficult for individual investors to understand this flow.
Analyzing trading volume can also be difficult, so to simplify this process, we created the TC indicator, which utilizes the OBV and PVT indicators.
Furthermore, the DOM indicator, which comprehensively evaluates the DMI, OBV, and MONENTUM indicators, also includes trading volume and displays support and resistance points.
Additionally, you can activate the StochRSI 20, 50, and 80 indicators, as well as the OBV High and Low indicators.
You can utilize these indicators to further refine your trading strategy.
However, you should first check the movement and alignment of the M-Signal indicator on the 1M, 1W, and 1D charts.
Next, you should check the location of the DOM(-60) ~ HA-Low or HA-High ~ DOM(-60) range and determine whether there is support near those areas.
Using other people's indicators or chart analysis requires significant time and observation.
Otherwise, you are more likely to misinterpret the data and fail to trade.
To utilize my charts, it's recommended to activate the indicators as follows:
1. Activate only the M-Signal and HA-Low/HA-High indicators on the 1M, 1W, and 1D charts to check and observe the basic chart movements.
You can trade with these indicators alone.
However, if volatility occurs, the high and low points are not clearly defined, which can delay response times.
2. To prevent this, activate the DOM(60) and DOM(-60) indicators. The DOM(60) indicator represents a high, while the DOM(-60) indicator represents a low.
Therefore, you can buy around the DOM(-60) ~ HA-Low range depending on whether there's support, and sell around the HA-High ~ DOM(60) range depending on whether there's support.
3. If you're comfortable interpreting steps 1 and 2, you can use the movements of the auxiliary indicators TC, StochRSI, and OBV.
Steps 1 and 2 can be thought of as indicating support and resistance points. When determining support near these points, refer to the movements of the auxiliary indicators TC, StochRSI, and OBV to help you determine whether there's support.
Becoming proficient at interpreting steps 1 through 3 will greatly aid you in identifying trading opportunities.
-
Thank you for reading to the end.
I wish you successful trading.
--------------------------------------------------
Next Volatility Period: Around December 23rd
Hello? Hello, traders.
If you "Follow" us, you'll always get the latest information quickly.
Have a great day.
-------------------------------------
(XRPUSDT 1D Chart)
I believe the expected uptrend will continue when the price rises above 2.4810-2.6013.
Therefore, the final buy zone is the 2.4810-2.6013 zone.
If the price falls below the 1.5-19669 zone, a long-term downtrend should be considered.
Therefore, if support is found around the 1.5-19669 zone, it would be a good time to buy from a long-term perspective.
As it's difficult to determine the support level on a 1D chart alone, the StochRSI 80 and 20 indicators on the 1M chart are marked.
Therefore, the 1.8209-1.9575 range should be considered the support level for a continued uptrend.
If the price rises above the OBV High indicator and holds, further upside is likely.
However, it must break above the M-Signal indicator on the 1W chart.
-
Thank you for reading.
We wish you successful trading.
--------------------------------------------------

Next Volatility Period: Around January 1, 2026
Hello, traders!
Follow us to get the latest information quickly.
Have a great day!
-------------------------------------
(ETHUSDT 1D Chart)
This volatility period is expected to last until December 17th.
To initiate an uptrend, the price must rise above the M-Signal indicator on the 1M chart and remain stable.
In this sense, the key is whether the price can find support near 2887.66 and rise above 3025.27 to maintain its upward momentum.
However, a full-scale uptrend is expected to begin only if the price rises above the HA-High ~ DOM (60) range on the 1M chart (3321.30-3438.16).
-
From a trading perspective, trading below the M-Signal indicator on the 1M chart is difficult, so if possible, it's best to find a trading opportunity around 3025.27 based on the presence of support.
In the medium to long term, you can buy in installments whenever support is found near the DOM (-60) ~ HA-Low range.
Therefore, the timing for buying in installments is until support is found near 2770.12-2887.66.
However, if the price declines from the DOM(-60) to HA-Low range, a step-down trend is likely, so you should consider a countermeasure.
In other words, if you bought when the price was supported near the DOM(-60) to HA-Low range, you can sell a portion of your holdings when the price rises and then begins to decline, leaving the coins (tokens) corresponding to the profit. This can be done in installments.
-
To sustain the uptrend from a long-term perspective, the price must be maintained above 2419.83-2706.15.
If this fails and the price declines, a long-term downtrend is likely, so you should consider a countermeasure.
There are two types of declines:
1. Normal Decline
This occurs when the price rises from the DOM(-60) to HA-Low range, forms the HA-High to DOM(60) range, and then declines.
This decline is likely to continue until it reaches the DOM(-60) or HA-Low indicators, making it difficult to gauge the actual extent of the decline.
Therefore, during a normal decline, it's difficult to determine the timing of a partial purchase, so caution is advised when making a purchase.
However, other indicators and support and resistance levels can be used to estimate the timing.
2. Staircase Decline
This refers to a further decline from the DOM(-60) to HA-Low range.
Therefore, if the decline continues, the DOM(-60) or HA-Low indicators will eventually be encountered again, allowing for the timing of a partial purchase.
However, because it's impossible to predict the frequency of this decline, split trading is necessary.
When making a split trade, it's important to increase the number of coins (tokens) corresponding to the profit by engaging in short-term trading (day trading) at each split purchase price.
At the same time, you should recover a portion of your principal to secure funds for future split purchases.
-
Among the declines mentioned above, the moment we should be interested in is when the second step decline occurs.
In other words, it's worth considering trading when the DOM(-60) or HA-Low indicators are met.
-
Thank you for reading to the end.
I wish you successful trading.
--------------------------------------------------

The key is whether it can turn bullish
Hello, fellow traders.
Follow us to get the latest information quickly.
Have a great day.
-------------------------------------
(PM 12M chart)
The 111.25-123.55 range is expected to be a strong support area.
If the price falls below Fibonacci 1 (157.55), it is expected to form a downward wave towards 134.15.
If it finds support near Fibonacci 1 (157.55) and rises, it is expected to rise towards Fibonacci 1.618 (206.50).
-
(1M Chart)
The key question is whether it can find support near 153.32 and rise above 182.13.
The 153.32-182.13 range, which is the HA-High ~ DOM (60) range, is considered a sell zone.
Therefore, if you are in profit, you should focus on finding the right time to sell in installments.
To initiate a new purchase, you should confirm whether support is found in the 153.32-182.13 range.
Therefore, here's what we need to check:
To continue the uptrend by breaking above a key point or range, the StochRSI, TC, and OBV indicators must show upward trends.
If possible,
1. The StochRSI indicator should not have entered an overbought zone.
2. The TC indicator should remain above zero.
3. The OBV indicator should remain above the High Line.
If the above conditions are met and the price breaks above the 153.32-182.13 range, it is highly likely to continue rising.
If not, it will only pretend to rise and then fall again.
-
(1W Chart)
The M-Signal indicator on the 1W and 1M charts is crossing the Fibonacci range of 0.886 (148.52) to 1 (157.55).
Therefore, the key question is whether support can be found around 153.32 and an upward movement can occur.
-
(1D Chart)
The basic trading strategy is to buy in the DOM(-60) to HA-Low range and sell in the HA-High to DOM(60) range.
However, if the price rises in the HA-High to DOM(60) range, a stepwise uptrend is likely. If the price falls in the DOM(-60) to HA-Low range, a stepwise downtrend is likely.
Therefore, a split trading approach is necessary.
The price formed a low in the 144.60-148.53 range, which is the DOM(-60) ~ HA-Low range, and then rose.
Therefore, based on a basic trading strategy, it is highly likely to touch the 182.13-184.10 range.
The key to this is whether the price can break above the 163.59-170.29 range and turn upward.
-
Thank you for reading to the end.
I wish you successful trading.
--------------------------------------------------

Next Volatility Period: Around December 23rd
Hello, fellow traders!
Follow us to get the latest updates quickly.
Have a great day!
-------------------------------------
#BTCUSDT
To initiate a bullish trend, the price must rise above and sustain the OBV Low indicator level.
Considering the basic trading strategy of buying around DOM(-60) ~ HA-Low and selling around HA-High ~ DOM(60), the current price position represents a buying opportunity.
However, if the price falls between DOM(-60) and HA-Low, a stepwise downward trend is likely, so you should consider a response plan.
If the price falls below the DOM(-60) indicator, you should check for support around the 69000-73499.86 level.
This is because the 69000-73499.86 level represents an important support and resistance zone for sustaining an uptrend from a long-term perspective.
If the price declines from the 69,000-73,499.86 range, it is expected to form an uptrend around 42,000, a level never seen again.
-
If the price rises above the OBV Low indicator level and continues its upward trend, we should check for an upward breakout near the area circled on the chart.
If the price fails to break out, we should consider a response plan, as this could signal a full-blown bear market.
If the price continues to rise, the target levels are: - Right Fibonacci ratio 2.618 (133,889.92)
- Right Fibonacci ratio 3 (151,018.77) ~ 3.14 (157,296.36)
It is expected to re-establish the trend by rising near the above range.
The coin market is likely to experience a major bear market around the week of January 26, 2026.
-
Thank you for reading.
I wish you successful trading.
--------------------------------------------------
- Here's an explanation of the big picture.
(3-year bull market, 1-year bear market pattern)
I will explain more in detail when the bear market begins.
------------------------------------------------------

The key is whether the price can break above the 0.04032-0.04342
Hello, traders!
Follow us to get the latest information quickly.
Have a great day.
-------------------------------------
(JSTUSDT 1M chart)
If the price holds above 0.03942, a full-scale uptrend is expected to begin.
-
(1W chart)
If the price rises with support near 0.03942, an upward breakout near 0.05111 is likely to initiate an uptrend.
If the price fails to rise and falls,
1st: 0.03543
2nd: 0.02679
We should check for support near the 1st and 2nd levels above.
-
(1D chart)
The HA-High ~ DOM(60) range is formed between 0.04032 and 0.04342.
Therefore, a breakout above 0.04032 and 0.04342 is necessary for a stepwise uptrend to occur.
The first resistance level of the step-up trend is expected to be around 0.05111-0.05426.
Since the M-Signal indicator on the 1M chart is passing around 0.03543, if it falls below 0.03543, it's advisable to halt trading and assess the situation.
To break above a key point or range and continue the uptrend, the StochRSI, TC, and OBV indicators must show upward trends.
If possible,
- The StochRSI indicator should not enter the overbought zone.
- The TC indicator should remain above zero.
- The OBV indicator should remain above the High Line.
Currently, the StochRSI indicator has entered the overbought zone, which could limit the upside.
To overcome this and continue the uptrend, trading volume must increase explosively.
If not, you should look for a sideways movement and see if it tests support.
-
Thank you for reading.
I wish you successful trading.
--------------------------------------------------

Check for support near 159.51-161.01
Hello, fellow traders!
Follow me to get the latest information quickly.
Have a great day.
-------------------------------------
(LRCX 1D Chart)
If LRCX finds support near the 159.51-161.01 level and rises, it is expected to rise to around the Fibonacci level of 2.618 (197.94).
Since the current price level is within the previous high range, it should maintain the price above the 159.51-161.01 level if possible.
If not, a normal downtrend is likely.
At this point,
1st: M-Signal on the 1W chart (around 134.21)
2nd: M-Signal on the 1M chart (around 113.0)
There is a possibility of a decline to the 1st and 2nd levels above, so we need to consider a response plan.
A normal downtrend should be considered a profit-taking period.
This means it's likely difficult to determine the right time to buy again.
However, we can use various methods to mark support and resistance points and determine the right time to trade by checking for support.
Even so, it's difficult to easily buy during a normal downtrend.
It's best to consider the right time to buy when support is found around the DOM (-60) to HA-Low range and then determine the right time to trade.
Currently, the HA-Low indicator is at 65.49, so if it falls below 159.51 and continues to decline, the HA-Low indicator is likely to form.
If the HA-Low indicator forms, a new wave will form, so it's important to check for support at that time.
-
Thank you for reading.
We wish you successful trading.
--------------------------------------------------

The key is whether it can find support near 456.84 and rise
Hello, traders. Nice to meet you.
If you "Follow" me, you'll always get the latest information quickly.
Have a great day.
-------------------------------------
(VRTX 1M Chart)
The key is whether it can rise above 456.84-495.89.
If the price succeeds in rising,
1st: Right Fibonacci level 1.618 (552.93)
2nd: Right Fibonacci level 1.902 (619.03) ~ 2 (641.84)
3rd: Right Fibonacci level 2.618 (785.67)
We need to check for support near the above levels.
If the price fails to rise,
1st: 316.40
2nd: 236.34
There is a possibility of a decline near the first and second levels above.
At this time, it's important to check for the formation of the DOM (-60) or HA-Low indicator.
If the price falls below the M-Signal indicator on the 1M chart and remains there, there's a possibility of a downtrend, so we need to consider a response plan.
However, if the price declines to around 236.34-316.40, it could be a buying opportunity depending on the level of support, so you should also consider a response plan.
-
(1D chart)
The boxed areas represent important support and resistance zones.
Among them, the 456.84-495.89, 483.06-491.57, and 426.27-440.81 zones represent resistance zones.
For an upward breakout of these resistance zones and a sustained uptrend, the following conditions must be met:
1. The StochRSI indicator must be trending upward. Ideally, it should not have entered the overbought zone.
2. The TC indicator must be trending upward. Ideally, it should remain above zero. 3. The OBV indicator should show an upward trend. If possible, it should remain above the High Line.
With the above conditions met, we need to see if it can rise above and sustain the final resistance level of 495.89.
To achieve this, we expect to see up and down swings.
If it falls below the lowest resistance level of 426.27-440.81, it is highly likely to fall to the support level of 373.65-385.83.
At this point, a drop below 426.27 could lead to a step-down trend, so we need to consider how to respond.
However, if support is found, it's time to buy, so we need to consider how to proceed with partial purchases.
The reason for this concern is that if the price rises from the 373.65-385.83 range, it will touch the 426.27-440.81 range, then fall and touch the 373.65-385.83 range again.
In other words, if the price rises after receiving support from a support area, then forms a resistance area, then falls and touches the support area again, the likelihood of further declines is higher.
Therefore, you should consider how to execute a partial purchase when a stepwise downtrend is observed.
-
In any case, if the price rises after receiving support from around 456.84, the resistance area will be around 483.06-495.89.
If it breaks above, the stepwise uptrend is likely to continue.
-
Thank you for reading to the end.
I wish you successful trading.
--------------------------------------------------

The key is whether it can rise above 0.2851
Hello, fellow traders!
Follow us to get the latest information quickly.
Have a great day.
-------------------------------------
(TRXUSDT 1M Chart)
From a long-term perspective, the price needs to remain above 0.18-0.2011 to continue the uptrend.
If it encounters resistance at 0.2851 and declines, we should check for support near the M-Signal indicator on the 1M chart.
If further declines occur, support around 0.18-0.2011 will be crucial.
-
(1W chart)
Looking at the 1W chart, we should examine whether it finds support near 0.2548-0.2851 and can rise.
If it finds support near 0.2548-0.2851 and rises, the key question is whether it can break above the 0.3379-0.3614 range.
-
(1D chart)
Therefore,
1st: 0.2548-0.2851
2nd: 0.18-0.2011
When support is found near the 1st and 2nd levels above, it indicates a period of partial buying.
It is falling below the HA-Low indicator, showing a stepwise downward trend.
Therefore, you should consider either waiting for the stepwise downward trend to stop or increasing the number of coins (tokens) that can be profited through day trading.
-
Thank you for reading to the end.
I wish you successful trading.
--------------------------------------------------

Start of a full-blown uptrend: 2.0-2.1446
Hello, traders!
Follow us to get the latest information quickly.
Have a great day!
-------------------------------------
(SUIUSDT 1M chart)
To continue the uptrend, the price must rise above the M-Signal indicator on the 1M chart and hold.
Accordingly, the key question is whether the price can rise above the 2.0-2.1446 range and maintain its upward momentum.
If the upward movement fails, we should observe whether the M-Signal indicator on the 1M chart moves sideways until it declines near the Fibonacci level of 0.236 (1.3434).
-
(1W chart)
The key question is whether the price can find support and rise near the newly forming DOM (-60) ~ HA-Low range (1.4969-1.8396).
Based on the basic trading strategy, the target range is around the 4.2272-4.7328 range.
However, caution is advised when trading, as the price is currently forming below the M-Signal indicator on the 1M chart.
Therefore, I think it's best to start trading after confirming whether the price rises to around 2.0-2.1446 and maintains its strength.
-
(1D Chart)
When analyzing charts, it's best to observe the movements of the 1D chart as a basic trading strategy.
This is because most indicators are derived from the 1D chart.
In this sense, the key is whether the price can find support and rise around the 1.3451-1.5174 range, which is the DOM(-60) ~ HA-Low range on the 1D chart.
As mentioned earlier, to sustain the uptrend from a long-term perspective, the price must remain above the M-Signal indicator on the 1M chart. Therefore, the current price level is not suitable for trading.
A decline in the DOM(-60) ~ HA-Low range could lead to a step-down trend.
This means that the price is renewing its low, but it can also be considered a time for a split buy.
Therefore, you should consider how to execute a split buy before starting a trade.
If the price rises from the DOM(-60) to HA-Low range, the HA-High to DOM(60) range will form.
Therefore, if you bought near the DOM(-60) to HA-Low range, you should sell near the HA-High to DOM(60) range.
However, if the price rises from the HA-High to DOM(60) range, it's likely to form a step-up trend, so it's recommended to sell in steps.
As mentioned earlier, a step-up trend, like a step-down trend, means that the price is renewing its high.
Therefore, since a sharp decline is possible at any time, it's advisable to sell in steps at the appropriate time to secure profits.
-
In summary, if you encounter the DOM(-60) or HA-Low indicators, you should focus on finding the right time to buy and consider how to execute the split purchase.
Furthermore, if you encounter the DOM(60) or HA-High indicators, you should focus on finding the right time to sell and consider how to execute the split purchase.
This is the basic trading strategy.
If not, and you buy when the HA-High ~ DOM(60) range supports and rises, or sell when the DOM(-60) ~ HA-Low range resists and falls, it's best to maintain your stop loss.
-
Thank you for reading to the end.
I wish you successful trading.
--------------------------------------------------

See if it can rally after holding support at 0.2558-0.2672
Hello, fellow traders!
Follow us to get the latest updates quickly.
Have a great day!
-------------------------------------
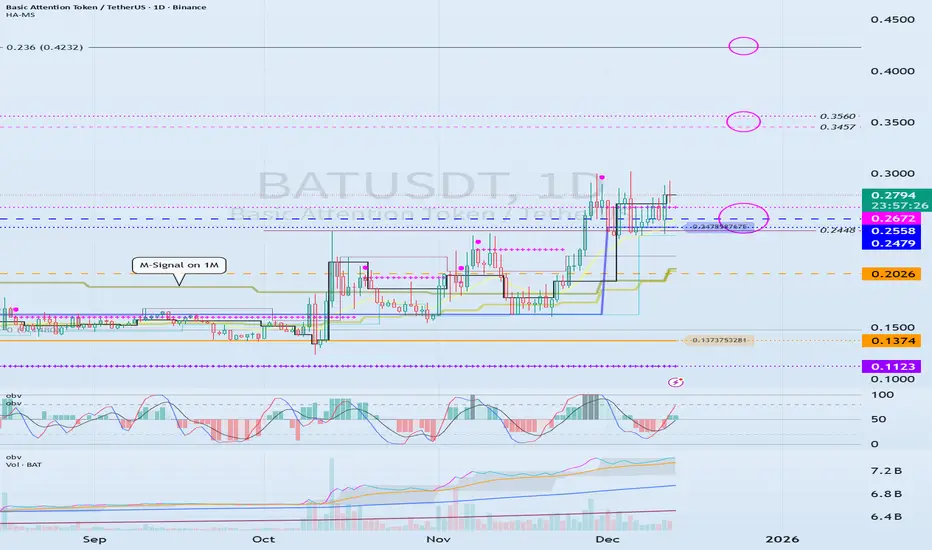
(BATUSDT 1M Chart)
After a significant decline, the price is forming a close above the M-Signal indicator on the 1M chart.
Accordingly, if the price remains above the M-Signal indicator on the 1M chart, the long-term uptrend is expected to continue.
Since the StochRSI 80 indicator is forming at 0.2448, we should examine whether it finds support near this level and can rise.
A full-scale uptrend is likely to begin when it rises above the Fibonacci level of 0.236 (0.4232).
If a full-scale uptrend begins, the target point is around 0.8357.
-
(1D chart)
Therefore, the key question is whether it can find support near the 0.2479-0.2672 range and rise above 0.3457-0.3560.
If it declines, we should examine whether support is found near the M-Signal indicator on the 1M chart.
Therefore, support around 0.2026 is crucial.
-
Thank you for reading to the end.
I wish you successful trading.
--------------------------------------------------
Strong Support and Resistance Area: 533.90-793.86
Hello, fellow traders!
Follow us to get the latest information quickly.
Have a great day!
-------------------------------------
(BNBUSDT 1D Chart)
The 533.90-793.86 area is a strong support and resistance area. A decline below this area is highly likely to trigger a long-term downtrend.
Therefore, if support is found around the 533.90-793.86 range, it would be a buying opportunity.
Since the HA-Low indicator formed at 871.15, if support is found around the 833.78-871.15 range, this would also be a buying opportunity.
Resistance levels are:
1st: 1028.57-1088.90
2nd: 1220.98-1302.65
The first and second levels above are resistance levels.
-
If the price holds above 793.86, it is expected to rise to around the circled range shown on the chart above.
BNB should be traded differently from BTC or ETH.
In other words, while you can continue to invest in BTC and ETH to purchase them, you should hold altcoins like BNB, XRP, and SOL by increasing the number of coins that represent profits.
Therefore, if the price rises after purchasing, you should sell the original purchase amount, leaving only the number of coins that represent profits.
This is because in a bear market, the price drops more sharply than expected.
BTC and ETH also show significant declines during bear markets, similar to altcoins. However, they tend to rebound faster than altcoins, allowing for continued investment and purchase.
However, to stabilize your psychological state, it's important to take some profits while you're in profit.
-
Thank you for reading to the end.
I wish you successful trading.
--------------------------------------------------

Check if the price remains above 2887.66
Hello, fellow traders.
If you "Follow" me, you'll always receive the latest information quickly.
Have a great day.
-------------------------------------
(ETHUSDT 1D Chart)
The HA-Low indicator on the 1D chart is showing signs of forming at 2887.66.
Since the HA-Low indicator previously formed at 3472.96 and is showing signs of forming again, determining whether support at 2887.66 is crucial.
Furthermore, since the indicator is located near the M-Signal indicator on the 1M chart, we need to see if the price can maintain its upward momentum above the M-Signal indicator on the 1M chart.
In this sense, a rise above the previous HA-Low indicator level of 3472.96 is expected to trigger an uptrend.
Therefore, to ensure that the uptrend continues after breaking above a key point or range, we need to monitor whether the StochRSI, TC, and OBV indicators remain in an upward trend.
Since the OBV indicator has fallen below the EMA 3, it must rise above and remain above the EMA 3 level.
We need to confirm whether the price can rise above the M-Signal indicator on the 1M chart after passing through this volatility period around November 27th (November 26th-28th).
-
Thank you for reading.
We wish you successful trading.
--------------------------------------------------

Check if it can rise above 422.80
Hello? Hello, traders.
If you "Follow" us, you'll always get the latest information quickly.
Have a great day.
-------------------------------------
(ZECUSDT 1D Chart)
After a sharp rise, the price is showing a sharp decline.
The key to a bullish turn is whether the price can rise above 422.80 and hold.
If the uptrend fails, we need to check for support around 216.60.
If it falls below 216.60, it's likely to take time to rise again.
Although the price is showing a short-term downtrend, falling below the M-Signal indicator on the 1D chart, it should be considered an ongoing uptrend because the M-Signal indicator on the 1D chart > M-Signal on the 1W chart > M-Signal on the 1M chart is arranged in this order.
Therefore, if the M-Signal indicator on the 1W chart declines, consider whether it can find support near the M-Signal indicator on the 1M chart and consider a response plan.
Therefore, the movement when the price falls to around 216.60 is crucial.
There is a possibility that the price will rise above the OBV High indicator, sustaining the price and indicating further upward movement.
However, since the OBV Low indicator is still above the OBV High indicator, a sideways movement seems likely.
-
Thank you for reading to the end.
We wish you successful trading.
--------------------------------------------------

The key is whether it can break above 588.5-616.2
Hello, traders!
Follow us to get the latest information quickly.
Have a great day.
-------------------------------------
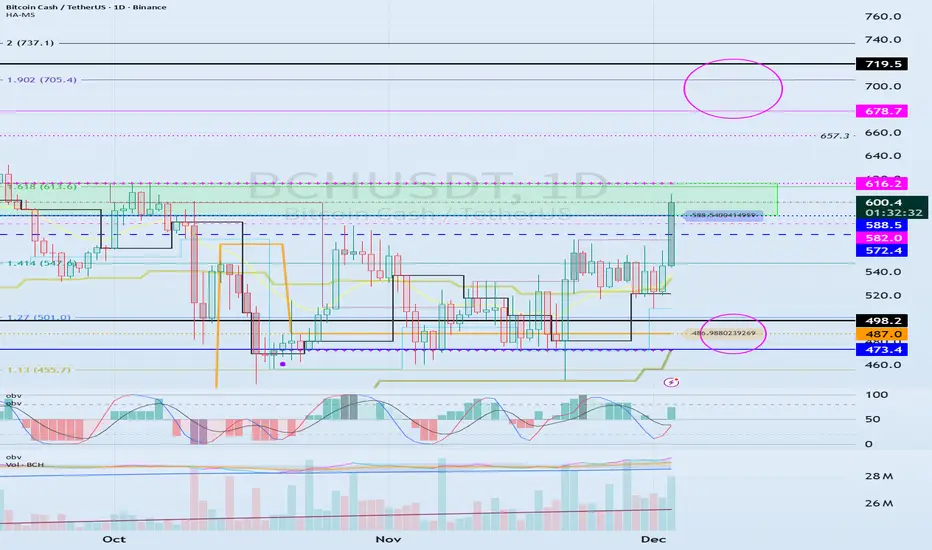
(BCHUSDT 1D chart)
The 1D chart is rising towards the HA-High ~ DOM (60) range, raising expectations for a bullish trend.
Accordingly, the key question is whether the 588.5-616.2 range can be supported and the price can rise.
If it rises, we should examine whether it can break above the 678.7-719.5 range, which is the range formed by the DOM (60) indicator on the 1M chart and the previous high.
To continue the uptrend by breaking above key points or ranges, the StochRSI, TC, and OBV indicators must show upward trends.
If possible,
- The StochRSI indicator should not have entered an overbought zone.
- The TC indicator should remain above zero.
- The OBV indicator should remain above the High Line.
Therefore, we should examine the movements of the StochRSI, TC, and OBV indicators when the price rises above the DOM (60) indicator.
If the StochRSI falls below 80, it's considered a stop loss, as further declines are likely.
-
Thank you for reading.
We wish you successful trading.
--------------------------------------------------
Weekly and Monthly Forecast
Hello, fellow traders!
Follow us to get the latest information quickly.
Have a great day!
-------------------------------------
(BTCUSDT 1D chart)
The volatility period has ended.
The key is whether it can rise above 89294.25.
If not, we need to check for support near 69000-73499.86.
(1W chart)
The following are important areas as the price falls below the third range:
- 116259.91-119086.64
- 87814.27-93570.28
- 69000-73499.86
A decline below the 69000-73499.86 range can be considered a long-term downtrend, so this is a very important area for now.
Therefore, as the price approaches the 69000-73499.86 range, we need to check for increased trading volume or the emergence of a new HA-Low indicator on the 1W chart.
If the HA-Low indicator is formed, it's important to determine whether there's support near it.
The basic trading strategy is to buy in the DOM(-60) ~ HA-Low range and sell in the HA-High ~ DOM(60) range.
If the price rises near the HA-Low indicator and moves toward the HA-High indicator, the wave should be considered closed (reset).
Conversely, if the price falls near the HA-High indicator and moves toward the HA-Low indicator, the wave should also be considered closed (reset).
A closed (reset) wave means that the trend has been reestablished.
Therefore, as mentioned earlier, the basic trading strategy is created.
However, if the price rises in the HA-High ~ DOM(60) range, a stepwise uptrend is likely, while if the price falls in the DOM(-60) ~ HA-Low range, a stepwise downtrend is likely.
The end of a stepwise uptrend is a decline, and the end of a stepwise downtrend is a rise.
Therefore, a decline after encountering the HA-Low indicator is different from a decline after encountering the HA-High indicator.
Therefore, a stepwise downtrend indicates a period of truncation buying, while a stepwise uptrend indicates a period of truncation selling.
During a stepwise downtrend, even if the price declines, there's an expectation that a price increase will occur soon, so you can increase the number of coins (tokens) representing profit.
This method involves trading at each purchase price and selling the same amount of coins (tokens) when the price rises, thereby increasing the number of coins (tokens) representing profit.
The coins (tokens) representing profit are those with a purchase price of 0, which can lead to significant profits later.
-
A bullish trend can be considered when the price rises above the M-Signal indicator on the 1M chart and holds.
However, the point where you should actually buy is when the price rises above 108353.0.
Based on the current trend, the next volatility period is expected around December 23rd.
Therefore, you should check to see if the price holds above 89294.25 during the next volatility period.
Therefore, it appears likely that the price will move sideways to reverse the trend.
Based on the price movement, the start of a major bear market is expected to begin after the first quarter of next year.
However, if the price falls below 69000-73499.86, you should consider this a bear market and consider a response plan.
-
Thank you for reading to the end.
I wish you successful trading.
--------------------------------------------------
- Here's an explanation of the big picture.
(3-year bull market, 1-year bear market pattern)
I'll explain more in detail when the bear market begins.
------------------------------------------------------