In-depth analysis of gold price trends next weekBullish Core Support: Three Logic Pillars Bolster the Upward Trend
1.Fed Independence Controversy Escalates, Risk Aversion Provides Sustained Support: The controversy surrounding the independence of the Federal Reserve, triggered by the criminal investigation into Chairman Powell, continues unabated. The Trump administration's political pressure on the Fed has raised global concerns about policy stability. Central bank governors from several countries have expressed support for Powell, increasing market doubts about the credibility of the dollar system and driving a continuous influx of safe-haven funds into gold. Coupled with unresolved geopolitical tensions such as the US-EU tariff dispute and the Greenland sovereignty dispute, gold's value as a "risk-free" asset is highlighted, with strong buying support below 4930.
2.Central Bank Gold Buying Spree Continues, Providing Strong Medium-to-Long-Term Support: The global trend of central bank gold purchases remains unchanged in 2026. The Polish central bank has approved a 150-ton gold purchase plan, and the People's Bank of China has increased its gold holdings for 14 consecutive months. The Shanghai Gold ETF has seen a cumulative net inflow of 3.29 billion yuan in the past four days. Non-price-elastic buying from institutions and central banks provides solid support above 4900, acting as a ballast for gold price corrections. Meanwhile, the global de-dollarization process is accelerating, with gold's share in foreign exchange reserves rising to nearly 20%, surpassing US Treasury bonds as the largest reserve asset, solidifying the long-term upward trend.
3.Dovish Officials Speak Out, Rate Cut Expectations Not Completely Dissipated: Although the Fed's hawkish stance prevails, the dovish camp still has a voice. Fed Governor Michelle Bowman emphasized the fragility of the job market, advocating for decisive interest rate cuts if the employment situation deteriorates, noting that core inflation is close to the 2% target, leaving room for easing. The CME FedWatch Tool shows that the market is still pricing in two rate cuts in 2026, with the first rate cut expected in June. Although this is a cooling down from previous expectations, it has not completely disappeared, and the opportunity cost of holding gold remains low.
4. Strong trend momentum and a complete bullish technical structure: Gold prices broke through $4980 and reached a new historical high of $4987. The daily and weekly moving averages show a perfect bullish arrangement, with the 5-day moving average providing dynamic support for gold prices. Previous pullbacks accurately tested the moving average levels, and the effectiveness of this support has been repeatedly verified. In terms of volume, both New York gold and Shanghai gold are showing strong upward momentum, with trading volume moderately increasing, reflecting that market bullish sentiment remains strong. The trend momentum suggests a strong upward movement next week.
Gold trading strategies
buy:4950-4960
tp:4980-5000-5020
Harmonic Patterns

#XAUUSD:+4000 Pips Swing Targeting $5000! Comment Your Views! Dear Traders,
Gold has been bullish since last week as the uncertainty rises across the globe. The fear is growing and which is the main reason why Gold has been bullish. In this market scenarios, we may not see a strong correction as momentum remain extremely bullish. Right now, if you are thinking about taking an entry, you may consider entering around our marked zone.
We are targeting $5000 and it may take whole year to get completed. The move is swing and you can set target or take profit if you are thinking about intraday positions.
Good luck
Team Setupsfx_

Bullish Divergence appearing on shorter tf.BTC Analysis
CMP 87846.93 (24-12-2025)
Bullish Divergence appearing on shorter tf.
The price may bounce towards 91000 - 91500.
However, monthly closing above 87000 may bring
some more positivity.
Immediate Resistance is around 91000 - 91500 &
then aorund 97700.
However, if 80000 is broken this time, we may
witness more selling pressure.

Beautifully making HH HL.GOLD Analysis
CMP 11-01-2026
Beautifully making HH HL.
Previous Resistance should now act as a Support (around 4350 - 4400)
Crossing & Sustaining 4500 - 4600 may lead it towards 4900 - 5000.
However, breaking 4200 may bring more selling pressure.

Bitcoin's path Bitcoin likes to make such moves , a lot of ups and downs and create these bullish channels.
I do believe the best is yet to come .
So much to happen .
Remember everything is priced in.

BTCUSD From Consolidation to DistributionThis BTCUSD 1H chart shows a clear bearish market structure following a prolonged consolidation phase. Price initially ranged sideways within a well-defined consolidation area, which later broke to the upside into a supply zone. That move marked distribution after which Bitcoin reversed and began trading inside a descending channel.
Within the channel, price respected lower highs and lower lows, confirming bearish momentum. A sharp breakdown occurred near the channel midline, accelerating price toward key downside levels. Two downside targets are highlighted:
1st Target (87,356) a short-term liquidity and structure target
2nd Target (84,499) aligned with a strong demand zone, where buyers may step in
Overall, the chart illustrates a classic consolidation distribution trend continuation setup, favoring further downside until demand is reached.

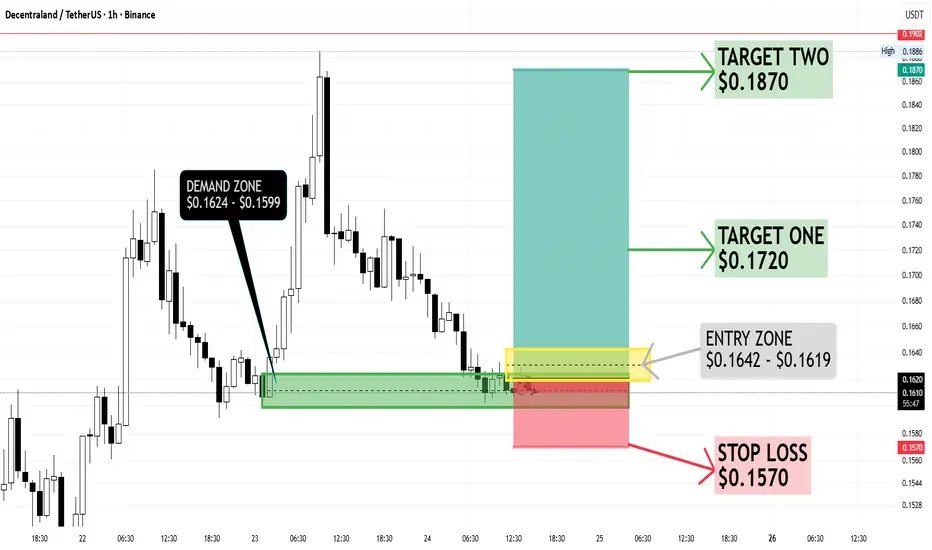
MANA/USDT (1H) : Bullish Rebound Setup From Key Demand ZoneBINANCE:MANAUSDT is trading around $0.162 and is currently pulling back into a strong demand and entry zone at $0.164–$0.162. As long as price holds above $0.157, the bullish setup remains valid.
On the upside, $0.172 is the first target where some resistance is expected. If buyers push through with good momentum, the next upside level to watch is $0.187, which aligns with previous highs and selling zones.
From a broader view, BINANCE:MANAUSDT is stabilizing after a decline and showing signs of accumulation near support. Buyers are defending the $0.16 area well, suggesting potential upside continuation. Fundamentally, Decentraland remains stable with ongoing ecosystem development, and sentiment around metaverse tokens has slightly improved, supporting a possible recovery move.
USAR: Come back!USAR
.
Crowd FOMOs in → USAR dumps. Crowd gives up → new rally starts.
.
US STOCKS- WALL STREET DREAM- LET'S THE MARKET SPEAK!

Trade outlook on Gold, Silver, Crude, NQ, ES, BTCCovered my 5 instruments. What was the narrative for the day and how I framed my trades on Gold and NQ and what were the key areas that you need to look for.

ESG Investing and Sustainable FinanceUnderstanding ESG Investing
ESG stands for Environmental, Social, and Governance, three broad categories used to assess a company’s non-financial performance and sustainability impact.
Environmental (E):
This dimension evaluates how a company interacts with the natural environment. Key factors include carbon emissions, energy efficiency, renewable energy usage, waste management, water conservation, pollution control, and climate risk exposure. Companies with strong environmental practices are generally better positioned to adapt to climate regulations, energy transitions, and resource constraints.
Social (S):
The social component focuses on how a company manages relationships with employees, customers, suppliers, and communities. It includes labor standards, employee health and safety, diversity and inclusion, data privacy, human rights, customer satisfaction, and community engagement. Strong social performance often leads to higher employee productivity, brand loyalty, and reduced reputational risk.
Governance (G):
Governance examines how a company is directed and controlled. It covers board structure, executive compensation, shareholder rights, transparency, ethical conduct, risk management, and anti-corruption practices. Good governance ensures accountability and alignment between management decisions and shareholder interests, reducing the risk of scandals and mismanagement.
ESG investing integrates these factors into investment analysis alongside traditional financial metrics such as revenue growth, profitability, and balance sheet strength.
What Is Sustainable Finance?
Sustainable finance is a broader concept that refers to financial activities that support long-term economic growth while reducing environmental pressures and addressing social challenges. It aims to channel capital toward projects, companies, and economic activities that contribute to sustainable development.
Sustainable finance includes:
ESG investing
Impact investing
Green finance
Social finance
Climate finance
The core objective of sustainable finance is to balance financial returns with positive environmental and social outcomes, ensuring that today’s investments do not compromise future generations.
Evolution and Drivers of ESG and Sustainable Finance
The roots of ESG investing can be traced back to ethical and socially responsible investing (SRI), where investors avoided sectors such as tobacco, weapons, or gambling. Over time, ESG evolved into a more data-driven and financially grounded approach.
Key drivers behind the growth of ESG and sustainable finance include:
Climate Change and Environmental Risks:
Increasing frequency of extreme weather events, carbon regulations, and global climate commitments have made environmental risks financially material.
Regulatory Pressure:
Governments and regulators worldwide are introducing ESG disclosure norms, carbon pricing mechanisms, and sustainability reporting standards, pushing companies to be more transparent.
Investor Demand:
Institutional investors, pension funds, and retail investors are demanding investments aligned with sustainability and long-term value creation.
Risk Management:
ESG factors help identify risks that traditional financial analysis may overlook, such as supply chain disruptions, labor disputes, or governance failures.
Corporate Accountability:
Companies are under increasing scrutiny from stakeholders, including consumers, employees, and civil society, to operate responsibly.
Approaches to ESG Investing
There are several strategies used in ESG investing:
Negative Screening:
Excluding companies or sectors that do not meet certain ESG criteria, such as fossil fuels or controversial weapons.
Positive Screening (Best-in-Class):
Investing in companies that perform better on ESG metrics compared to peers within the same industry.
ESG Integration:
Systematically incorporating ESG factors into traditional financial analysis to improve risk-adjusted returns.
Thematic Investing:
Focusing on sustainability themes such as renewable energy, clean water, electric vehicles, or healthcare access.
Impact Investing:
Targeting investments that generate measurable positive social or environmental impact alongside financial returns.
Financial Performance and ESG
One of the most debated questions is whether ESG investing sacrifices returns. Increasing evidence suggests that ESG-aligned investments can deliver competitive or even superior risk-adjusted returns over the long term.
Companies with strong ESG practices often benefit from:
Lower cost of capital
Better operational efficiency
Reduced regulatory and legal risks
Stronger brand reputation
Higher resilience during market stress
However, ESG performance does not guarantee short-term outperformance. The benefits are more pronounced over longer investment horizons, where sustainability factors play a larger role.
Sustainable Finance Instruments
Sustainable finance has given rise to new financial instruments, including:
Green Bonds:
Used to finance environmentally friendly projects such as renewable energy, energy efficiency, and sustainable infrastructure.
Social Bonds:
Fund projects that address social issues like affordable housing, education, and healthcare.
Sustainability-Linked Bonds and Loans:
Financial terms are linked to the issuer’s achievement of ESG performance targets.
ESG Funds and ETFs:
Investment funds that integrate ESG criteria into their portfolio construction.
These instruments allow investors to align their capital with sustainability goals while maintaining financial discipline.
Challenges and Criticisms
Despite its rapid growth, ESG investing faces several challenges:
Lack of Standardization:
ESG ratings and metrics vary widely across providers, leading to inconsistent assessments.
Greenwashing:
Some companies and funds exaggerate their sustainability credentials without meaningful action.
Data Quality and Transparency:
ESG data can be incomplete, self-reported, or backward-looking, limiting its reliability.
Trade-offs and Subjectivity:
ESG priorities can differ among investors, making universal definitions difficult.
Addressing these challenges requires stronger disclosure standards, improved data quality, and regulatory oversight.
Future of ESG Investing and Sustainable Finance
The future of ESG investing and sustainable finance looks increasingly integrated with mainstream finance. Sustainability considerations are shifting from being optional or niche to becoming a core component of investment decision-making.
Key trends include:
Greater regulatory harmonization of ESG reporting
Increased use of technology and data analytics for ESG measurement
Deeper integration of climate risk into financial models
Expansion of sustainable finance into emerging markets
As global capital markets evolve, ESG investing and sustainable finance are expected to play a crucial role in shaping a more resilient, inclusive, and sustainable economic system.
Conclusion
ESG investing and sustainable finance represent a fundamental shift in how financial success is defined and achieved. By integrating environmental, social, and governance factors into investment decisions, investors can better manage risks, identify long-term opportunities, and contribute to sustainable development. While challenges such as data inconsistency and greenwashing remain, the overall direction is clear: finance is increasingly being aligned with sustainability. In the long run, ESG investing and sustainable finance are not just about doing good—they are about building durable value in a rapidly changing world.


Why Forex Reserves Matter1. Foundation of Currency Stability
One of the most important reasons forex reserves matter is their role in maintaining currency stability. Exchange rates are influenced by supply and demand in the foreign exchange market. During periods of stress—such as capital outflows, geopolitical tensions, or global financial shocks—a country’s currency may come under severe depreciation pressure.
Forex reserves allow the central bank to intervene in currency markets by selling foreign currency (usually US dollars) and buying the domestic currency. This intervention helps smooth excessive volatility, prevent panic-driven depreciation, and maintain orderly market conditions. Without sufficient reserves, a country becomes vulnerable to speculative attacks and sharp currency crashes, which can quickly spill over into inflation and financial instability.
2. Shield Against External Shocks
Global economies are interconnected. External shocks such as oil price spikes, global recessions, sudden stops in capital flows, or financial crises can severely impact a country’s balance of payments. Forex reserves act as a financial buffer during such times.
When export revenues decline or foreign capital dries up, reserves help meet external payment obligations like imports, debt servicing, and foreign liabilities. Countries with healthy reserves can absorb shocks more effectively, avoiding abrupt policy measures such as import restrictions, capital controls, or emergency borrowing at unfavorable terms.
3. Ensuring Smooth International Trade
International trade relies heavily on stable access to foreign currencies. Countries need forex to pay for imports such as crude oil, machinery, technology, medicines, and essential commodities. Adequate forex reserves ensure that a nation can continue importing critical goods even if export earnings temporarily fall.
This is particularly important for import-dependent economies. If reserves are low, even short-term disruptions can lead to shortages, rising prices, and economic stress. Strong reserves, on the other hand, reassure global suppliers and trading partners that payments will be honored on time, strengthening trade relationships.
4. Boosting Investor Confidence
Forex reserves are closely watched by foreign investors, rating agencies, and international financial institutions. High and stable reserves signal economic strength, prudent macroeconomic management, and financial discipline.
When investors see that a country has ample reserves, they feel more confident investing in its equity markets, bonds, and infrastructure projects. This confidence reduces the country’s risk premium, lowers borrowing costs, and attracts long-term capital inflows. Conversely, declining or critically low reserves often raise red flags, triggering capital flight and currency depreciation.
5. Supporting Monetary and Fiscal Policy
Forex reserves enhance the effectiveness of monetary policy. Central banks use reserves to manage liquidity, control inflationary pressures arising from currency depreciation, and stabilize interest rates during volatile periods.
In addition, reserves provide flexibility to the government during fiscal stress. While reserves are not meant to fund regular government spending, their presence allows policymakers more room to maneuver during crises—such as pandemics or financial meltdowns—without immediately resorting to external bailouts or austerity measures.
6. Meeting External Debt Obligations
Many countries borrow in foreign currencies. Servicing this external debt—interest and principal repayments—requires reliable access to forex. Reserves ensure that debt obligations can be met even if market access becomes constrained or refinancing becomes expensive.
Countries with weak reserves may face higher default risks, currency mismatches, and rising debt servicing costs. In contrast, strong reserves lower sovereign risk and improve credit ratings, which further reduces borrowing costs in international markets.
7. Crisis Prevention and Crisis Management
History provides many examples where inadequate forex reserves triggered or worsened economic crises. Currency crises in Asia (1997), Latin America, and other emerging markets were often linked to weak reserves relative to short-term external liabilities.
Adequate reserves serve as insurance. They deter speculative attacks because markets know the central bank has enough firepower to defend the currency. Even if reserves are not fully used, their presence alone can prevent crises by anchoring expectations and calming markets.
8. Enhancing Global Standing and Negotiating Power
Forex reserves also influence a country’s global economic standing. Nations with large reserves have greater influence in international forums, stronger bargaining power in trade negotiations, and more credibility in global financial discussions.
They are also better positioned to support regional stability, extend swap lines, or assist neighboring economies during crises. This enhances geopolitical and economic influence beyond domestic borders.
9. Indicator of Economic Health
Forex reserves are a key macroeconomic indicator. Analysts track metrics such as import cover (how many months of imports reserves can pay for), reserves-to-GDP ratio, and reserves relative to short-term external debt. These indicators help assess a country’s vulnerability to external risks.
While extremely high reserves may raise questions about opportunity costs, insufficient reserves are almost universally viewed as a serious economic weakness.
10. Balancing Costs and Benefits
It is important to note that holding forex reserves is not cost-free. Reserves are usually invested in low-risk, low-return assets like US Treasury bonds. This means there is an opportunity cost compared to investing in domestic infrastructure or social development.
However, most economists agree that the benefits of adequate reserves—stability, confidence, and resilience—far outweigh the costs, especially in a volatile global financial environment.
Conclusion
Forex reserves matter because they sit at the crossroads of stability, confidence, and sovereignty in the global financial system. They protect a country from external shocks, stabilize the currency, support trade, reassure investors, and strengthen policy effectiveness. In an era marked by rapid capital flows, geopolitical uncertainty, and frequent economic disruptions, strong forex reserves are not a luxury—they are a necessity.
For policymakers, investors, traders, and citizens alike, understanding the importance of forex reserves provides deeper insight into a nation’s economic strength and its ability to navigate uncertainty with confidence.

Globalization and Deglobalization An Evolving Economic NarrativeUnderstanding Globalization
Globalization refers to the process through which countries, businesses, and people become increasingly interconnected and interdependent across borders. This integration occurs through the movement of goods, services, capital, technology, information, and labor. The roots of globalization can be traced back centuries through trade routes like the Silk Road, but its modern form accelerated significantly after World War II.
Key drivers of globalization include advances in technology, reductions in trade barriers, liberalization of financial markets, and the rise of multinational corporations. Innovations in transportation, such as container shipping, and communication technologies, like the internet and mobile connectivity, have drastically reduced the cost and time required to conduct cross-border activities. Institutions such as the World Trade Organization (WTO), International Monetary Fund (IMF), and World Bank have also played a crucial role by promoting free trade, financial stability, and economic cooperation.
Economically, globalization has allowed countries to specialize based on comparative advantage, leading to more efficient production and lower costs. Consumers benefit from a wider variety of goods at competitive prices, while businesses gain access to global markets, capital, and talent. Emerging economies, particularly in Asia, leveraged globalization to accelerate industrialization, lift millions out of poverty, and integrate into global value chains.
Beyond economics, globalization has had profound cultural and social impacts. Ideas, values, lifestyles, and entertainment now flow rapidly across borders, contributing to cultural exchange and, in some cases, cultural homogenization. Education, tourism, and migration have expanded global exposure, fostering cross-cultural understanding but also sparking debates about identity and tradition.
Benefits and Criticisms of Globalization
Despite its benefits, globalization has faced significant criticism. One major concern is inequality. While globalization has increased global wealth, the gains have not been evenly distributed. Developed countries and large corporations often benefit more than developing nations or small businesses. Within countries, high-skilled workers and capital owners tend to gain, while low-skilled workers may face job displacement due to outsourcing and automation.
Another criticism relates to labor and environmental standards. Companies operating across borders may shift production to countries with lower wages, weaker labor protections, or lax environmental regulations, leading to exploitation and environmental degradation. Additionally, globalization can reduce national policy autonomy, as governments may feel constrained by global markets, trade agreements, and investor expectations.
Financial globalization has also increased vulnerability to global shocks. Crises such as the 2008 global financial crisis demonstrated how deeply interconnected financial systems can transmit instability rapidly across borders.
The Emergence of Deglobalization
Deglobalization refers to the slowing, reversal, or reconfiguration of global integration. It does not necessarily imply a complete withdrawal from global trade or cooperation but reflects a shift away from hyper-globalization toward more localized or regional systems. Deglobalization gained prominence after the global financial crisis and intensified further due to geopolitical tensions, trade wars, the COVID-19 pandemic, and rising nationalism.
Several factors have contributed to deglobalization. Politically, there has been a resurgence of nationalist and populist movements advocating for domestic industries, border controls, and economic sovereignty. Trade policies such as tariffs, sanctions, and reshoring initiatives reflect growing skepticism toward free trade. The US–China trade tensions are a prominent example of how strategic rivalry can disrupt global supply chains.
Economically, firms and governments have reassessed the risks of over-reliance on complex global supply chains. The pandemic exposed vulnerabilities in just-in-time production systems, leading many countries to prioritize supply chain resilience, strategic stockpiles, and domestic manufacturing, especially in critical sectors like semiconductors, pharmaceuticals, and energy.
Technological and security concerns have also fueled deglobalization. Control over data, technology transfer, and national security has become a priority, resulting in restrictions on foreign investment, technology exports, and cross-border data flows.
Impacts of Deglobalization
Deglobalization has mixed consequences. On one hand, it can enhance national resilience, protect strategic industries, and create local employment opportunities. It allows governments greater control over economic policy and reduces exposure to external shocks. Regionalization of trade, where countries trade more within geographic blocs, can also strengthen regional cooperation.
On the other hand, deglobalization can increase costs, reduce efficiency, and limit innovation. Protectionist policies may lead to higher prices for consumers, retaliatory trade measures, and slower economic growth. Developing countries that depend on export-led growth may face reduced opportunities, potentially widening global inequality.
Deglobalization also risks fragmenting the global system into competing blocs, increasing geopolitical tensions and reducing collaboration on global challenges such as climate change, public health, and financial stability.
Globalization vs. Deglobalization: A False Dichotomy?
Rather than viewing globalization and deglobalization as absolute opposites, many analysts argue that the world is entering a phase of “re-globalization” or “selective globalization.” In this model, countries remain globally connected but with greater emphasis on resilience, sustainability, and strategic autonomy. Global supply chains are being restructured rather than dismantled, with diversification, nearshoring, and friend-shoring becoming common strategies.
Digital globalization continues to expand even as physical trade growth slows. Cross-border data flows, digital services, and remote work are creating new forms of global integration that differ from traditional manufacturing-led globalization.
Conclusion
Globalization and deglobalization are not static or mutually exclusive processes but part of a dynamic continuum shaped by economic, political, technological, and social forces. Globalization has driven growth, innovation, and interconnectedness, while deglobalization reflects a corrective response to its excesses and vulnerabilities. The future is likely to be defined not by complete globalization or isolation, but by a more balanced and adaptive global system—one that seeks efficiency alongside resilience, openness alongside sovereignty, and growth alongside inclusivity.

Sell At monthly time frame price is heading to supply zone we will wait for ltf confirmation to sell

IREN | DailyNASDAQ:IREN — Quantum Model Projection
Bullish Alternative 📈
IREN has appreciated ~70% since mid-December, launched decisively from the support
Q-Structure λₛ confluence.
This advance is projected as the initial phase of Intermediate Wave (5) within Primary Wave ⓷, potentially unfolding as an extension, with a Fib-extension target ➤ $431 🎯 (beyond the scope of the daily frame).
🔖 This bullish alternative structurally aligns with early Primary Wave ⓹ within Wave III of BTC ’s second Cycle.
🔖 This outlook is derived from insights within my Quantum Models framework. Within this methodology, Q-Targets represent high-probability scenarios generated by the confluence of equivalence lines. These Quantum Structures also serve as structural anchors, shaping the model's internal geometry and guiding the evolution of alternative paths as price action unfolds.


BTC is experiencing a volatile downward trend.Bearish Core Pressure (Bearish Logic)
1.Geopolitical and macroeconomic risks persist: The Trump administration's policy of imposing tariffs on European countries continues to have repercussions, putting pressure on global risk appetite. The correlation between US stocks and cryptocurrencies has strengthened, and if US stocks continue to weaken, it will simultaneously suppress the price of Bitcoin. Furthermore, funds still favor traditional safe-haven assets such as gold, and the "digital gold" narrative for Bitcoin is temporarily ineffective, leading to significant capital outflow.
2.
3.Short-term holders face concentrated selling pressure from unrealized losses: On-chain data shows that short-term holders who entered the market in the past 155 days have an average cost above $98,000, remaining in a state of unrealized losses. The net unrealized profit/loss indicator is negative, and when the price rebounds to the $90,000-$91,000 range, selling pressure from short-term holders seeking to break even will surge.
4.
5.Clear resistance at key levels: The $90,500-$91,000 range is a previous area of concentrated trading, and coupled with the capital dynamics near the liquidation price of large whale long positions, it forms a strong resistance zone. Furthermore, the price previously encountered a pullback near $97,000, indicating heavy overhead resistance, making a breakthrough difficult without sufficient trading volume.
6.
7.Weak ETF capital inflows: Recent capital inflows into Bitcoin spot ETFs have slowed, and even experienced periods of net outflows. Institutional investors are cautious in their entry, and insufficient incremental capital makes it difficult to support a sustained price rebound, limiting upside potential.
Bitcoin trading strategy
sell:90000-91000
tp:89000-88000

Elise | BTCUSD · 30M – Bearish Continuation SetupBITSTAMP:BTCUSD
Price experienced a strong sell-off from the premium zone, followed by weak consolidation. This type of pause after a sharp drop typically represents bearish continuation, not accumulation. Buyers are reactive, not in control.
Key Scenarios
❌ Bearish Case 📉
If price remains below the breakdown structure, continuation toward sell-side liquidity is expected.
🎯 Target 1: 91,800 – 91,600
🎯 Target 2: 90,200 – 90,000
✅ Bullish Invalidation
A strong reclaim and close above 94,000 would invalidate the bearish continuation and shift structure.
Current Levels to Watch
Resistance 🔴: 94,000 – 95,000
Support 🟢: 91,600 → 90,000
⚠️ Disclaimer: This analysis is for educational purposes only. Not financial advice.


What I Use to Trade XAUUSD — A Simple, Structured ApproachI’ve traded XAUUSD long enough to realize a rather uncomfortable truth: the more complex the system, the worse the results often become. I’ve tried many setups, many indicators, many approaches. But after going through multiple market cycles, what stayed with me wasn’t anything “fancy” — it was a simple, structured way of reading price.
This post isn’t about showing off a strategy or selling a method. I’m simply sharing exactly what I use every day to trade XAUUSD — clean, structured, and effective enough to survive long term.
1. I don’t try to predict the market — I read structure
My analysis always starts with market structure.
Is price making higher highs and higher lows, or lower highs and lower lows? Is the trend still intact, or has it been broken?
If the structure is clear, I have no reason to fight it.
If structure breaks, I stop and observe.
I don’t look for entries first.
I look for the right context first.
2. EMA 34 & EMA 89 — enough to know where I stand
I only use two moving averages: EMA 34 and EMA 89.
Not to catch tops or bottoms, but to answer very basic questions:
- Is the market trending or ranging?
- Is the current move impulsive or corrective?
- Am I trading with momentum or against it?
When price is above the EMAs and they slope upward, I prioritize buys.
When price is below the EMAs and they slope downward, I prioritize sells.
That’s it — simple, but it filters out a lot of low-quality trades.
3. Support & resistance: fewer levels, but meaningful ones
I don’t draw many zones. I only keep levels that matter:
- Clear swing highs and lows on H4 and D1
- Areas where price previously reacted strongly
- When price pulls back into these zones while the trend remains valid, I pay attention.
No FOMO. No chasing price.
I wait for price to come to a place where risk is low and probability is high.
4. Entry matters less than the reason behind it
I never enter a trade just because it “looks good.”
Every trade must answer:
- Am I trading with the trend or against it?
- What structure is supporting this idea?
- If I’m wrong, where exactly am I wrong?
My stop loss is always placed where the idea is invalidated, not where it feels comfortable.
I’m willing to take small losses to earn the right to stay in the game.
5. News is a catalyst — not the steering wheel
With XAUUSD, news can accelerate price — but structure still matters.
I follow news to understand:
- When volatility may expand
- When I should be more cautious with position size
But my final decision always comes from the chart.
If structure isn’t clear, I stay out — no matter how “hot” the news is.
Final thoughts
I’m not trying to trade more.
I’m trying to trade more clearly.
XAUUSD is a great market, but it doesn’t reward confusion or lack of discipline. When you have a simple, structured approach that you can repeat, trading stops being gambling — it becomes a process.
If your chart feels crowded right now, maybe it’s time to remove, not add.
📌 If this post helped you see XAUUSD more clearly, feel free to leave a comment or follow me so we can continue discussing simple, practical ways to read the market.

BTC | DailyCRYPTOCAP:BTC — Transitional Phase
BTC is holding above Q-Structure λₛ support.
A ~9.5% further advance is required to confirm the Leading Diagonal as a transitional structure in Intermediate Wave (1), signalling a Primary-degree trend reversal.
Q-Structure λᵣ targets ➤ $100k via Minor Wave 5(near term).
🔖 This outlook is derived from insights within my Quantum Models framework. Within this methodology, Q-Targets represent high-probability scenarios generated by the confluence of equivalence lines. These Quantum Structures also serve as structural anchors, shaping the model's internal geometry and guiding the evolution of alternative paths as price action unfolds.
#BTC #Bitcoin #ElliottWave #QuantumModel #CryptoMarkets
#MarketStructure #TrendReversal

WCT/USDT at Critical Zone – Trend Reversal or Another Leg Down?WCT/USDT on the 2D timeframe remains in a medium- to long-term bearish phase. Price continues to trade below the primary descending trendline originating from the previous distribution top. The overall market structure still shows consistent lower highs and lower lows, indicating that selling pressure remains dominant.
Currently, price is moving sideways below the trendline, signaling a consolidation phase after a strong bearish impulse.
---
Pattern Explanation
The main patterns observed are:
Descending Trendline (Bearish Structure)
The yellow downward-sloping line acts as a dynamic resistance and has rejected price multiple times.
Bearish Continuation Zone
The tight consolidation below the trendline suggests potential:
continuation of the bearish move, or
an accumulation phase before a conditional breakout.
As long as this trendline is not broken with strong confirmation, the primary bias remains bearish.
---
Key Levels
Resistance Zones:
0.096 – 0.107 → nearest resistance / minor supply
0.150 – 0.180 → strong resistance + previous reaction area
0.286 – 0.375 → major supply zone / former distribution area
Support Zones:
0.077 – 0.085 → current support
0.065 – 0.051 → lower demand area / potential capitulation zone
---
Bullish Scenario
The bullish scenario is conditional and only becomes valid if:
1. A strong break and close above the descending trendline occurs
2. Followed by the formation of higher highs and higher lows
If a valid breakout happens, potential upside targets are:
Initial target: 0.107
Continuation: 0.150 – 0.180
Extended target: 0.286
As long as price remains below the trendline, any bullish move should be considered a relief rally, not a full trend reversal.
---
Bearish Scenario
The currently dominant scenario:
Price fails to break the trendline
Rejection occurs around the 0.096 – 0.107 zone
Breakdown below the 0.077 support level
Next downside targets:
0.065
0.051 (major demand and historical low area)
The bearish structure remains valid as long as price stays below the descending trendline.
---
Conclusion
WCT/USDT remains under seller control with a clearly defined downtrend structure. The current price area is a critical zone that will determine whether the market continues its bearish trend or starts forming a medium-term reversal.
No breakout = bearish continuation.
Valid breakout = trend shift confirmation.
Waiting for structural confirmation is strongly advised rather than reacting to price alone.
#wct #wctusdt #cryptocurrency #downtrend #bearishmarket #trendlineanalysis #priceaction #supportandresistance #altcoinanalysis

BTC Is Not Weak — It’s Just Quiet Before the Next Big WaveIf I look at BTCUSDT right now through the lens of someone who has lived through multiple market cycles, what I see is a market that is calm rather than weak.
Recent news hasn’t delivered a major catalyst, and that is actually a positive sign. There is no new macro pressure, no unexpected bad news, and capital is still staying within Bitcoin. In that context, the market naturally chooses accumulation over panic selling.
On the chart, BTC is far from losing control . Price remains above the Ichimoku cloud, and the medium-term bullish structure is still intact. The 88,000 USD zone is acting as a psychological buffer — a level where sellers are losing momentum and buyers are starting to wait patiently.
The current volatility should be seen as a short-term position clean-up, not a reversal signal . The market is digesting the previous rally, quietly rebuilding energy for the next move.
As long as BTC continues to hold this price base, the probability of a retest toward the 94,000 USD zone remains high. This is the kind of market that does not reward impatience, but favors traders who understand that sustainable uptrends always need a pause in between.
