GBPUSD H1 | Bullish Bounce Off Key SupportMomentum: Bullish
Price is currently above the ichimoku cloud.
Buy entry: 1.34851
- Pullback support
- 78.6% Fib retracement
- 100% Fib projection
Stop Loss: 1.34554
- Overlap support
Take Profit: 1.35227
- Swing high resistance
High Risk Investment Warning
Stratos Markets Limited (tradu.com/uk ), Stratos Europe Ltd (tradu.com/eu ):
CFDs are complex instruments and come with a high risk of losing money rapidly due to leverage. 70% of retail investor accounts lose money when trading CFDs with this provider. You should consider whether you understand how CFDs work and whether you can afford to take the high risk of losing your money.
Stratos Global LLC (tradu.com/en ): Losses can exceed deposits.
Please be advised that the information presented on TradingView is provided to Tradu (‘Company’, ‘we’) by a third-party provider (‘TFA Global Pte Ltd’). Please be reminded that you are solely responsible for the trading decisions on your account. Any information and/or content is intended entirely for research, educational and informational purposes only and does not constitute investment or consultation advice or investment strategy. The information is not tailored to the investment needs of any specific person and therefore does not involve a consideration of any of the investment objectives, financial situation or needs of any viewer that may receive it. Past performance is not a reliable indicator of future results. Actual results may differ materially from those anticipated in forward-looking or past performance statements. We assume no liability as to the accuracy or completeness of any of the information and/or content provided herein and the Company cannot be held responsible for any omission, mistake nor for any loss or damage including without limitation to any loss of profit which may arise from reliance on any information supplied by TFA Global Pte Ltd.
Harmonic Patterns

AUDUSD H1 | Bullish Bounce Off Pullback SupportMomentum: Bullish
Price is currently above the ichimoku cloud.
Buy entry: 0.66752
- Pullback support
- 38.2% Fib retracement
- 100% Fib projection
Stop Loss: 0.66607
- Pullback support
-
Take Profit: 0.66963
- Swing high resistance
High Risk Investment Warning
Stratos Markets Limited (tradu.com/uk ), Stratos Europe Ltd (tradu.com/eu ):
CFDs are complex instruments and come with a high risk of losing money rapidly due to leverage. 70% of retail investor accounts lose money when trading CFDs with this provider. You should consider whether you understand how CFDs work and whether you can afford to take the high risk of losing your money.
Stratos Global LLC (tradu.com/en ): Losses can exceed deposits.
Please be advised that the information presented on TradingView is provided to Tradu (‘Company’, ‘we’) by a third-party provider (‘TFA Global Pte Ltd’). Please be reminded that you are solely responsible for the trading decisions on your account. Any information and/or content is intended entirely for research, educational and informational purposes only and does not constitute investment or consultation advice or investment strategy. The information is not tailored to the investment needs of any specific person and therefore does not involve a consideration of any of the investment objectives, financial situation or needs of any viewer that may receive it. Past performance is not a reliable indicator of future results. Actual results may differ materially from those anticipated in forward-looking or past performance statements. We assume no liability as to the accuracy or completeness of any of the information and/or content provided herein and the Company cannot be held responsible for any omission, mistake nor for any loss or damage including without limitation to any loss of profit which may arise from reliance on any information supplied by TFA Global Pte Ltd.

GBPUSD H1 | Bullish Bounce Off Pullback SupportMomentum: Bullish
Price is currently above the ichimoku cloud.
Buy entry: 1.34713
- Pullback support
- 23.6% Fib retracement
Stop Loss: 1.34442
- Pullback support
Take Profit: 1.35162
- Swing high resistance
High Risk Investment Warning
Stratos Markets Limited (tradu.com/uk ), Stratos Europe Ltd (tradu.com/eu ):
CFDs are complex instruments and come with a high risk of losing money rapidly due to leverage. 70% of retail investor accounts lose money when trading CFDs with this provider. You should consider whether you understand how CFDs work and whether you can afford to take the high risk of losing your money.
Stratos Global LLC (tradu.com/en ): Losses can exceed deposits.
Please be advised that the information presented on TradingView is provided to Tradu (‘Company’, ‘we’) by a third-party provider (‘TFA Global Pte Ltd’). Please be reminded that you are solely responsible for the trading decisions on your account. Any information and/or content is intended entirely for research, educational and informational purposes only and does not constitute investment or consultation advice or investment strategy. The information is not tailored to the investment needs of any specific person and therefore does not involve a consideration of any of the investment objectives, financial situation or needs of any viewer that may receive it. Past performance is not a reliable indicator of future results. Actual results may differ materially from those anticipated in forward-looking or past performance statements. We assume no liability as to the accuracy or completeness of any of the information and/or content provided herein and the Company cannot be held responsible for any omission, mistake nor for any loss or damage including without limitation to any loss of profit which may arise from reliance on any information supplied by TFA Global Pte Ltd.

US30 H1 | Bullish Bounce Off Pullback SupportMomentum: Bullish
Price is currently above the ichimoku cloud.
Buy entry: 48,231.75
- Pullback support
- 61.8% Fib retracement
- 100% Fib projection
Stop Loss: 48,105.22
- Swing low support
Take Profit: 48,389.14
- Swing high resistance
High Risk Investment Warning
Stratos Markets Limited (tradu.com/uk ), Stratos Europe Ltd (tradu.com/eu ):
CFDs are complex instruments and come with a high risk of losing money rapidly due to leverage. 70% of retail investor accounts lose money when trading CFDs with this provider. You should consider whether you understand how CFDs work and whether you can afford to take the high risk of losing your money.
Stratos Global LLC (tradu.com/en ): Losses can exceed deposits.
Please be advised that the information presented on TradingView is provided to Tradu (‘Company’, ‘we’) by a third-party provider (‘TFA Global Pte Ltd’). Please be reminded that you are solely responsible for the trading decisions on your account. Any information and/or content is intended entirely for research, educational and informational purposes only and does not constitute investment or consultation advice or investment strategy. The information is not tailored to the investment needs of any specific person and therefore does not involve a consideration of any of the investment objectives, financial situation or needs of any viewer that may receive it. Past performance is not a reliable indicator of future results. Actual results may differ materially from those anticipated in forward-looking or past performance statements. We assume no liability as to the accuracy or completeness of any of the information and/or content provided herein and the Company cannot be held responsible for any omission, mistake nor for any loss or damage including without limitation to any loss of profit which may arise from reliance on any information supplied by TFA Global Pte Ltd.

BTCUSD M30 | Bearish Reaction Off Key ResistanceMomentum: Bearish
Price is currently below the ichimoku cloud.
Sell entry: 87,956.20
- Pullback resistance
- 50% Fib retracement
- 100% Fib projection
- Fair value gap
Stop Loss: 88,716.60
- Swing high resistance
Take Profit: 87,109.63
- Swing low support
High Risk Investment Warning
Stratos Markets Limited (tradu.com/uk ), Stratos Europe Ltd (tradu.com/eu ):
CFDs are complex instruments and come with a high risk of losing money rapidly due to leverage. 70% of retail investor accounts lose money when trading CFDs with this provider. You should consider whether you understand how CFDs work and whether you can afford to take the high risk of losing your money.
Stratos Global LLC (tradu.com/en ): Losses can exceed deposits.
Please be advised that the information presented on TradingView is provided to Tradu (‘Company’, ‘we’) by a third-party provider (‘TFA Global Pte Ltd’). Please be reminded that you are solely responsible for the trading decisions on your account. Any information and/or content is intended entirely for research, educational and informational purposes only and does not constitute investment or consultation advice or investment strategy. The information is not tailored to the investment needs of any specific person and therefore does not involve a consideration of any of the investment objectives, financial situation or needs of any viewer that may receive it. Past performance is not a reliable indicator of future results. Actual results may differ materially from those anticipated in forward-looking or past performance statements. We assume no liability as to the accuracy or completeness of any of the information and/or content provided herein and the Company cannot be held responsible for any omission, mistake nor for any loss or damage including without limitation to any loss of profit which may arise from reliance on any information supplied by TFA Global Pte Ltd.

KRAB - A joke that became a good investmentIm pushing the joke and found something that looks like a rly good investment.
Perfect text book example of accumulation after a downward move (down move not shown on the chart) and a reaccumulation at 0.5 at 11
additional evidences are the pick volume on early 2024 and re accumulation at 11 shown by blue arrows
we are targeting 17 for the next wave up, on 2026 and maybe further up to 21 then
cheers not financial advice

Weekly Forecast: Gold Likely to Move Toward 4500The outlook for XAU/USD (Gold) is currently positive. The price could rise from around 4,295, with potential for movement down to 4,180 if there is a temporary pullback. The focus is on possible further increases towards 4,500, based on current momentum.
The market has been moving upward, showing signs of strength with consistent upward movements. Recently, the price moved out of a high-activity zone, indicating potential for continued growth. This suggests the price may keep pushing higher as the upward trend remains intact.
The gap in price suggests there is room for growth before the market hits the next major level. Price action and trendlines support the idea of the market moving further upward. With the current support level holding and a clear path ahead, there is an opportunity to capture the next phase of the move.
If the price dips, there is a lower level around 4,180 where it could find support and potentially reverse. However, with the trend in favor of higher prices, the market may continue upward towards 4,500.
This setup offers a favorable risk-reward ratio, with potential for significant movement over the next period. It’s important to stay patient and observe how the price moves to adjust your approach accordingly.

WTI – West Texas Intermediate Crude Oil.👋 Hello TradingView Traders!
Hope you’re doing well and trading with clarity and discipline 📊🤝
Today, we’re taking a closer look at WTI – West Texas Intermediate Crude Oil.
🛢️ Symbol Overview
WTI Crude Oil is one of the most actively traded commodities in global markets and is heavily influenced by:
Global supply & demand dynamics 🌍
OPEC decisions 🏭
Macroeconomic and geopolitical factors ⚠️
Because of this, WTI often provides high-quality technical and price action opportunities for traders.
📈📉 Overall Market Structure (Daily)
On the daily timeframe, price is currently trading in a key decision zone:
The broader structure has been bearish
Price is now reacting at a major daily support
At the same time, we are seeing a break of the descending trendline (dynamic resistance)
As a result, bullish and bearish forces are currently balanced ⚖️
🧱 Key Levels & Technical Structure
🔹 Dynamic Resistance (Descending Trendline)
This trendline has capped price for an extended period.
The recent break above it may signal early weakness in selling pressure 📉➡️📈
🔹 Daily Support
The highlighted daily support zone is a critical demand area where price is currently reacting.
Holding above this level could lead to a corrective or reversal move 🟢
🔹 Daily Resistance
If price moves higher, the marked daily resistance zone will act as a key obstacle:
Rejection could resume bearish pressure
A clean breakout would strengthen the bullish case 🚀
🔄 Potential Scenarios (Balanced Outlook)
🟢 Bullish Scenario:
If price holds above daily support and confirms the trendline break with a valid pullback:
Price may advance toward the daily resistance zone
Market structure shifts into a bullish correction 📈
🔴 Bearish Scenario:
If price fails to hold daily support:
A breakdown could trigger continuation of the broader bearish trend
Lower targets become active 📉
➡️ This places WTI at a highly sensitive and decisive technical area.
🧠 Final Summary
✔️ Trendline break → early bullish signal
✔️ Daily support → critical reaction zone
✔️ Overhead resistance → major decision level
At this stage, neither buyers nor sellers have full control, and confirmation will come from how price reacts to these key levels ⚖️📊
⚠️ Disclaimer
This analysis is for educational purposes only and does not constitute financial advice.
Always apply proper risk management, use stop losses, and trade according to your own strategy and risk tolerance ❗🧠
📊 What’s Your View?
💬 Do you expect:
A bullish reaction from daily support? 🟢
Or continuation of the bearish trend? 🔴
Share your thoughts in the comments ✍️
Don’t forget to Like ❤️ and Follow 🌟
Trade safe and stay profitable 🤝📈
🏷️ Tags
#WTI #CrudeOil #OilTrading #TechnicalAnalysis #PriceAction
#SupportResistance #TrendlineBreak #DailyChart #TradingView

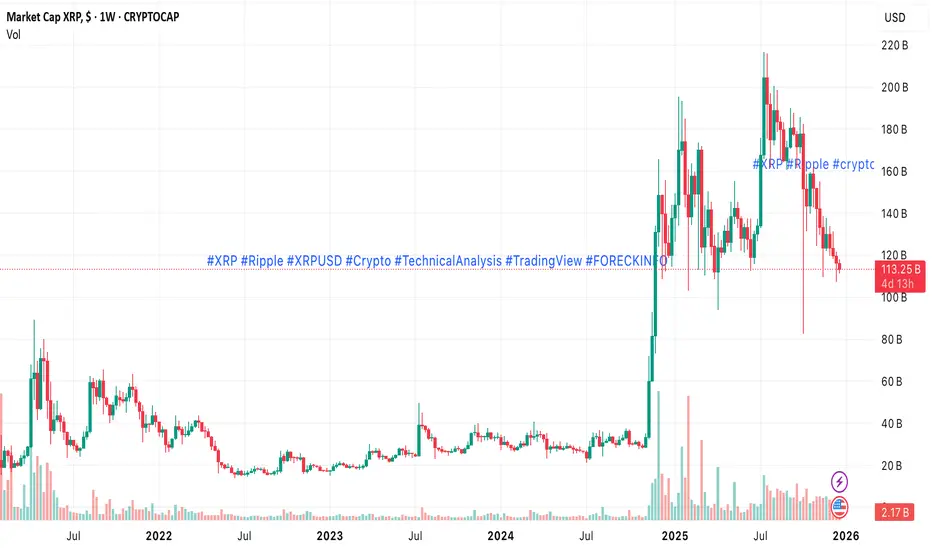
XRP/USD: Bearish Trend Holds, Downside Toward 1.64–1.46 Remains Symbol: XRPUSD
Timeframe: Weekly / Daily
Trend: Medium-term bearish
Structure: Descending channel + double top (W1)
⸻
Market Overview
XRP/USD continues to trade within a medium-term downtrend. Last week’s corrective rebound, driven by expectations of further Fed easing and a Bank of Japan rate hike, stalled near the Bollinger midline at 1.9531 (Murrey ). The failure to reclaim this level triggered a renewed sell-off, keeping bearish continuation as the dominant scenario.
As long as price remains below 2.1484, downside risks prevail.
⸻
Technical Picture
• Price rejected at BB midline (1.9531)
• Descending channel remains intact
• Weekly structure confirms a double top pattern
• Momentum favors sellers
Indicators
• Bollinger Bands: turning down
• MACD: stable below zero
• Stochastic: pointing lower
Bias: Bearish
⸻
Key Levels
Resistance
• 2.1484
• 2.3437
• 2.5390
Support
• 1.6420
• 1.4648
⸻
Trading Scenarios
Primary scenario — bearish continuation
• SELL STOP: 1.8255
• Targets: 1.6420 → 1.4648
• Stop-loss: 1.9520
• Horizon: 5–7 days
Alternative scenario — bullish breakout
• BUY STOP: 2.1485
• Targets: 2.3437 → 2.5390
• Stop-loss: 2.0100
⸻
Conclusion
While XRP/USD trades below 2.1484, any upside remains corrective.
A breakdown toward 1.6420 and 1.4648 remains the preferred path.
Only a confirmed breakout above 2.1484 would invalidate the bearish structure and open room for a deeper recovery.

XAUUSD (Gold) Intraday OutlookXAUUSD (Gold) Intraday Outlook: Bullish Trendline Hold, Pullback Levels to Buy, Targets Toward 4568
Market Structure From the Chart (1H)
Gold is printing a clean bullish sequence (higher highs, higher lows) after breaking out of a long consolidation base. Price is now consolidating above the rising trendline, which suggests a classic continuation pattern (bull flag / ascending channel behavior). As long as this trendline and the first pullback support hold, the path of least resistance remains up.
Key Support And Resistance Levels (From Your Chart)
Resistance (sell pressure / take-profit zones)
4525–4540: Near the most recent swing high area (first reaction zone).
4567–4570: Main upside objective shown on the chart (measured continuation target).
Support (buy-the-dip zones)
4500: Psychological level and intraday pivot.
4479–4481: Major intraday support (confluence with trendline retest behavior).
4443: Bullish invalidation level on the chart (breakdown trigger if lost).
Fibonacci Map (How I Would Anchor It)
If you pull Fibonacci from the last impulsive leg (swing low of the breakout to the recent swing high), the chart’s levels line up well with common retracements:
0.236 retracement aligns around 4480 (high-probability “first dip” support).
0.382–0.5 retracement zone sits around 4455–4435 (deeper pullback buy zone).
A decisive loss of 4443 shifts the intraday bias from continuation to correction.
This is why 4480 and 4443 are the two most important numbers for today’s plan.
EMA + RSI Checklist (Confirmation, Not Prediction)
EMA
In a strong 1H uptrend, price often respects EMA20/EMA50 as dynamic support.
If price is holding above the rising EMA stack (EMA20 above EMA50), dips into those EMAs are typically buyable only when structure stays bullish (no lower-low close).
RSI
Bull continuation usually keeps RSI above 50.
Watch for:
RSI holding 50–55 on pullbacks: confirms strength (dip-buy is valid).
Bearish divergence into 4525–4568: warns that upside may pause; take profit faster or wait for confirmation.
High-Probability Intraday Trading Plans (Based on This Setup)
Plan A: Trendline Pullback Buy (Primary Idea)
Bias: Bullish continuation
Entry zone: 4495 → 4480 (trendline retest + Fib first retrace area)
Invalidation / SL: Below 4443 (structure failure on this chart)
Targets:
TP1: 4525–4540
TP2: 4567–4570
Execution tip: Let price tap the zone, then wait for a 1H bullish close or a clear rejection wick before committing size.
Plan B: Deep Pullback Buy (If Market Sweeps Liquidity)
When it triggers: Price spikes down, cleans stops below 4480, but does not close heavy below 4443.
Entry zone: 4455 → 4435 (Fib 0.382–0.5 region)
SL: Below the pullback base (aggressive traders keep it tight; conservative traders keep it below the next structure shelf).
Targets:
TP1: 4500
TP2: 4525
TP3: 4567
This plan often delivers the best R:R, but only if the reclaim is real (avoid catching a falling knife).
Plan C: Breakdown & Retest Short (Only If Bullish Structure Fails)
Trigger: 1H close below 4443 and failed reclaim.
Entry: Retest 4443–4450 from below (resistance flip).
SL: Back above 4480.
Targets: Next demand pockets toward the prior range area (first stop is usually the nearest swing low; then the bigger base zone).
This is not the primary direction today; it’s the contingency plan if the trendline finally breaks.
Summary Bias For Today
Bullish while above 4479, strongest continuation while holding 4500.
4443 is the key line in the sand. Lose it convincingly and the day turns into a deeper correction scenario.
Upside focus remains 4525 → 4568 as long as trendline structure stays intact.
If you find this intraday roadmap useful, follow the idea so you can get the next update when price reaches 4525 and 4568 (that’s where decision-making matters most).

A good gold trade doesn’t need to be earlyIn my view, a good gold trade doesn’t need to be early.
Gold never lacks opportunities — but the market seriously lacks patience.
Anyone who trades XAUUSD knows:
It loves to sweep SL before the real trend begins
It prefers to retest zones more than once
It creates more fake breaks than my end-of-year resolutions
So entering early isn’t always wrong — it’s just usually unnecessary.
A beautiful trade is not the fastest trade
A beautiful trade is one where you:
Don’t FOMO
Don’t guess
Don’t enter while price is still shaking out stops
Enter when the chart finally starts telling a clear story, even if that story appears a few candles later
Sometimes waiting for 1–2 confirmation candles gives you:
A more confident entry
A safer SL that’s less likely to be hunted
A lighter mindset
And most importantly: placing a trade without feeling like you're gambling
The real story behind a “worth-it” gold entry
Price touches zone once → no rush.
Touches twice → still chill.
Touches the third time + closes a clean rejection candle + structure intact → this is the moment to enter, not early, but comfortable.
3 simple reminders, nothing too philosophical
Being one step late on the chart is better than being one step late in your account
Price touching a zone is just a greeting — confirmation is the real invitation
A good trade is one that doesn’t make you doubt yourself
Wishing you more comfortable, smooth, and effective entries.

the inner circle tradingForeign Exchange and CFD Trading are leveraged products that involve a significant risk of loss. The trader is liable to either a portion, or the entire loss of margin deposit if proper consideration of the risks, as well as fundamentals are not fully considered in trading.
We as a non-dealing desk broker are responsible for providing the tools, instruments and quotes necessary to deal with volatility fluctuations in the global foreign exchange business. We reserve the right to either open, or alternatively decline applications for individual, corporate, partnership or money-manager accounts that we do not consider eligible to operate a leveraged margin account.
We do however, encourage our clients that are intending to trade, to be fully aware of the risks, fundamentals and technicalities associated with being a profitable trader. Appropriate training is necessary to succeed.

$ZEC 12H CHART UPDATE📌 CRYPTOCAP:ZEC is currently forming a harmonic structure, but the setup is NOT complete yet ✅
📌 Price still needs to drop into the strong support zone below. Without touching support, no clean move can start ✅
📌 The most important part is how price reacts at the support zone. It must hold the zone and retest it properly ✅
📌 For price to move up from that support, I want to see some basic confirmations:
– RSI should start moving up from weak levels (no strength = no rally)
– MACD should show momentum shift toward bullish side
– Volume must increase on bullish candles (no volume = fake move)
📌 If support holds and these confirmations appear, then upside targets can open step by step 🔥
300 → 350 → 400 → 500 → 600 → 700+
📌 Final conclusion:
🔴No support touch = wait
🚀Support hold + confirmation = opportunity
#ZEC #Zcash #TradingView #TechnicalAnalysis #CryptoTrading
#RSI #MACD #SupportResistance #PriceAction


Gold Pauses, Not Reverses — Pullback Before the Next ExpansionXAUUSD – 1H KEY POINTS
Technical
Strong impulsive uptrend intact; current move is a healthy pullback.
Price holding above prior breakout → bullish retest structure.
As long as price stays above the support zone ~4,420–4,430, upside remains favored.
Next upside targets sit around 4,525 → 4,570.
Key Levels
Support: 4,420 – 4,430
Resistance / Target: 4,500 → 4,525 → 4,570
Macro / News Impact
USD softness & falling real yields continue to support gold.
Ongoing geopolitical risk + rate-cut expectations keep demand strong.
No risk-off shock → pullbacks are being bought, not sold.
Bias
Buy pullbacks above support.
Trend invalidated only on a clean break below support.

EURUSD-Watchlist Update – Pullback Test in ProgressThe price that had been trapped within the range has finally broken above it, confirmed the breakout, and pulled back twice to the level that was previously resistance and is now support.
We had placed a buy stop to join the trend if the pullback held and the price continued higher. The position is now active, and the price is testing the support once again. Currently, the trade is in a minor loss, and we need to wait to see if buyers step in at the support and take control.
————————
Pouyanfa 🔥 | Risk-aware | Scenario-based.

EURUSD Pullback Is a TrapCURRENT MARKET ANALYSIS – EUR/USD (H1)
Market Structure
EURUSD is maintaining a clear bullish intraday structure. The recent pullback is corrective in nature, forming a higher-low sequence above the key demand area, not a trend reversal.
Price is currently retracing from the short-term high and rebalancing liquidity before the next directional move.
Key Technical Levels
Support Zone: 1.1760 – 1.1770
Immediate Resistance / Target: 1.1800 – 1.1805
Extended Level (Open / Expansion): 1.1818 – 1.1820
The highlighted support zone aligns with:
Previous breakout base
Prior demand reaction
Structure support (HL confirmation)
Price Behavior Insight
Selling pressure is weak and overlapping, not impulsive
Buyers defended the previous pullback aggressively
Current move resembles a bullish flag / continuation pullback
This is typical trend continuation behavior, not distribution.
Probable Scenarios
Primary Scenario (High Probability):
Price holds above 1.1760–1.1770
Shallow pullback completes
Continuation toward 1.1800 → 1.1820
Invalidation Scenario:
Clean break and acceptance below 1.1760
Would signal a deeper correction toward lower demand
Trading Bias
Main Trend: UP
Intraday Bias: Buy pullbacks, avoid chasing highs
Strategy: Wait for confirmation at support before continuation entry
Conclusion
EURUSD is not reversing it is reloading.
As long as the support zone holds, the path of least resistance remains to the upside.

GBP/JPY | Potential for Medium-Term CorrectionGBP/JPY experienced selling pressure for the second consecutive day, trading around 210.50. Despite the correction, the price remains near the 17-year high (211.00) reached last Monday. The market is currently caught in a tug-of-war between the yen, supported by the Bank of Japan's policy stance, and the pound, supported by the Bank of England's cautious stance.
✅ Factors Supporting the Japanese Yen (JPY)
- October BoJ Minutes: The newly released document showed broad agreement among officials to continue raising interest rates if economic forecasts are met.
- 30-Year High: Given that the BoJ just raised interest rates to 0.75% in December and is open to further tightening, the JPY has improved yield appeal.
- Geopolitics: Global uncertainty (Venezuela, Ukraine, the Middle East) continues to fuel safe-haven flows into the yen.
✅ Factors Supporting the British Pound (GBP)
- Hawkish Interest Rate Cut: Although the Bank of England (BoE) cut interest rates to 3.75%, the very tight vote (5-4) suggests the committee is in no rush to ease further.
- Expectation Revision: Investors are now scaling back speculation of aggressive interest rate cuts next year, providing a strong foundation for the GBP.
✅ Technical & Strategy Guide
- Consolidated Sentiment: The current decline is still considered a healthy correction. Strong follow-through selling is needed to confirm that the price has truly peaked in the 211.00 area.
- Thin Volume: Light year-end trading could lead to unexpected volatility or subdued (choppy) price movements.

15M Setup Hit Target — Waiting for Higher Timeframe ConfirmationThe setup mentioned in our analysis 10 hours ago, where we said a position could be taken on the 15-minute timeframe, has now hit its target.
At the moment, there is no suitable entry opportunity, and for a confirmed range breakout, we need a clear and reliable 4-hour candle close.
If any new developments or valid entry triggers appear, I will provide an update.
S&P Entry Trigger Activated — RR1 Reached, RR2 in FocusThe entry trigger we shared on S&P has been activated and has already reached RR 1. According to our analysis, the main target remains RR 2.
At this point, you can reduce risk and move to breakeven, or choose to keep the position open without adjusting risk — it depends on your trading strategy.
If the main target is reached, we’ll update the analysis and start looking for a new entry trigger.

USDCAD-Clean Move Delivered — Waiting for the Next SetupThe setup mentioned in our analysis 18 hours ago, where we highlighted a 15-minute timeframe entry, has successfully hit its target.
After reaching the target, it actually presented a very clean and attractive re-entry opportunity, but unfortunately I wasn’t in front of the screen at that moment and missed it. Hopefully, some of you managed to catch that move.
At this stage, there is no suitable entry opportunity.
If any new structure forms or a valid setup appears, the analysis will be updated and a new entry trigger will be shared.

GOLD: high-level volatility with a rally followed by a pullbackGold traded in a pattern of high-level volatility with a rally followed by a pullback today. Supported by rate cut expectations and geopolitical safe-haven demand, the price was offset by profit-taking triggered by overbought RSI readings and thin pre-Christmas liquidity. It hit an intraday high of 4525.48 before pulling back to around 4468.
Intraday Key Support and Resistance Levels:
Support Levels:
Core support: 4420, a former breakout level turned support, whose validity needs to be confirmed by pullback tests.
Secondary support: 4470–4480, the intraday consolidation platform that serves as a buffer for short-term selling pressure.
Resistance Levels:
Primary resistance: 4500, a psychological round number and a dense zone for profit-taking.
Secondary resistance: 4520, the trend extension target near the intraday high.
Risk Advisory:
1.Amid thin liquidity, price gaps and slippage are likely to occur. It is recommended to reduce position sizes and strictly enforce stop loss orders.
2.A breakdown of the 4420 support level could trigger an accelerated pullback to 4400–4420, requiring timely strategy adjustments.
Trading Strategy:
Buy 4470 - 4480
SL 4450
TP 4500 - 4510 - 4520
Sell 4495 - 4500
SL 4510
TP 4470 - 4460 - 4450
