BTC Playbook: Buy Floors, Fade 104k Until Confirmed__________________________________________________________________________________
Market Overview
__________________________________________________________________________________
Bitcoin faded from 104k and is cycling back into layered demand near 100.4k, with higher timeframes still constructive while intraday pressure and a risk‑off overlay dominate.
Momentum: Range with downside skew after a sharp 104k rejection and tests of 100,409 and the 99k pocket.
Key levels:
- Resistances (HTF): 102,900–103,300; 103,900–104,050; 105,600–106,000
- Supports (HTF): 100,409; 99,490; 98,760–98,944
Volumes: Very high on intraday (30m–2H); normal on 1D.
Multi-timeframe signals: 1D/12H Up; 6H/4H/2H/1H Down. HTF structure stays constructive, but LTF pressure and the risk‑off overlay cap bounces into 104k–106k.
Harvest zones: 100,400 (Cluster A) / 98,800–98,900 (Cluster B) — ideal dip‑buying areas for inverse pyramiding with confirmation.
Risk On / Risk Off Indicator context: Neutral sell bias; it currently contradicts the HTF Up filter, so treat bounces as tactical until it flips.
__________________________________________________________________________________
Trading Playbook
__________________________________________________________________________________
The dominant posture is tactical: buy confirmed dips into floors and fade weak tests of overhead supply while the macro overlay stays risk‑off.
Global bias: Cautious long into floors while HTF trend is Up; invalidate the dip‑buy thesis on sustained closes below 98,760.
Opportunities:
- Buy: Reactive long at 100,409 or 99,490–98,760/98,944 on a ≥2H bullish close; targets 102,000 then 104,045; risk below the engaged floor.
- Breakout: Acceptance above 104,045 with rising volume → add toward 105,600–106,000.
- Tactical sell: Fade 103,900–104,050 or 105,600–106,000 if rejected and Risk On / Risk Off stays neutral‑sell.
Risk zones / invalidations: Loss and acceptance below 99,490 opens 98,760; daily acceptance below 98,760 invalidates dip‑buying until reclaimed. Acceptance above 106,000 invalidates shorts.
Macro catalysts (Twitter, Perplexity, news): Fed liquidity rhetoric turning supportive; CPI/UST auctions can swing risk; geopolitical overhang keeps the risk tone fragile. Strong daily ETF inflows recently help spot demand but need persistence.
Harvest Plan (Inverse Pyramid):
- Palier 1 (12.5%): 100,400 (Cluster A) + reversal ≥2H → entry
- Palier 2 (+12.5%): 96,400–94,400 (-4/-6% below Palier 1) → reinforcement
- TP: 50% at +12–18% from PMP → recycle cash
- Runner: hold if break & hold first R HTF (103,900–104,050)
- Invalidation: < HTF Pivot Low 99,800 or 96h no momentum
- Hedge (1x): Short first R HTF on rejection + bearish trend → neutralize below R
__________________________________________________________________________________
Multi-Timeframe Insights
__________________________________________________________________________________
Overall, HTF remains constructive while LTFs are in a corrective downswing pressing demand steps.
1D/12H: Uptrend filter intact; price rotating back into 100,409 and the 99k ladder; acceptance back above 104,045 would re‑open 105,600–106,000.
6H/4H: Down within HTF Up; clean lower‑highs from 105k with buyers defending 99,490 and the 98,760–98,944 cluster; look for reversal signals there.
2H/1H/30m/15m: Down with very high sell volume; squeezes likely if 100,409 is reclaimed swiftly; failure risks a stop‑run into 99,490 → 98,8k.
Major confluence: Tight demand at 98,760–98,944 aligns with aggregate value; 100,409 is the line‑in‑the‑sand; 104,045 is the primary trigger above.
__________________________________________________________________________________
Macro & On-Chain Drivers
__________________________________________________________________________________
Macro liquidity tone is turning supportive, but near‑term event risk and a risk‑off equity regime keep the overlay defensive.
Macro events: Fed officials flagged reserves nearing “ample” and a technical easing bias; CPI and UST auctions can jolt risk; geopolitics maintains a risk premium.
Bitcoin analysis: Strongest daily US spot ETF net inflows in a month aided spot demand, while a derivatives long flush reset froth; 104k is the overhead decision zone; 100,409 and 99k are key defenses.
On-chain data: Short‑Term Holder stress and seller‑exhaustion reads favor reflex bounces near 100k; structurally, a durable reclaim above prior highs remains unconfirmed.
Expected impact: If ETF flows persist and CPI doesn’t shock, acceptance above 104,045 tilts the path toward 105,600–106,000; if 100,409 fails, a run into 99,490 → 98,8k is likely before stronger dip‑bids.
__________________________________________________________________________________
Key Takeaways
__________________________________________________________________________________
BTC is rotating within a range under 104k, pressing two‑step demand around 100.4k and 99k.
- Trend: Neutral with downside pressure while Risk On / Risk Off stays neutral‑sell.
- Setup: Buy confirmed dips at 100,409 and 99,490–98,760/98,944; add on 104,045 acceptance.
- Macro: Fed liquidity tone helps, but CPI and geopolitics can flip the tape quickly.
Stay patient, define risk at the floors, and let the market hand you the next move rather than forcing one.
Harvest

BTC Rebound Into HTF Supply: Harvest Zones Mapped__________________________________________________________________________________
Market Overview
__________________________________________________________________________________
Bitcoin is rebounding from last week’s drawdown but is pressing directly into stacked higher-timeframe supply. Structure remains mixed: short-term strength versus a 12H downtrend and a neutral-sell macro backdrop.
Momentum: Cautious rebound within a broader mixed trend; rallies face HTF supply near 106,900–107,300.
Key levels:
- Resistances (HTF): 106,900–107,300; 108,700–109,700; 110,400–111,700
- Supports (HTF/LTF): 105,200–105,600 (tactical); 100,100–100,400 (2H/12H floors); 99,150–99,280 (4H/6H cluster)
Volumes: Overall normal to moderate; notable spikes occurred on lower timeframes during the reversal.
Multi-timeframe signals: 1D up, 12H down; 6H/4H/2H down; 1H/30m/15m up. Short-term momentum is improving but runs into HTF pivot-high bands.
Harvest zones: 100,200 (Cluster A) / 99,100–99,300 (Cluster B) — ideal dip-buy zones for inverse pyramiding if momentum confirms.
Risk On / Risk Off Indicator context: NEUTRE VENTE; it tempers the rebound and argues for selectivity and confirmation before longs.
__________________________________________________________________________________
Trading Playbook
__________________________________________________________________________________
The dominant context is a corrective rebound into resistance; adopt a patient, confirmation-first stance.
Global bias: Neutral sell while below 106,900–107,300; invalidation if price reclaims and holds above 107,300 on a 4H–1D basis.
Opportunities:
- Buy-the-dip: 100,100–100,400 with ≥2H bullish reversal; scale only on improving 12H momentum.
- Breakout buy: 4H close and retest-hold above 107,300 opens 108,700–109,700.
- Tactical sell: Fade 106,900–107,300 rejection (2H–4H confirmation), targeting 105,600 then 104,800–105,000.
Risk zones / invalidations:
- Break below 100,100 would invalidate the shallow-dip long and open a test of ~99,200.
- Sustained closes below ~99,100 risk a larger leg down and shift bias bearish.
Macro catalysts (Twitter, Perplexity, news):
- US CPI print and UST 10Y/30Y auctions may move yields and crypto liquidity.
- Government shutdown resolution headlines improved risk appetite, but durability is unproven.
- Fed cut 25bp with QT set to end Dec 1; guidance remains cautious.
Harvest Plan (Inverse Pyramid):
- Palier 1 (12.5%): 100,200 (Cluster A) + reversal ≥2H → entry
- Palier 2 (+12.5%): 94,200–96,200 (-6%/-4% below Palier 1)
- TP: 50% at +12–18% from PMP → recycle cash
- Runner: hold if break & hold first R HTF (106,900–107,300)
- Invalidation: < HTF Pivot Low (not provided) or 96h no momentum
- Hedge (1x): Short first R HTF on rejection + bearish trend → neutralize below R
__________________________________________________________________________________
Multi-Timeframe Insights
__________________________________________________________________________________
Higher timeframes are mixed but lean down on 12H, while intraday frames have turned up into overhead supply.
1D: Uptrend attempt, but price is still below key pivot-high bands; needs a clean reclaim above 107,300 to unlock higher liquidity.
12H/6H/4H/2H: Down or corrective; rallies into 106,900–107,300 and 108,700–109,700 require proof. 100,100–100,400 is the prime reaction zone; 99,150–99,280 is the deeper defense.
1H/30m/15m: Up and constructive, forming higher lows into resistance; best risk-reward comes from confirmed dips, not late chases into supply.
Major confluence: Tight HTF demand clusters at 100–99k align with the neutral-sell macro regime, reinforcing patience and precision.
__________________________________________________________________________________
Macro & On-Chain Drivers
__________________________________________________________________________________
Macro is balanced-to-cautious and can swing intraday liquidity, while on-chain remains defensive.
Macro events: CPI and UST auctions are near-term volatility catalysts; shutdown resolution headlines boosted risk appetite; the Fed’s 25bp cut with QT ending Dec 1 keeps policy in a “modestly easier but cautious” lane.
Bitcoin analysis: Reclaimed above 105k with key resistance 110–111k; largest overhead liquidity at 112–117k leaves squeeze potential if reclaimed; below, the CME gap near 104,160 is a magnet on weakness.
On-chain data: Price below STH cost basis with continued LTH distribution and defensive options skew — a fragile equilibrium needing a firm reclaim above 112–113k for validation.
Expected impact: Until 107,300+ is reclaimed, macro/on-chain caution aligns with a conservative, buy-the-dip-or-breakout approach; upside fuel exists above 110–111k if catalysts cooperate.
__________________________________________________________________________________
Key Takeaways
__________________________________________________________________________________
BTC is attempting a rebound into heavy resistance with a neutral-sell macro tone.
- Trend: Neutral with a bearish lean on 12H; short-term uptrends are pressing into HTF supply.
- Best setup: Confirmed dip-buys at 100,100–100,400, or a 4H reclaim/hold above 107,300 for a squeeze toward 108,700–109,700.
- Macro factor: CPI and UST auctions may drive liquidity and mark-to-market risk.
Stay disciplined: wait for the signal at the floors or the clean reclaim above resistance — don’t get caught mid-raid in the fog.

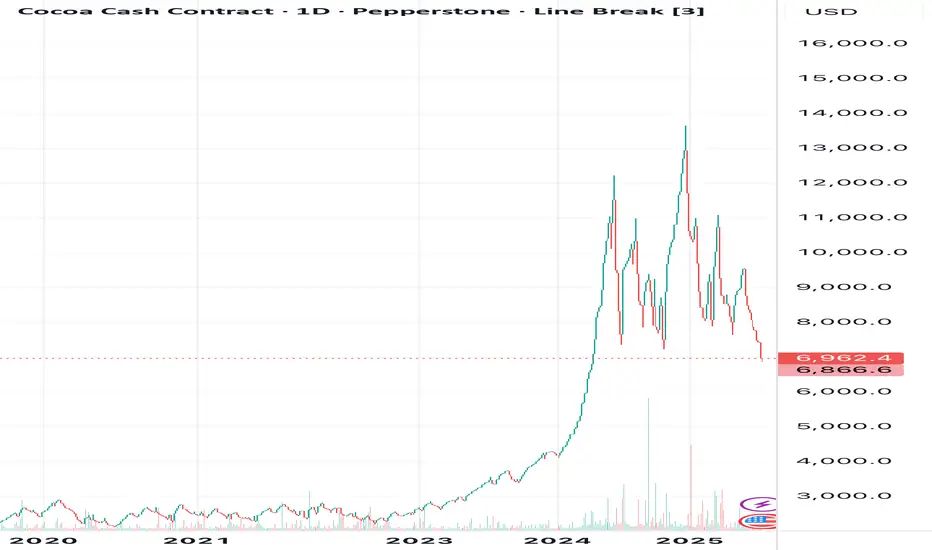
Over optimism with Cocoa harvest?Cocoa pods usually take 5–7 months to mature. Over the past six months, conditions have been relatively dry, yet some cocoa-related news seems to overlook this factor and overlook the recent weeks rain. I’m closely watching how this will affect the upcoming harvest. In my view, current price levels don’t reflect the impact of these conditions and due to thet, giving a bullish signal.
2024/2025 Mid-harvest estimates were too optimistic, as an example in Ivory Coast +9% compared to the actual. The key question is whether this pattern of over-optimism is repeating.
Harvest Farm: The Opportunity You Can’t Miss!Harvest Farm currently has a market cap of just 30M and an extremely limited token supply:
Circulating Supply: 672,183
Total Supply: 690,420
No other token in the market offers this level of scarcity! While other projects have billions of tokens in circulation, FARM is a liquidity-focused DEFI with solid fundamentals that set it apart.
Don’t ignore the facts: with this structure and limited supply, FARM has the potential to easily hit $1 billion market cap, meaning a 1000x or more return on your investment!
This is your chance to buy while tokens are still available. Don’t wait until it’s too late. Purchase now while it’s affordable and witness the power of a truly unique crypto project.
Scarcity is real, and the growth potential is massive. FARM is ready to take off! 🚀 BINANCE:BTCUSD COINBASE:ETHUSD COINBASE:BTCUSD

Demystifying Corn Demand, Supply, and SeasonalityCorn is a versatile crop. It is used in a variety of ways. Corn is a major source of food for humans and animals. It is also an input in industrial products, such as ethanol and plastics.
According to the FAO, in the past year, over 1.1 billion tons of corn was produced worldwide. Gross production value stood at $192 billion, second only to sugarcane (1.8B tons) by volumes and to rice production ($332B) by value.
Previously , we highlighted that a bumper US harvest is expected to send corn prices tumbling. This paper is a primer on Corn. It describes demand and supply dynamics and delves into the usage of the crop, its price behaviour and seasonality, among others.
Corn is an integral part of human diet. It is consumed both as staple food and in processed products. It is also an important animal feed source.
Corn is used in the production of ethanol fuel, plastics, adhesives, and pharmaceutical products. It is also a primary ingredient in alcoholic beverages.
SEASONALITY IN CORN PRICES
The world’s largest corn producer is the US, representing 32% of production, followed by China with 23%. In October, harvest season in the US overlaps that in China, pushing corn prices to their lowest during the year.
Based on data observed over the last 17-years, the seasonal impact of harvest in the US and Chinese on corn prices is clear.
Corn price pop through the first half of the year and then plunge through Q3 until start of Q4 when the crops in the US, China, and Brazil commence harvesting.
Based on front-month corn futures, the average prices of corn have ranged between 200 USc/bushel to 800 USc/bushel.
Over the last 17-years, with the exceptions of six years (2008, 2010, 2012, 2013, 2021 and 2022), Corn prices tend to be stable through the year underpinned by stable demand and robust steady supply.
However, external shocks such as the global financial crisis, pandemic, and the adverse weather conditions cause outsized impact leading to large price volatility.
Based on CME front month corn futures prices, the heat map below shows an upward trend in corn prices from December until May which is the period immediately after US and China harvesting seasons. This phase also represents the corn planting season.
As harvesting begins, corn prices tend to plunge from June until September before starting to recover. On average, based on the analysis into corn prices during the last 17 years, February, October, December, and April are months when corn prices turn bullish. While corn prices are most bearish during the months of June, July, and March.
As corn is a hard crop which can grow in various climatic conditions, most countries have ample domestic production to match their needs with few relying on imports. Consequently, marginal demand from importers can have an outsized impact on prices.
China is the largest importer despite huge domestic production. Other major importers include Brazil, Mexico, North Africa, European Union, Japan, South Korea, and Vietnam.
WHAT DRIVES CORN DEMAND?
Demand for corn is chiefly from animal feed followed by food and industrial use. Corn’s high protein and carbohydrate content makes it suitable animal feed for cattle, pigs, and chickens.
Unsurprisingly, the US, representing 26% of global consumption, and China, representing 25% of global consumption, are also the largest consumers of corn due to their large livestock populations. The quantity of corn used for feed has remained largely unchanged ~5 billion bushels, since the late 2000’s.
Another major demand driver is Ethanol production. Ethanol has many industrial uses, the foremost of which is gasoline blending. Ethanol complements gasoline as they are mixed to create a cleaner burning and higher performing transportation fuel. The demand for corn-ethanol mirrors gasoline demand.
This year, the IEA expects 2% higher demand for Crude Oil and its by-products. Consequently, the USDA expects ethanol production to rise by the same margin.
Corn supply used for Ethanol production rose sharply in the late 2000’s but has since plateaued around 40%. At the same time, share of corn consumption for feed declined from 60% to 40%. This was accommodated through higher corn production.
Although not as significant as feed and ethanol, demand for human consumption of corn is another major contributor. Humans consume corn directly as cereal and in its processed forms. Corn can be processed into multiple by-products including Corn Flour, Corn Starch, Corn Syrup, Corn Oil, and Dextrose. Corn is present in most foods consumed by humans in one form or another.
Corn flour like wheat flour is used for cooking and baking. Corn Starch is used as a thickening agent and binder for food and pharmaceutical production. Corn Syrup (also high-fructose corn syrup) is a cheap and effective sweetener created from corn starch used in the production of processed food as well as beverages such as Coca Cola. Dextrose is a sugar substitute used as an artificial sweetener and preservative.
CORN INVENTORIES ENSURE SUPPLY YEAR ROUND
Although corn supply is cyclical based on harvest levels, demand remains strong year-round. Corn inventories play a huge role in ensuring availability even months after the harvest.
Excess corn that is not consumed in the year is carried over to the next to ensure that a baseline supply is always available. These carryover stocks are managed carefully by the USDA using regular demand and supply estimates that it publishes in a monthly WASDE report. Changes in carryover stock mirror supply-demand trends.
The USDA generally maintains carryover stocks between 1-2 billion bushels. Last year, the US ended the year with 1.2 billion bushels of corn, sharply lower from the 1.9 billion bushels in 2020-21.
However, a bumper harvest this year signals that carryover stocks from the current harvest season and marketing year are expected to surge 56% to 2.2 billion bushels.
CORN SUPPLY, PRODUCTION, DEMAND AND PRICES IN 2023
Corn prices in 2023 have broken their seasonal trend with bumper harvest expected.
In their general seasonal trend, as seen over the past 15 years, corn prices rise during the first half of the year as supplies from the previous year’s harvest start to get depleted. Prices fall sharply following the start of harvest season.
However, corn’s price since the start of 2023 shows a divergence from this seasonal trend. Prices are sharply (-12%) lower YTD. This is due to strong planting in the US as well as weak import demand.
USDA expects a record US corn harvest of 15.3 billion bushels this year. This is expected to lead to the highest levels of carryover stock since 2016-17. China’s imports and domestic production is expected to rebound sharply but is largely expected to be compensated for by huge carryover stocks in Brazil.
Brazil is expected to be the largest corn exporter followed by the US. As such, harvests in both countries should be closely watched to identify shifts in projections. In case harvest in either country is lower than expected, it would not be able to match import demand from China which would lead to higher prices.
Overall, USDA expects 27% lower average price for corn in 2023 at USc 480/bushel. This will lead to far higher global trade and consequently higher trading volumes in Corn futures.
USDA’s WASDE REPORT IS AN IMPORANT RESOURCE FOR CORN TRADERS
As stated, the USDA’s WASDE report is a critically important resource for investors. Specifically, the May WASDE report is vital for Corn as this is the start of the planting season and estimates in this report form the basis for the next marketing year’s outlook for major crops such as Wheat, Corn, and Soybeans.
WASDE includes an outlook summary for each crop as well as statistics measuring the estimated demand, supply, exports, and carryover stocks for major countries as well as different regions within the US .
The 2023 May WASDE report showed expectations of record global corn production as well as consumption. However, consumption is expected to lag production leading to larger ending stocks compared to last year. With higher ending stocks, supply of corn is expected to remain stable year-round. This is bearish for corn prices.
Understanding the supply-demand characteristics in the WASDE report can equip investors with a long-term price outlook. Still, it is equally important to keep track of the market on an ongoing basis due to the myriad of factors affecting price as highlighted above. A summary of these is also given below.
SIX KEY TAKEAWAYS
In conclusion, the following key takeaways summarise this primer:
1. Corn is a versatile crop. It is a major source of food for humans and animals.
2. Gross production value of corn stood at $192 billion, second only to sugarcane (1.8B tons) by volumes and to rice production ($332B) by value.
3. US and China are the world's largest corn producers and consumers, representing over half of global corn production & consumption.
4. Corn prices are heavily influenced by the harvest season in US and China which overlaps between September and October.
5. Major demand sources for corn are animal feed, industrial use (especially ethanol production), and human consumption .
6. May WASDE report showed expectations of record production and consumption of corn and higher ending stocks, leading to lower prices.
MARKET DATA
CME Real-time Market Data helps identify trading set-ups and express market views better. If you have futures in your trading portfolio, you can check out on CME Group data plans available that suit your trading needs www.tradingview.com
DISCLAIMER
This case study is for educational purposes only and does not constitute investment recommendations or advice. Nor are they used to promote any specific products, or services.
Trading or investment ideas cited here are for illustration only, as an integral part of a case study to demonstrate the fundamental concepts in risk management or trading under the market scenarios being discussed. Please read the FULL DISCLAIMER the link to which is provided in our profile description.

Corn Prices Fizzle on Bumper HarvestCorn prices have fallen 14% since the start of 2023. The latest USDA report points to further downside. Corn prices are expected to fizzle with expectations of a bumper harvest combined with tepid demand.
The USDA expects a record harvest of 15.27 billion bushels. The 2023/24 forecasts signal rising corn supply boosting ending stocks to their highest level since 2016/17.
To hedge against falling corn price, this case study proposes a short position using CME Corn Futures (ZCN2023) expiring in July with an entry of 586.25 and a target of 433.25, which is hedged by a stop loss at 654.25, is likely to yield a reward-to-risk ratio of 2.25x.
RECORD CORN HARVEST IS ANTICIPATED RESULTING IN SOARING ENDING STOCKS
WASDE, short for World Agricultural Supply and Demand Estimates, is a monthly report released by the US Department of Agriculture (“USDA”) that tracks the supply and demand for various agricultural commodities.
In the latest WASDE report, released on May 12th, USDA expects a record 15.3 billion bushels of corn to be harvested in the US this year.
The US is the largest producer of corn, representing 32% of total global production. Global corn production is expected to rise 6% YoY in 2023-24.
While production is robust, demand and consumption are not expected to grow as fast. Global demand is expected to rise 3.7% with US consumption expected to climb 3.4%. This will result in an oversupply of corn with soaring inventory levels (i.e., Ending stocks).
Ending stocks represent the supply of corn that is carried over to the next year. They are expected to rise 56% YoY to 2.2 billion bushels, the highest level since 2016-17. This leaves plenty of supply to accommodate any demand expansion.
A bumper harvest in October is expected to cause an oversupply pushing corn prices lower.
Despite the recent decline in corn prices, they remain significantly higher than pre-pandemic levels. With ending stocks now expected to reach pre-pandemic levels, prices will likely follow.
WEATHER MAY UPSET BUMPER HARVEST EXPECTATIONS
The WASDE estimate assumes stable weather conditions as well as demand assumptions regarding China.
Weather conditions play a huge role in final harvested yield. In the current year, drought conditions & intense heat in Argentina led to lower crop yields. With extreme weather events rising globally, it is possible that unfavorable weather may reduce the final US corn output.
China is the largest consumer of corn. With hopes of strong economic recovery still simmering, demand in China may spike higher than USDA expectations.
If supply fails or demand spikes, Corn prices may remain steady or even rise.
Asset Managers and Options Markets are positioning for Corn price to plunge
CFTC’s Commitment of Traders Report shows that asset managers have more than doubled their net short positioning in Corn futures over the last twelve (12) weeks.
Other reportable traders have reduced their net long positioning by almost 50% in the same period. Both indicate rising bearishness about corn prices.
Similar sentiment is reflected in the options market. Although June and July contracts have Put/Call ratio of ~0.85 (more calls than puts), this is before the bumper harvest is expected (August-October). The September and December contracts which expire after the harvest have a Put/Call ratio of ~1.2.
The futures forward curve, which is in backwardation, also shows expectations for prices to drop following the harvest.
TRADE SETUP
Each lot of CME Corn Futures provides exposure to 5,000 bushels of corn. A short position in CME Corn Futures expiring in July (ZCN2023) with an entry of 586.25 and a target of 433.25, which is hedged by a stop loss at 654.25, is likely to yield a reward-to-risk ratio of 2.25x.
• Entry: 586.25 ¢/bushel
• Target: 433.25 ¢/bushel
• Stop: 654.25 ¢/bushel
• Profit at Target: USD 7,650
• Loss at Stop: USD 3,400
• Reward-to-risk: 2.25x
MARKET DATA
CME Real-time Market Data helps identify trading set-ups and express market views better. If you have futures in your trading portfolio, you can check out on CME Group data plans available that suit your trading needs www.tradingview.com
DISCLAIMER
This case study is for educational purposes only and does not constitute investment recommendations or advice. Nor are they used to promote any specific products, or services.
Trading or investment ideas cited here are for illustration only, as an integral part of a case study to demonstrate the fundamental concepts in risk management or trading under the market scenarios being discussed. Please read the FULL DISCLAIMER the link to which is provided in our profile description.

Adam/Eve Reversal Pattern IdeaFARM/BTC may be forming an adam/eve reversal pattern. It has a long way to go before confirming that and could head down further before turning up. OBV has been rising throughout its downtrend, and RSI has done the same - recently making a new low above 30, which is another indication of a possible reversal.

Potential for Inverted HSQuick 3 daily chart on FARM/BTC pairing:
- RSI and OBV have been moving up as Harvest Finance moves down vs. Bitcoin.
- Pattern confirmation would be a close and hold above the yellow neckline

Confirmed Inverse Head/Shoulders on DailySuper quick post - FARM has a confirmed inverted HS on the daily chart. Targets on the chart, fails if we lose the neckline - halfway point to TP 1 lines up exactly with the 200 day EMA, which will likely act as a pit-stop as it begins moving up.
Related longer-term bullish FARM chart below:

FARM Wedge and W Pattern TargetsA ton of different alts making the same patterns.
Smaller wedge breakout is headed towards the 200 day EMA (also halfway point towards TP 1) and then TP 1 and then 2.
Smaller wedge reaches all its targets and remains above middle of W pattern, W pattern / double-bottom recovery begins and heads towards its TP 1 and 2 (with its halfway point to TP 1 equal to smaller wedge TP 2)
Longer-term wedge success likely hinged upon all of the above succeeding, while DXY must not turn up quickly and strongly from where it is now (needs to continue moving down below 100, or hang out b/w 101-103 for a good while prior to moving up). Also be wary of Bitcoin Dominance, which looks bullish atm. If conditions are met, long-term target looks to be a slightly lower high double-top, for now.
See related ideas in the links below, again many alts are making nearly identical recoveries along w/ Bitcoin.

Double Bottom following Falling Wedge BreakFARM has a couple of bullish signs here. First we broke out of a falling wedge a good while back, and then returned to the same area of lows starting what could be the beginning of a double bottom.
For this to play out, first we need to get back above our most recent highs around ~$60. Should that occur, we could easily see ~90-120, and it's possible the falling wedge break could take us back towards highs near the top of our falling wedge.
Previous idea linked below.

Corn Shortage! Blah Blah BlahThis week has brought about news on the projected corn yields dropping marginally, which in turn, is pushing this beast into higher territory. As we check out the chart we can see we have a significant golden pocket that will act as the Berlin Wall for corn. Prices below the golden pocket will act as East Berlin, controlled by the soviets during the Cold War. Trapped in a descending trend. If corn manages to push past the golden pocket + trend line resistance, corn will now be on the west side of the Berlin Wall. Free to explode into the June highs of $7.5.
In this analogy, I personally think that the soviets will maintain control and rule over corn until harvest is over. Corn harvest has started in the south and will continue into Nov. As we harvest we will have more corn in the bins and ready to use. Which will lead to lower prices IMO. Simple supply and demand.
Based off of the chart technicals, I am even more confident in saying that corn will be rejected because of where the GP and trend resistance lays. Once price reaches those levels I am expecting to see a bearish divergence on all three oscillators, and then I will go short big time. This could be a multi-month trade. But as always take profits on your way at key targets.
Major short target: $5.70-$5.30

Inverted head and shoulders on farm coinLow mc and very very low max supply of 490k due to some token burns I see this coin x20 from here and trading at 5k a coin and 1k coin within months

Now the time to buy GRWG is still showing continue growth, its a key business for urbanisation and lowing carbon emsissions
after a huge sell off I see a slight uptrend performing better than the nasdaq 1 Week +10%
already earning profits and rising margins

FARM / BTC Almost Ready for a MoveFARM is still in the negative on its all-time chart. It has been making significant strides after a relatively quiet first year or so. Added to Coinbase, Binance, staking added, staking added via Coinbase wallet, etc. These things occuring after breaching its falling wedge on the daily and touching the bottom of its last major pivot area.
May double bottom here first, but anywhere in this green box seems like a good entry, especially if we get back in the the bright green box.
Min target on the chart - TP 1 at the measured yellow vertical and horizontal lines, TP 2 not on the chart, but would be an equal move up (or half of the length of TP 1 for a more conservative 2nd target)
Failure if we get below the green box and back below the wedge.

Ready to burst past $350: fully primed with bullish divergenceFarm's ready to go any day now. This coiled up monster is ticking. I believe this is the last stop in this channel as the bullish RSI divergence has gotten too strong and the bollinger bands have constricted even more. When a crypto consolidates this long, with as low of supply as Farm does (only about 600K tokens), and more than $420M value locked, the breakout is obscene.
Looking at the order book on exchanges, there are large sell orders at 400, 500, 600, 700 -- so it's clear some people know what's coming as well.

Harvest Finance is at most 3 days away from a break to $400Technicals:
- Bullish divergence in RSI
- Oscillator has outpaced the price signaling buy pressure building up and getting accumulated heavily here
- Indicators have flipped bullish
Fundamentals:
- Undervalued based on total value locked. It's trading at just 0.25 fully diluted / TVL ratio.
- Lowest market cap on Coinbase (just $120M fully diluted)
I think this is going to burst to at least $400 any day now.

FARM - CHAD COINSomething I would like to bring to your attention is the " Harvest Finance Project " Although might seem like a meme coin, with a large TVL, large team. It was able to survive all major dumps and as well hack attacks.
This coin did break down in the last dump and broke the Triangle down. However, now that the market is recovering, we can see good gain and seems like each time this coin drops below 70$ it eventually pumps hard to 200 plus. Well, I'm not saying it will drop again it is possible.
We now see another Moving Average "200" forming and it is holding/having a bounce off it.
What I can tell you right now is that FARM will be $400 and has all the reasons to hit the 1,000 dollar level.
I will post updates and reasoning for each TA I do.
Smogster...

Sell opportunity on GOLD/XAUUSDAs we can see gold has been on a downtrend for the longest time, we broke the region that we currently on but price came back into a buying movement.
However price failed to establish itself above the 1920 region, and for that reason I think that the presence of buyers in the GOLD market is weak, expecting sells to the downside

Sell opportunity on USDJPYWe see from the previous 2 touches on this zone that the buying pressure was no longer as strong as it used to be
The most recent touch is a failed buy attempt, before price shot to the downside overcoming the zone
Expecting price to continue falling

Sell opportunity on NAS100NAS100 has tested this area multiple times and for some time this area has been an area of buy liquidity
It now seems that the buy liquidity is exhausted, anticipating some good sells going to the downside
Price failed to return and establish itself above the zone in its recent movement, so it shows that price has a higher chance of not returning to its buy movements, making it a high probability sell setup

Harvest Technology Group: HTG.AXWatchlist
Trading above 21EMA
Steady uptrend since the start of 2020
Price reaching an area of resistance
Watch if price can break through the 29c level

Wheat market is now at the weakest stage. Time to short.We are long the PUT options since 535 - we wanted to limit our risk. Now it is safe to short the futures, as the market is very weak technically and fundamentally. Sell on a CLOSE below 492.25, stop loss on a CLOSE above 507. 435 is the price target.
I have been travelling around the wheat region in Russia last week - observing the crops, talking to farmers. Planted area this year is very large and most of the crops survived and are looking healthy. Weather conditions are excellent. Prices as low as 416 and 381 could be reached if we see our preliminary target reached before August 31.
*Please remember that futures trading involves a substantial risk of loss and is not suitable for all investors.
