GOLD (XAU/USD): Bullish Continuation ConfirmedI see a clear confirmed bullish continuation pattern on 📈Gold.
The price formed a significant inverted head and shoulders pattern on a 4-hour chart and subsequently breached its neckline earlier today.
A bullish movement is now anticipated, with a target of at least 4460.
Head and Shoulders
Possible pattern of head and shoulders From my own analysis we might witness a possible head and shoulders pattern...might be able to see daily correct candle sticks for this upcoming week but not for long....then we will be seeing that bullish engulfing candle stick on daily chart for possible sells
....I blv in that
GOLD (XAUUSD): Bullish Reversal Confirmed?!
GOLD formed an inverted head & shoulders pattern
on a 4H time frame after a test of a strong intraday/daily support.
The price successfully violated a neckline of the pattern
this morning and closed above that.
With a high probability, the price will continue rising
and reach 4500 level soon.
❤️Please, support my work with like, thank you!❤️
I am part of Trade Nation's Influencer program and receive a monthly fee for using their TradingView charts in my analysis.
GOLD - HTF Continuation w/ LTF Head & Shoulders ConfluenceGold recently confirmed a bullish trend after breaking and closing above its previous structure high. That move created a new extension, which tells us the market is positioned higher and should eventually look for another extension following a pullback.
That pullback is exactly what we’ve seen. Price retraced into previous structure resistance, which has now flipped into structure support—a logical area to watch for bullish continuation.
Dropping down to the 4-hour chart, price shows signs of exhaustion via the development of a potential head and shoulders pattern. At the moment, the pattern is not valid until price breaks and closes above the neckline.
But this can be a good excuse as a entry reason for the bigger bullish continuation play.
If you have any questions or comments please leave them below & I wish you guys a GREAT & SAFE 1st week of trading.
Akil
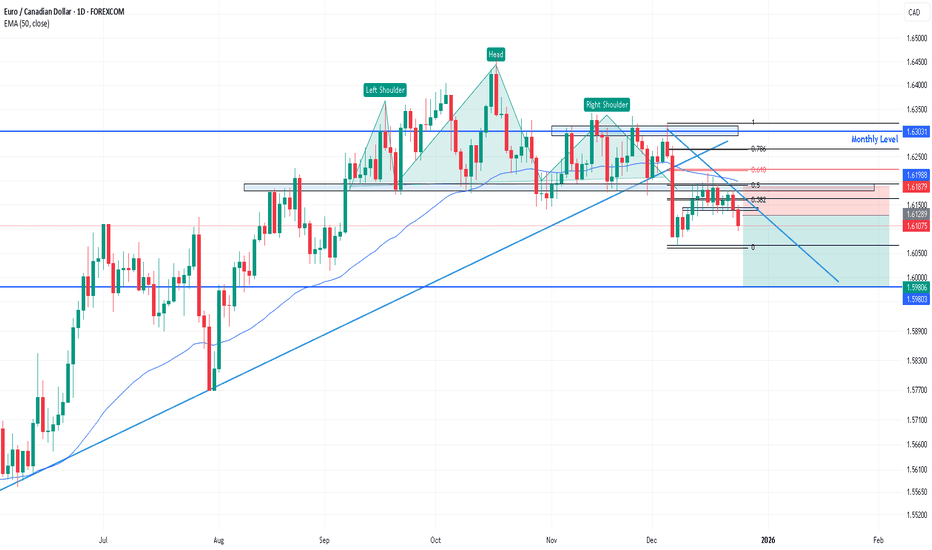
EURCADMonthly:
Price is currently at a key monthly level formed in July 2009, where a strong reversal previously occurred. However, this level is very old, and there has been no recent price reaction. Because of the lack of fresh confirmation, it is uncertain whether price will react again at this level. Therefore, we move to the lower timeframe (weekly) to look for any signs of reaction.
Weekly:
Price formed a false breakout above the monthly level, indicating a lack of buyers. After that, price created a lower low, followed by a lower high and another lower low, confirming a trend change from an uptrend to a downtrend. A trendline break further supports the bearish trend.
Daily :
Downtrend Confirmation:
Price formed a head and shoulders pattern, along with a triple top on the right shoulder. The neckline break, confirmed by a strong bearish momentum candle, validates the continuation of the downtrend.
Pullback Zone:
Price pulled back to the neckline area, aligning with the Fibonacci 0.5–0.618 retracement zone , 50 EMA , and showing multiple candle reactions.
Entry Consideration:
Due to strong bearish momentum on the daily timeframe, entering immediately was not ideal because the stop loss would be too far. The best approach was to wait for a pullback and confirm its completion on the 4-hour timeframe.
4-Hour Timeframe:
Price formed a channel pattern during the pullback. A break of the channel, followed by a lower low, confirmed that the pullback was complete and the downtrend was likely to continue, providing a valid trade entry.
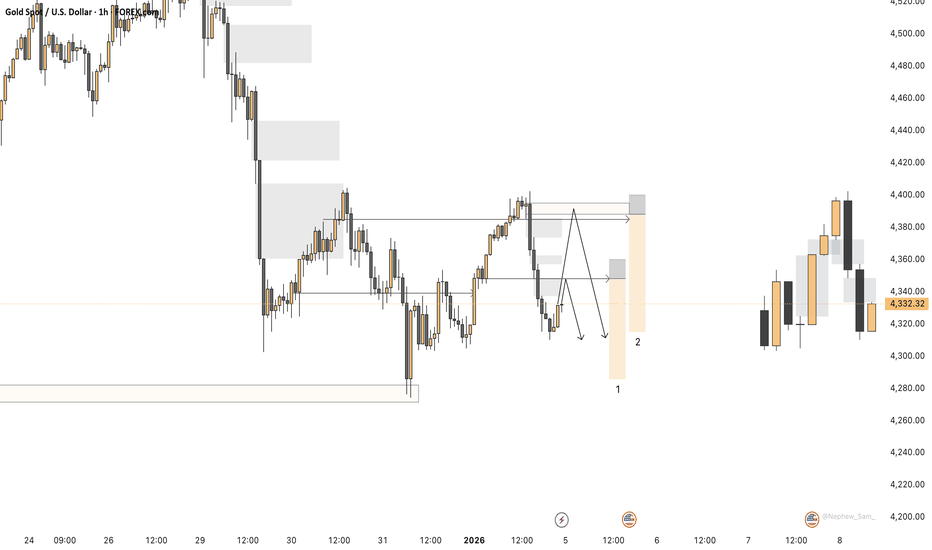
XAUUSD Short Setup Based on Key LevelsI identified an A key level on the daily timeframe where the price strongly rejected and closed below it. This reaction signalled bearish intent, establishing a sell bias. With that higher-timeframe context in mind, I began looking for sell opportunities.
On the 4-hour timeframe, price formed a QMKL (Quasimodo Key Level) , structurally this is similar to an inverse head-and-shoulders pattern . This alignment with the daily bias further increased confidence in a potential short setup.
For execution, I refined entries on the lower timeframe using a supply zone as the primary entry area. This supply zone remains valid as long as the SBR (support-turned-resistance) key level, marked on the chart as (1), has already been mitigated.
If the SBR level remains unmitigated, then it becomes the preferred entry instead of the supply zone . The reasoning is simple: an unmitigated key level acts as a liquidity magnet, making it a higher-probability reaction area.
Xauusd -- Settling towards strong ResistanceXAUSUD -- Strong resistance toward 4520-4560 level. where price corrected 6% from these levels.
Expecting .. price to reach these levels.
1. Either consolidate at these levels and raise high or fall.
2. or Breakout these levels, and break previous high and correct for some time and raise high or fall.
3. or Breakout these levels strongly and either raise high or fall
Watching closely these 4520-4560 levels and waiting for Macro news on 09-Jan-2026 and rate cut on 29-Jan-2026 ... to decide further move..
INTRADAY BTC LONGThis is an intraday trade. BTC is making a Inverted HnS in 15 min time frame. As you can see on the charts the neckline has been broken hence entry can be made here or dips with SL of right shoulder low.
SL- 92000
Target- 93000, 93300.
Disclaimer- This is just for educational purpose.
JAI SHREE RAM
Gold Analysis (1H Timeframe)Gold is currently in a short-term recovery phase following a sharp sell-off. Price has reclaimed the moving average and is now testing a major horizontal resistance zone around 4400–4410.
This area represents a high-probability decision zone.
Key observations:
• V-shaped recovery after impulsive drop
• Price above the moving average
• Direct interaction with a key resistance level
Key Levels
• Major Support:
4320 – 4340
• Immediate Resistance:
4400 – 4420
• Next Major Resistance:
4540 – 4550
Bullish Scenario (Continuation)
If price:
• Holds above 4400
• Shows acceptance with strong hourly closes
Then bullish continuation becomes the dominant scenario.
Upside Targets:
4420 → 4480 → 4540
Bullish Invalidation:
Hourly close below 4360
Bearish Scenario (Rejection)
If price:
• Fails to break and hold above 4400
• Loses the moving average again
This would indicate a pullback into resistance or a liquidity grab.
Downside Targets:
4350 → 4300
Bearish Invalidation:
Strong hourly close above 4420
Final Takeaway
This is a confirmation zone, not a prediction zone.
Acceptance above resistance favors continuation, rejection favors a controlled pullback.
GOLD: Big Move Caught, So What’s Next?Hey traders,
I believe most likely some of you were thinking, “ Oh!! Strike in Venezuela, I’m going to buy GOLD! ”
And honestly, some of you did exactly that, and you could have caught a very decent $44.47 move on GOLD. Nicely done.
So the real question now is, what’s next?
Here’s how I’m looking at GOLD right now.
On the 1-hour chart, I’ve spotted a Head and Shoulders formation.
At the point of sharing, GOLD is trading around $4,404.08.
I’m not a trend chaser. At best, a breakout trade is something I can accept, but only when certain conditions are met. Chasing price usually creates unnecessary stress , and that’s not how I like to trade.
My plan, if the market cooperates.
Instead of chasing, I’m patiently waiting for a pullback.
Pullback zone:
$4,378.82 to $4,352.39
Action:
I’ll wait for my MCC (Magic Candle Confirmation) within this zone before considering a buy (long).
Final target remains the same.
Once the market reaches the recent high before the pullback, I’ll shift my stops to entry, securing a risk-free trade.
As usual, this is not a trade call or a trade signal.
Just me sharing my view from 20 years of research and trading.
Check my signature below for more information.
RIFUSDT //Inverse head and shoulders formationThe chart shows an inverse head and shoulders pattern, but the formation condition is to look for closing prices above the yellow line. Our first target point is 0.04034, which corresponds to the Fibonacci 1.414 retracement of the breakout. If we see closing prices above this level, the main target is 0.04471.
2300: Head and Shoulder's breakout2300 has broken out HnS neckline with good volume and gap up opening candle. Next candle is low volume retracement. It would be ideal to have a retest of 59-60 area for entry but good to buy at CMP as well
With SL 57.3 on closing basis it has good setup to hit 66.7 and 71. Breakout about 71 will lead to higher targets towards 80s.
Head and Shoulders PatternHead & Shoulders Patterns
Classic Reversal Structures Every Trader Should Know
1. Head & Shoulders (Bearish Reversal)
The Head & Shoulders pattern is a bearish reversal formation that typically appears after an established uptrend. It signals a possible shift from bullish to bearish market conditions.
This structure consists of three swing highs:
• Left Shoulder – first peak
• Head – highest peak
• Right Shoulder – final peak, similar in height to the left shoulder
Identification Rules
• Left Shoulder < Head > Right Shoulder
• Left Shoulder ≈ Right Shoulder (symmetry improves reliability)
Volume ideally declines as the pattern forms, showing weakening buying pressure.
Between the peaks are two pullbacks (swing lows). Connecting these lows forms the neckline. A confirmed break below the neckline completes the pattern and signals bearish continuation.
2. Inverse Head & Shoulders (Bullish Reversal)
The Inverse Head & Shoulders is the bullish counterpart and typically forms after a downtrend. Instead of peaks, the pattern is made of three troughs:
• Left Shoulder – first low
• Head – lowest point
• Right Shoulder – higher low, similar to the left shoulder
Identification Rules
• Left Shoulder > Head < Right Shoulder
• Left Shoulder ≈ Right Shoulder (symmetry improves reliability)
Volume often contracts during formation and may expand on the neckline breakout.
The highs between the troughs form the neckline. A break above the neckline confirms the bullish reversal.
3. Complex Head & Shoulders Variations
Complex variations follow the same logic as standard H&S patterns but include:
• Multiple shoulders on one or both sides
• More than one head
Despite the added structure, these patterns still rely on:
• Symmetry
• Clear neckline definition
• Breakout confirmation
Traders should treat them the same way as standard formations, but with extra patience.
4. Measurement Rule (Profit Targets)
Standard Head & Shoulders (Bearish)
• Measure the vertical distance from the head to the neckline
• Subtract that distance from the neckline breakout level
• This projects a downside target
Inverse Head & Shoulders (Bullish)
This is very simple. It’s exactly the same as the above Standard Head & Shoulders (Bearish), but inverted. Same concept. Just upside down.
** Tip **
When multiple heads exist, use the most extreme head (highest for bearish, lowest for bullish) for measurement.
Final Notes for Traders
Head & Shoulders patterns remain effective because they visually represent trend exhaustion and shifting market psychology.
When trading these patterns, always emphasize:
• Structure first
• Confirmation second
• Risk management always
MY NEXT WEEK EURCHF SELLS PROJECTION Overall trend is bearish from 1Month down to the 4H using my EMAs and price just pulled back to a key level sellers zone after a breakout of a support zone now turn resistance and now market is pushing down so I will place a sell limit once market open to take the sell from 0.92985 zone to my profit target with a good risk management so let’s see how this analysis is gonna play out and I will keep you guys updated about the trade….
DLTR | Something is Brewing for Dollar Tree | LONGDollar Tree, Inc. owns and operates discount variety stores offering merchandise at fixed prices. It operates through the Dollar Tree business segment. The Dollar Tree segment includes operations under Dollar Tree and Dollar Tree Canada brands, with its distribution centers in the United States and Canada. The company was founded by J. Douglas Perry and Macon F. Brock, Jr. in 1953 and is headquartered in Chesapeake, VA.
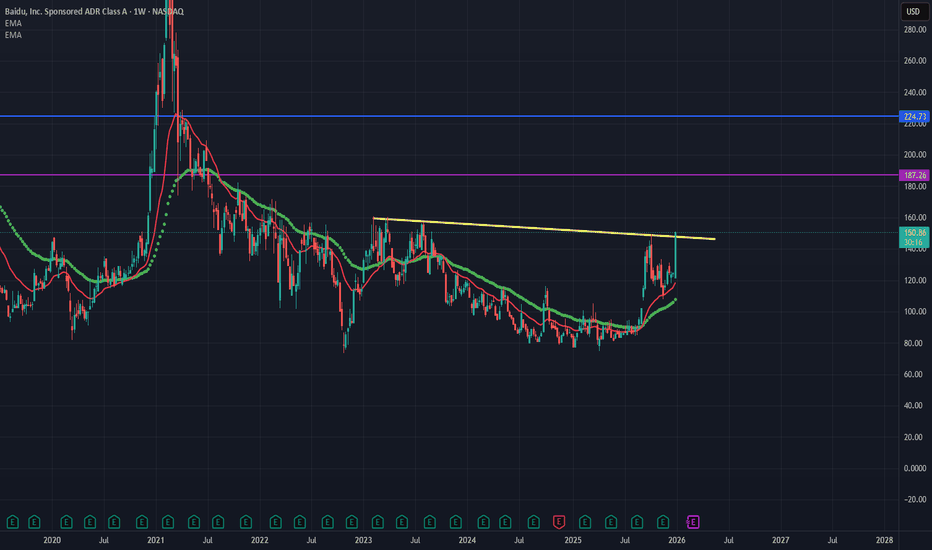
BIDU // Inverse head and shoulders formationThe chart shows an inverse head and shoulders pattern, but the formation requires closing above the yellow line. If this condition is met, the first target of the pattern is the breakout level at 187.26, which corresponds to the Fibonacci 1.414 level. If the price remains above this level, the main target is 224.73.
ICICI PRULIFE – Ready for Upside or Trap?ICICI PRULIFE – Ready for Upside or Trap? 🔍
📌 Trade / Swing Setup
• CMP: ₹678
• SL: ₹599
• Target: ₹797
📍 Structure & Logic
• After a sharp fall, stock failed once at 61.8% Fib and corrected
• Now re-attempting breakout from the same zone
• Structure suggests two possibilities:
1️⃣ Rounding bottom → direct breakout above ₹678
2️⃣ Inverse H&S → short consolidation, then breakout
• Key confirmation level: ₹694
– Sustained move above this = upside confirmed
• In both cases, target structure remains same
🧠 View:
This is a structure-based setup, not blind bullishness.
If breakout comes → momentum follows.
If not → expect time-wise consolidation (no panic).
⚠️ Clarification:
This is an independent analysis based purely on technical and market study. No part of Religare is involved in this view or recommendation.
📝 Important:
I am not responsible for any loss or profit incurred. I am not taking any fees — sharing for educational purposes only.
📉 Disclaimer:
Not SEBI-registered. Please do your own research or consult a financial advisor before taking any investment decision.


