Head and Shoulders ReversalLook to Sell or Short
Head and Shoulders Reversal 4HR Timeframe
Price falling back to 125 long term
Head and Shoulders

PSX | Oil and Gas is on the Rise | LONGPhillips 66 engages in the processing, transportation, storage, and marketing of fuels and other related products. The company operates through the following segments: Midstream, Chemicals, Refining, Renewable Fuels, Marketing and Specialties, and Corporate and Other. The Midstream segment provides crude oil and refined products transportation, terminal, and processing services, as well as natural gas, natural gas liquids, and liquefied petroleum gas transportation, storage, processing, and marketing services. The Chemicals segment produces and markets petrochemicals and plastics worldwide. The Refining segment refines crude oil and other feedstocks into petroleum products such as gasoline, distillates, and aviation fuels. The Marketing and Specialties segment purchases for resale and markets refined petroleum products such as base oils and lubricants, and power generation operations. The Renewable Fuels segment processes renewable feedstocks into renewable products at the Rodeo Renewable Energy Complex (Rodeo Complex) and at Humber Refinery. The company was founded in 1875 and is headquartered in Houston, TX.

Exide - A perfect inverse H&S?Till the price is above 600, inverse H&S pattern is valid.. If price breaks the trendline and closes below 600 on monthly basis, its a sign of worry. Stoploss should be below 600.
When a stock has to go up, it usually forms a double bottom. Its a similar case here in Exide where price touched 623 and now going back again to touch it.. Although it may get reversed from CMP as well.

CCO | Distribution Pattern | FractalsLooking ahead we can see the next phase of price action falling into a distribution pattern
Since correction wave 4 buyers took off but seem to be running out of steam. Eventually sellers will have to show what they can do after this trend breaks on a lower timeframe.
Ideal move going forward would focus on short positions only with a local swing target of ~$96 since that was the last area of support
Entries would be somewhere at the Head if using textbook patterns (HnS) or SMR
A confirmation entry to be on the safe side would be after the Breakout Bar indicating a change in trend, and then waiting for the Distribution phase to kick in for more shorting opportunities.
To add confluence to this trade idea we can look back at historical price action and find similar fractals that matches with current price movement
At least two fractals are spotted with the same patterns that are building the same price structure we're in
Elliott Impulse Wave, HnS Pattern, and Distribution Phases.
If buyers are not interested in the local support lvl then liquidity at $76 will be next zone.

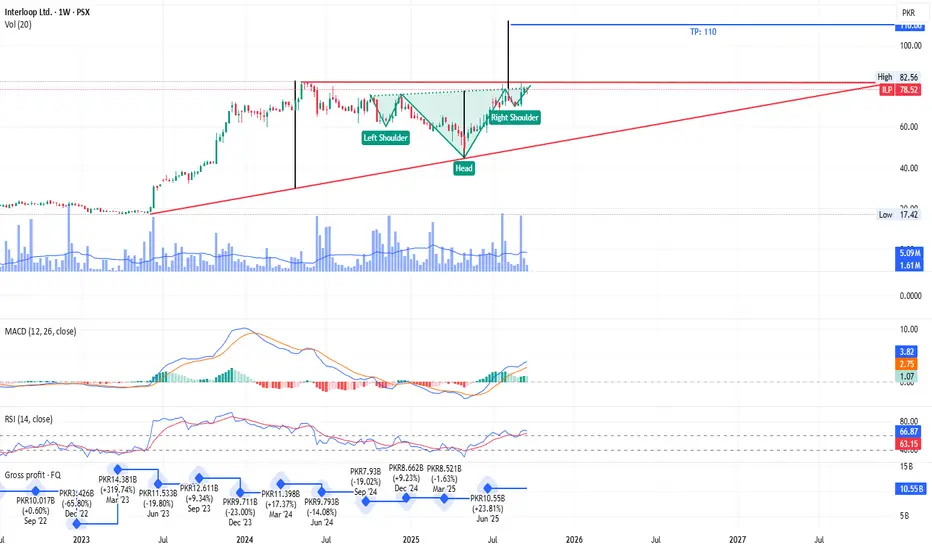
PSX: ILP - Weekly TF - Long positionInverse head and should projections
Good Improvement QoQ
TP#1: 100
TP#2: 110
BTC to 101,000$As we see bitcoin is making correction & we now in the wave C also there is head & shoulders pattern support that correction, eyes on 101,300$ to be the next supporting area which the market will go bullish from this price to continue the bullrun

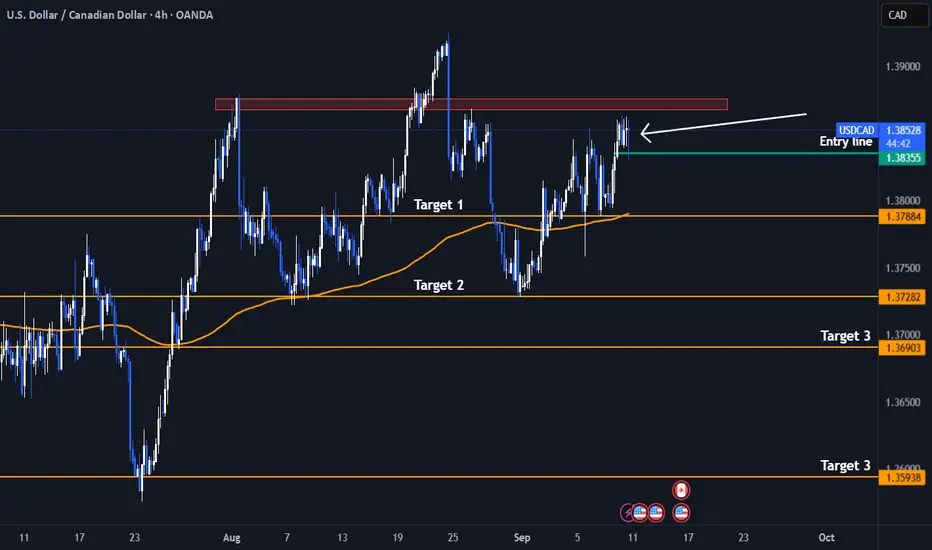
Short! Short! USDCAD - Double Head and Shoulder PatternI have identified a clear head and shoulders pattern forming within a larger head and shoulders structure on the daily timeframe for USD/CAD, indicating a potential bearish reversal.
From a fundamental perspective, several key factors are contributing to the current weakness in the Canadian dollar against the US dollar:
Canada's labor market showed significant weakness in August 2025, with a notable loss of 65.5 thousand jobs and a rise in unemployment to 7.1%, the highest in years. This has increased market expectations for monetary easing from the Bank of Canada (BoC).
Although core inflation remains above target, the weak jobs data is pushing the BoC towards potential rate cuts or a more accommodative policy stance, which weighs on the Canadian dollar.
The market is currently pricing in a very high chance (around 98%) of an additional rate cut by the BoC in September, following previous reductions to 2.75%. This dovish stance contrasts with the Federal Reserve’s more cautious or hawkish approach, creating a wider interest rate differential that supports US dollar strength.
Additionally, declining oil prices, a major export for Canada, are exerting further downward pressure on the CAD.
While recent US economic data has been mixed, the Fed is generally seen as less dovish than the BoC, sustaining demand for the USD.
Trade tensions and geopolitical risks between the US and Canada add to concerns over Canada’s growth outlook, contributing to CAD depreciation risk.
Trade Tip
A strong close below the Entry line will be a perfect entry /4hr TF
Stoploss : Above the Left Shoulder (Red Rectangle)
In summary, the combination of a weakening Canadian economy, dovish BoC bias, lower oil prices, and interest rate divergence between the US and Canada all support a bearish outlook for USD/CAD, which aligns well with the bearish head and shoulders pattern I have spotted on the chart.
Not an Investment Advise
AMAT – Inverse Head & Shoulders BreakoutApplied Materials just broke above the $200–205 neckline of a clean Inverse H&S on the weekly chart.
After a strong run in the past month, price may pause or retest the breakout zone before continuation.
Plan:
✅ Light entry above $205
✅ Add on pullback/consolidation near neckline
❌ Invalidation below $195 / $160 (right shoulder)
🎯 Target: $250 (ATH zone)
The pattern projects even higher (~$275–280), but $250 is the first realistic milestone. Watching closely for follow-through or a healthy retest.

BTC - Head and Shoulders PatternBTC chart appears to be playing out a pattern in spirit of a Head and Shoulders pattern, which typically signals a potential bearish reversal. Based on the recent double top observed on 14 August 2025, the percentage decline from that peak to the neckline of the pattern is approximately 17.14%. If this pattern plays out as expected, it suggests a further downside of around 17.14%, equating to roughly $19k, which would bring BTC’s price down to $90k-$91k.
This target level is supported by three key technical confluences:
- A multi-month ascending trendline connecting major pivot lows dating back to Aug 2024
- 61.8% Fibonacci retracement level, often considered a significant support zone
- A strong support zone on Daily timeframe
Given these factors, the probability of a continued decline appears high, and further downside pressure may be imminent.

Gold May Retest 3800 — How to Trade It?Today, gold pulled back to the 20 area and formed a short-term bottom confirmation on the 30M chart with several long lower wicks.
Next, watch the 58 resistance. If price breaks and holds above, bulls will gain a clear advantage, with a likely move to test 3800.
During this move, the 72–77 zone may provide resistance, but strong bullish momentum is likely to break through it.
If gold reaches around 3800 and pulls back, this level will become a new support zone.

EURCAD: Strong Bearish PatternIt appears that there is a significant likelihood of a decline in the 📉EURCAD pair in the near future.
The formation of a head and shoulders pattern following a test of a crucial resistance level, along with a subsequent breakout of its neckline, suggests a robust bearish signal.
The target is 1.6226.

LTCUSD focus on shorting in the supply zoneOn the daily chart, LTCUSD is trending downward after forming a head-and-shoulders pattern, indicating a short-term bearish trend. Currently, the 104.4-107.7 area is worth watching. Consider shorting if a rebound encounters resistance. Support below is expected around 92.3.

Head and Shoulders move @~125k I just saw an idea mention H&S @123k and I have to say I agree!
Reputation? None lol I've just been looking over this data the last couple of years. So far my prediction has traced out pretty accurately 😅
Not a genius or person to get on board with... It could go up instead of down from here; contrary to the predictions of an actual Head and Shoulders playing out irl. 🤷🏻
Bitcoin has always done the complete opposite of my expectations in the past, let's hope I'm not just a late bandwagonier 🙃

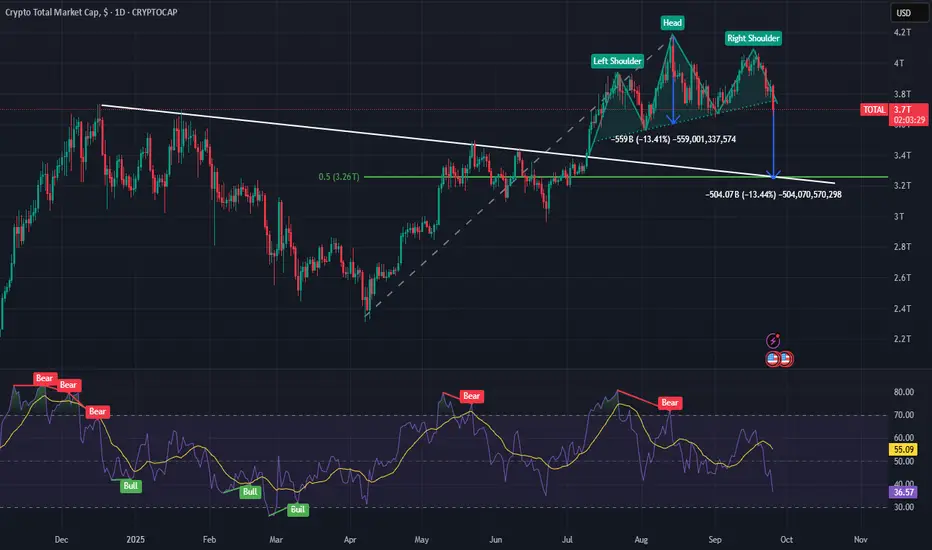
TOTAL - Head and Shoulders PatternTOTAL chart appears to be forming a Head and Shoulders pattern, which typically signals a potential bearish reversal. Based on the recent high observed on 14 August 2025, the percentage decline from that peak to the neckline of the pattern is approximately 13.4%. If this pattern plays out as expected, it suggests a further downside of around 13.4%, equating to roughly $500 billion, which would bring TOTAL’s market cap down to approximately $3.26 trillion.
This target level is supported by two key technical confluences:
- A long-term trendline connecting major pivot highs dating back to 17 December 2024
- 50% Fibonacci retracement level, often considered a significant support zone
Given these factors, the probability of a continued decline appears high, and further downside pressure may be imminent.
SPY CORRECTION SOON?Technical Outlook:
- Head and Shoulders (forming)
- Overbought RSI (above 70)
- Signaling Bearish Divergence
Fundamental Outlook:
Economic weakness looms as rising inflation meets sluggish growth, fueling stagflation fears. With markets on edge, a spooky September sell-off could be triggered by tightening conditions and fading investor confidence.

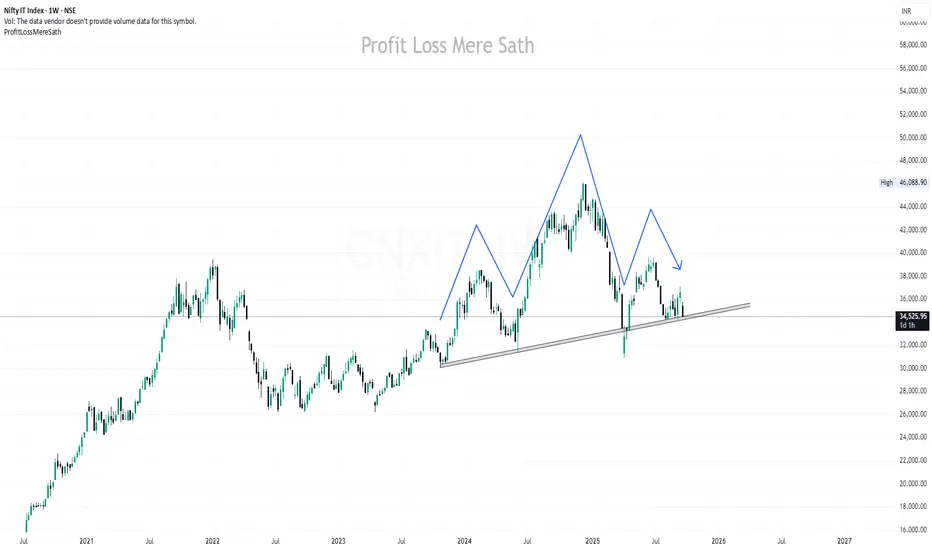
Nifty IT Index (Weekly Chart) AnalysisThe index is currently displaying a Head & Shoulders pattern on the higher timeframe (weekly). This is a classical bearish reversal structure that often indicates potential downside ahead if the neckline support is broken.
Everything depends on ACN’s results today. Keep in mind, if ACN goes down, our IT sector will also take a hit
SILVER XAGUSD30 min TF Short Scalp
Silver is very bulish Just a pull back is what we can capture , very risky trade but Head & shoulder pattern is making it look good
Trade will be active once complete Bearish candle close below the neckline
Must book partial profit, Once achieve 50 % towards TP put your SL to tp , and partial profits

USD/CAD Head and Shoulders patternA clear Head and Shoulders formation has developed. Left Shoulder (~1.3850), Head (~1.3950), and Right Shoulder (~1.3850). Price is now retesting the neckline zone around 1.3730–1.3750.
Normally this pattern formed when it's end of a trend.
So its safer to wait until the break of the support and establishing below the Resistance to enter.

awaiting confirmationim mainly looking for buys while trying to make the most of the pair by also looking for shorts. im hoping for 38 but only charts will tell.

GER40 Change of Bias - Now Going LongMy short confirmations for Ger40 have been invalidated. Now I am seeing an inverse head and shoulders.
Patiently waiting for more confluence before going long.

BTCUSD Q4 2025 to Q1 2026 DIP has begun!I see strong confirmations to back up a massive dip to 95 - 80k. Currently price is only pulling back to retest that bearish continuation pattern and head and shoulders.
I will send updates on LTFs on this trade idea as price continues to move to the downside.

Negative on Bajaj Finance The company has a history of strong profit growth and has maintained a healthy dividend payout. In its last reported quarter, it posted a net profit of over Rs 4,699 crore, with year-on-year growth of over 20%.

EURAUD upside is endingThe EURAUD bullish run may be coming to an end.
Price action has broken trend support and formed a head-and-shoulders trend reversal pattern.
From a fundamental perspective, the AUD is an attractive investment due to its stable inflation and robust GDP growth.
If EURAUD doesn't become bearish, we may see the price action form a consolidation.
OANDA:EURAUD FX:EURAUD
