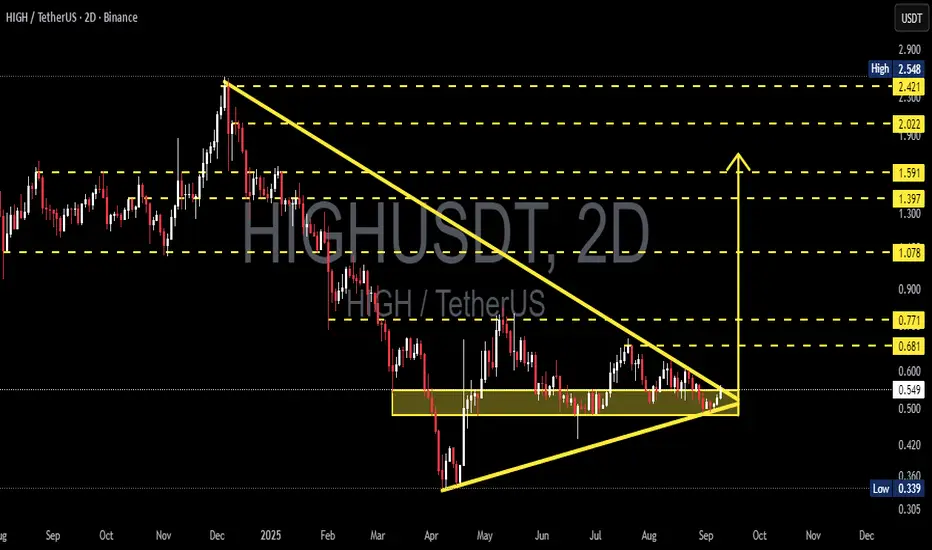
HIGHUSDT — Symmetrical Triangle A Major Breakout Is Approaching?The pair HIGH/USDT is currently at a critical stage after experiencing a prolonged downtrend earlier this year. On the chart, we can clearly see the formation of a Symmetrical Triangle, marked by a descending resistance line from the $2.5 peak and a rising support line that has been holding since April 2025.
This type of pattern usually appears during a consolidation phase, where both buyers and sellers are competing to decide the next medium-term trend.
---
🔑 Key Highlights from the Chart:
1. The accumulation zone (0.45 – 0.55) has been tested multiple times since April and continues to hold — making it a critical demand area.
2. Price action is now squeezing into the apex of the triangle, suggesting that a major breakout is likely to occur soon.
3. Key resistances: 0.681 → 0.771 → 1.078 → 1.397 → 1.591 → 2.022 → 2.421.
4. Key supports: 0.45, with the last major floor at 0.339. A breakdown here would strengthen the bearish case.
---
📈 Bullish Scenario
A breakout above the descending trendline and a confirmed 2D candle close above 0.68–0.77 would open the door for a strong rally.
Short-term targets: 0.77 → 1.08 → 1.40
Mid-term targets: 1.59 → 2.02 → 2.42
Full measured move target: 2.63 – 2.76
Confirmation: Breakout must come with rising volume + successful retest.
---
📉 Bearish Scenario
Failure to hold above 0.45 would invalidate the triangle pattern and likely lead to further downside.
First bearish target: 0.339 (previous low).
If broken, extended bearish measured move could reach around 0.12 (extreme scenario).
Confirmation: 2D close below 0.45 with strong selling volume.
---
🧭 Conclusion
HIGH is at a decisive turning point.
Bulls need a confirmed breakout above 0.68–0.77 to shift momentum and reclaim medium-term strength.
Bears will dominate if 0.45 breaks, pushing price back to 0.339 or lower.
Until confirmation, the setup remains neutral, but the tightening triangle indicates that a large move is imminent.
---
#HIGHUSDT #HIGH #Crypto #TechnicalAnalysis #SymmetricalTriangle #Breakout #Bullish #Bearish #Altcoin #SupportResistance
Highanalysis
HIGHUSDT 1DHIGH ~ 1D Analysis
#HIGH This coin is still in the channel decreases, waiting for this resistant line successfully penetrated. Maybe with a minimum target of 10%+.

HIGHUSDT 1WHIGH ~ 1W
#HIGH If you still have Conviction on this coin,. This support block would be a very good buying place for now,. buy in stages with a target of 20%++

#HIGH (SPOT) IN ( 1.100- 1.400) T.(7.000) SL(1.051)BINANCE:HIGHUSDT
#HIGH / USDT
Entry ( 1.100- 1.400)
SL 1D close below 1.051
T1 2.200
T2 2.600
T3 3.300
T4 4.000
T5 5.000
T6 5.800
T6 7.000
______________________________________________________________
Golden Advices.
********************
* collect the coin slowly in the entry range.
* Please calculate your losses before the entry.
* Do not enter any trade you find it not suitable for you.
* No FOMO - No Rush , it is a long journey.
Useful Tags.
****************
My total posts
www.tradingview.com
**********************************************************************************************
#Manta #OMNI #DYM #AI #IO #XAI #ACE #NFP #RAD #WLD #ORDI #BLUR #SUI #VOXEL #AEVO #VITE #APE #RDNT #FLUX #NMR #VANRY #TRB #HBAR #DGB #XEC #ERN #ALT #IO #ACA #HIVE #ASTR #ARDR #PIXEL #LTO #AERGO #SCRT #ATA #HOOK #FLOW #KSM #HFT #MINA #DATA #SC #JOE #RDNT #IQ #CFX #BICO #CTSI #KMD #FXS #DEGO #FORTH #AST #PORTAL #CYBER #RIF #ENJ #ZIL #APT #GALA #STEEM #ONE #LINK #NTRN #COTI #RENDER #ICX #IMX #ALICE #PYR #PORTAL #GRT #GMT #IDEX #NEAR #ICP #ETH #QTUM #VET #QNT #API3 #BURGER #MOVR #SKL #BAND #ETHFI #SAND #IOTX #T #GTC #PDA #GMX #REZ #DUSK #BNX #SPELL #POWR #JOE #TIA #TFUEL #HOT #AVAX #WAXP #OGN #AXS #GALA #ONE #SYS #SCRT #DGB #LIT #QI #FIL #GLMR #ATOM #LTC #MANA #ONT #TLM #SLP

#HIGH (SPOT) entry range( 1.080- 1.380) T.(3.990) SL(0.944)BINANCE:HIGHUSDT
entry range (1.080- 1.380)
Target1 (1.910) - Target2 (2.612) - Target3 (3.249) - Target4 (3.990)
3 Extra Targets(optional) in chart, if you like to continue in the trade with making stoploss very high.
SL .1D close below (0.944)
*** collect the coin slowly in the entry range ***
*** No FOMO - No Rush , it is a long journey ***
**** #Manta ,#OMNI, #DYM, #AI, #IO, #XAI , #ACE #NFP #RAD #WLD #ORDI #BLUR #SUI #Voxel #AEVO #VITE #APE #RDNT #FLUX #NMR #VANRY #TRB #HBAR #DGB #XEC #ERN #ALT #IO #ACA #HIVE #ASTR #ARDR #PIXEL #LTO #AERGO #SCRT #ATA #HOOK #FLOW #KSM #HFT #MINA #DATA #SC #JOE #RDNT #IQ #CFX #HIGH ****

HIGHUSDT.1DExamining the 4-hour chart for HIGH/USDT, let's delve into the details:
Key Resistance and Support Levels:
Resistance 1 (R1): The chart does not specify the value, but it seems to lie slightly above the current trading price, potentially near recent highs.
Support 1 (S1): Again, the exact level isn't specified, but it's marked on the upward trend line. A breach below this could signal a reversal of the current trend.
Support 2 (S2): $3.653 - This level might serve as a lower boundary of the trading range if a downtrend confirms.
Support 3 (S3): $2.986 - A significant fall below S2 could see prices testing this next critical support level.
Technical Indicators:
Relative Strength Index (RSI): The RSI at 52.54 is just above the neutral 50, indicating slight bullish momentum but not particularly strong.
Moving Average Convergence Divergence (MACD): The MACD is below the signal line, and the histogram values are negative, suggesting bearish momentum is currently prevailing, though it appears to be weakening as the histogram bars are small.
Trend Analysis:
The price has been following an ascending trend line, supporting the price on pullbacks and indicating an upward trend. This trend line is crucial as a guide for the continuation of the bullish sentiment.
Conclusion:
The current market condition for HIGH/USDT on the 4-hour chart shows a market at a potential turning point. With the RSI near neutral and MACD indicating a bearish momentum, traders should be cautious. The adherence to the ascending trend line will be critical in determining future movements. A hold above this line could see attempts to test R1, while a break below might see the price fall towards S2 and potentially S3 if bearish pressure intensifies.
For trading, consider setting up buy orders near the trend line with stops placed just below to catch potential rebounds while managing risks. Conversely, if the price breaks the trend line decisively, it might be prudent to look for short opportunities towards S2 or S3, keeping an eye on any change in momentum indicated by RSI and MACD for potential exit or entry adjustments.
