BUY MORE ETH AT THIS ZONE AND HOLD!!!!BUY MORE ETH AT THIS ZONE AND HOLD!!!!
I will drop a lot of pictures on this to make it easily understandable
Firstly on the 3Months time frame we have an all-time high and a drop to 78.2% on Fibo which is 1054.33
then we started reversing slowly, I didn’t see it at first but then I saw it on the drop to 1364.5.
A series of HH and HL has been created; the latest one was in 1597. which is at 61.8% Fibonacci from the previous High indicating a reversal that we are seeing
So I expect that low to take out the previous high at 2145 and then find a new higher high which will be at 2449 or high to 3028 there we will see what the market will do and then see.
Check out my trade on Eth with the link
Higherhigh

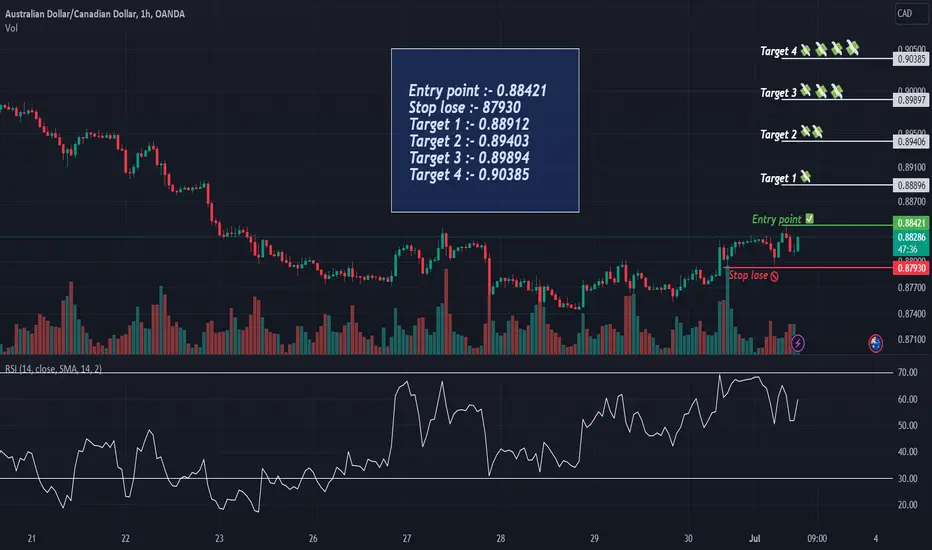
AUDCAD Bullish viewEntry point :- 0.88421
Stop lose :- 87930
Target 1 :- 0.88912
Target 2 :- 0.89403
Target 3 :- 0.89894
Target 4 :- 0.90385
usdjpy to create a strong higher highAfter earning small chips from the shorts I decided to go long and participate in the trend. This pair is still in an uptrend. The dollar is creating higher lows and structurally higher highs. I noticed a breakout of consolidation then a retest. The re-test presented a bullish reversal pattern followed by volume. I project price to push to atleast 144.808

USDJPY to create another higher highUJ is still in its major uptrend as price continues to create strong higher highs and indecision lower lows. I took a buy based on the 30min structure. My target is the next daily resistance level. I believe that buying at a higher low off of a retest is a valid opportunity. Especially after a volume bullish engulfing candle.

EURUSD to make its 4H higher highI believe the daily momentum for this pair is still bullish. The 4H retraced to the 38.2% fib and presented a Volume bullish engulfing on top of a trendline . While I do believe the Euro is getting weaker, one more higher high or bullish push would make perfect sense considering the fact that its beneath a major resistance and had been rejected there prior. Its approaching an untested breakout zone while these daily candles aren't very strong.

AUDUSD POTENTIAL FOR HIGHER HIGH!!Check the chart for the Description.
Audusd shows strong bullish momentum and pushing towards a higher high. Soon to break, wait for market to RETEST then make your decision based on the candle sticks that show

usdjpy to make a big decision todayIn the following video I've provided 3 scenarios in which I would look to take part in any trades. The first of which is quite simply a higher high will produce another higher high.
Both scenarios afterwards are reversals. If price throws indecision in the correct direction, it signals a reversal. The daily close today will suggest a lot at yesterday was relatively volatile.

AUDusd continues to make higher highsThis pair is very beautifully creating its higher highs. I was initially hesitant to go long as price was up trending however there were some bearish signals such as lack of strong bullish candles. This bullish push was made with weaker candles beneath this resistance. After a retracement, and a re-test of support, the trendline, or daily/weekly support.

USDJPY 4H Bullish ReversalI was initially under the impression that UJ might be prepared to retrace deeper. if the 23.6% fib did not hold. The Fibonacci level has held up nicely. Yesterday another indecision candle on top of support, and the 23.6%. In addition, the 4H moving average crossing to the upside, the 1H formed a higher low after forming its higher high within this range. I believe price is preparing to breakout bullish to continue its upward trend.

EURUSD just make another higher high. BUY!EURUSD retraced to the 38.2 and formed a morning star. Price then broke through a strong resistance. The 1H is looking to re-test support. I will be looking for indecision and reversal candlesticks on top of the daily support or the prior high which is near the low & 38.2%.

usdjpy consolidating before breakoutUSDJPY is hinting at a momentum swing. The overall trend is still up however price has not been making any new higher highs on the daily, In fact, volatility at the high forms a bearish reversal signal. I believe price is pulling back intraday bullish, but this push isn't very strong. Another daily rejection at the high will trigger a short setup for me.

EURUSD intraday 1st higher highI believe EURUSD is reversing as it formed its first higher high within this consolidation range. ADX was not bullish during this move, however structure was broke. I will look to capitalize on any breakout. I have a zone marked at the bottom of the zone as the daily has formed two bullish reversal candlesticks along with volatility at support. Currently price is at daily swing high, which price failed to break. The 4H has formed a higher high and is retracing with indecision to form a higher low. If the daily support holds. Im long EURUSD.

USDJPY ceases to create lower lowsAfter an indecision pullback to retest a 4H bullish engulfing, I took a long position based on the higher high and retest of the 30MIN. I'm taking long positions based on the 23.6 retracement of the daily chart. I expect for price to continue to make higher highs as I believe this uptrend is still strong.

Ethereum testing a very strong supportEthereum has some big swings intraday but multiple timeframe analysis suggests its not mere noise. Price is testing a weekly bullish reversal pattern. Its best to be patient and allow this minor downtrend to cease and form a newfound support level. If an uptrend begins at these lows, Targets could be steep considering where the potential neckline is if a double bottom is to form on the daily.

AUDUSD reversal at 23.6% RetracementThe 4H retraced to the 23.6% fib and provided a hammer which is why I wasn't hesitant to sell, even beneath the trendline. Upon the 4H close and hammer. Price immediately progressed bullish to create a strong higher high, broken correction trendline, as well as ADX mixing in to provide confluence. Intraday the 1H timeframe is a clear opportunity to go long on this pair to at least its -27% target. or the 61.8 Major fib retracement. I believe that this pair is still in an overall downtrend until its creating daily higher highs and higher lows.


USJPY ready to take off againUSDJPY is very bullish. Its so bullish I believe that another 23.6% retracement is available. The daily retraced to the 23.6% Fibonacci. After an indecision candle, price formed a strong bullish engulfing. The 4H has given a strong signal that should grab our attention. A correction trendline has been broken with a lot of volume, the moving average is relatively close to crossing up.

Buying Ethereum once moreEthereum is on its journey of creating many higher highs along with bullish reversal candlesticks to initiate the move. The Daily has retraced to a key level on the daily chart. This is our first signal to go long. A morning star on top of structure and support. The 4H chart will inform us on whether price is still retracing bearish or if its time to get in long NOW.

Audusd to become bullish intraday this weekI mistakenly took a minor break of structure and a moving average crossover as a reversal trigger when in actuality it was simply the warning. The trigger is what is presented currently. This 4H clear higher high on our home timeframe. This is trading 101. Simple higher high along with TDI. The daily makes sense as this bullish push is all apart of the daily LOWER HIGH being formed. Major 38.2 has been broken, the next prz level is the 61.8.
This week I look forward to a bullish re-test of the weekly support/ a trendline/ zone/ structure
I'll only buy a re-test. Maximize this move of the week potentially. Higher highs make higher highs.

Don't be fooled by reversal candlesticks this pair BULLISHUSDJPY may be slowing down in pertaining to bullish momentum, but a few other things need to happen for a short. A correction trendline has already been broken which is the first sign. The following must occur on the intraday 4H timeframe for me to short. I need to see a Lower low along with the moving average crossover to the downside. then a retest to the neckline and providing indecisiveness and volatility on the 1H. My first target for any shorts will be the major 38.2 PRZ level. Because this pair is massively bullish, all targets for buys are locked in at -27% then then next daily resistance since price is creating record highs.


Gold has Likely bottomed out for this monthI decided to go long on gold immediately after receiving a reversal candlestick at a low on top of daily support. This candle also provided bullish volume after breaking a trendline and creating a new high. Price is now on the buy side of a strong trendline as well as the buy side of a strong support. I look forward to adding an entry upon a reversal candlestick at the retest. At the end of the day we're counter trend trading NOW.

Potential High for usdjpy, intraday short setup 30mminUSDJPY has been uptrending rather strong for quite a few weeks now. Its common that you'd like to go go against the trend, however, the only way to learn how to trade reversals is to trade them. Price presented a volatile shooting star for the close of Thursday. (4H). The daily had some wick action also. The 1H had a moving average crossover to the downside before making the latest high. the 30Min has already created a srtrong eveing star and began downtrending on its 2nd lower low. Im looking to get in on the Lower high. A counter trend trade short back down to Weekly support.
