ORDER - The next key condition is a successful resistance-to-supLONG – ORDER
On the 15-minute timeframe, price has broken above a long-term descending trendline, signaling a structural shift. The next key condition is a successful resistance-to-support flip. Once confirmed, a retest of the local high becomes the primary upside target. Entry is planned after volume expansion to validate real buying interest and reduce false-break risk.
🎯 TP: 0.08502
🛡️ SL: 0.06952
📊 RR: 1 : 6.49
A disciplined long setup: trend break + S/R flip + volume confirmation → high-probability continuation with asymmetric reward.
Highreward

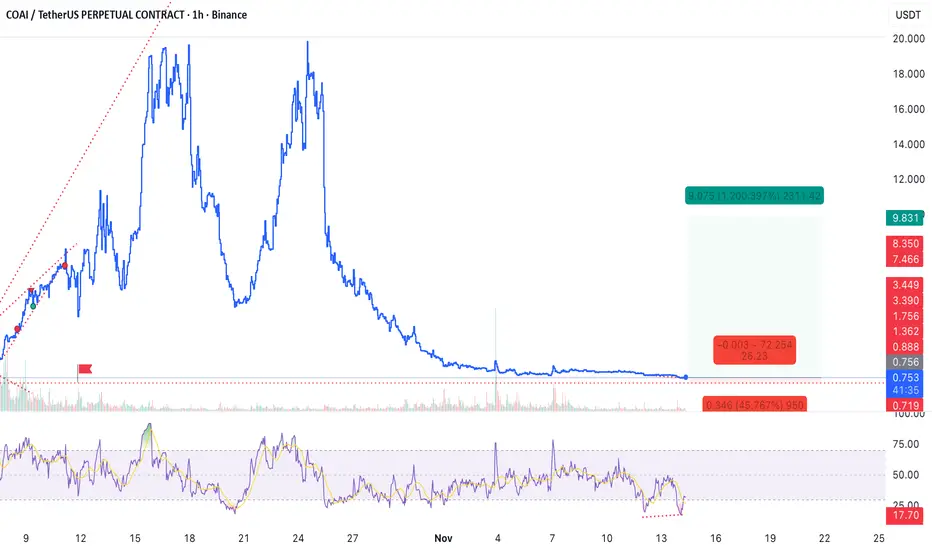
HIgh risk - High reward – COAI📈 HIgh risk - High reward – COAI
RSI is heavily oversold on both the 1h and 4h timeframes, with a clear bullish divergence forming on the 15m. Price has experienced a deep and extended decline from the local high, signaling exhaustion of selling pressure. A recovery bounce from this zone is highly probable. This is a high-risk, high-reward setup, requiring strict adherence to the stop-loss.
🎯 Trade Setup:
Take Profit (TP): 9.831
Stop Loss (SL): 0.438
Risk/Reward Ratio (RR): 1 : 26.23
A disciplined long entry targeting a strong rebound driven by extreme oversold conditions and bullish divergence.
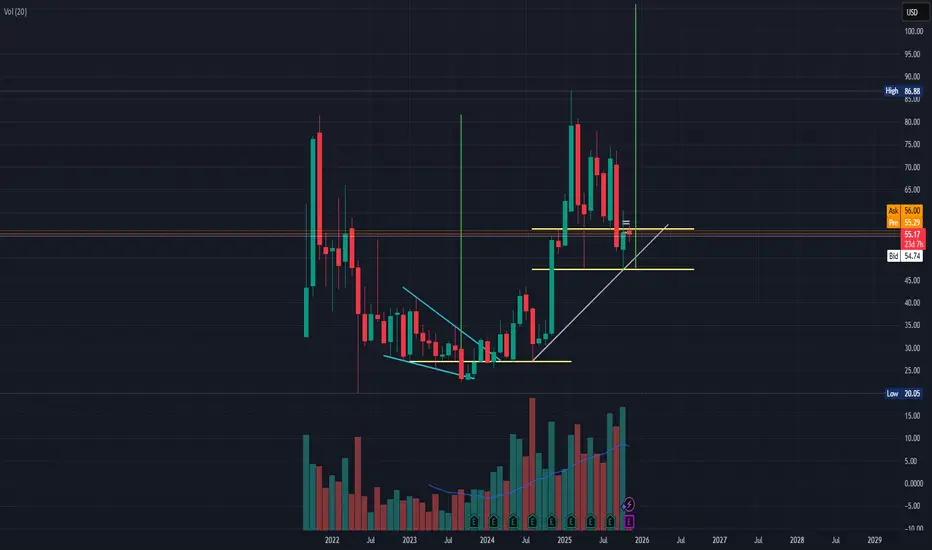
Cup & Handle - BROS (Monthly Chart)As you can see in the monthly chart of BROS, a cup and handle pattern is forming.
The price target of a cup and a handle is the depth of the cup but starting from the the handle's ending candle.
In this graph, you can see that I'm using a little conservative price target: the price target is not from the end of the handle, rather from the support around 47.
That is because the cup depth from the handle would give us 100%+, and though I like such results, I'm a little conservative when it comes to trades of above 50% gain, regardless of trade length (and it's more of personal risk management and it works for me but maybe someone else can see this as a clear sign of consistent buying until PT).
Fundamentally, the earning of 5-Nov-2025 after market, shall play a huge role in succeeding the completion of the cup and handle price target.
My short term price target is 62, and the reason for that is the 20-Aug-2025 and 15-Sep-2025 role reverse from support to resistance (Daily Chart), and considering BROS volatility, it's conservative, yet, risky in nature.
My medium term target is 77.5 which is the highest from the body candle from the left of the cup and handle and not the second one of 79.16, and again, the reason for this is because I want to take a more conservative approach as BROS volatility may hurt high risk-intolerant traders.
The long term target is 105 due to the cup and handle depth.
Generally, I'm a high risk trader. However, with current market conditions and the current phase of uncertainty in U.S. equities due to government shutdown and volatile policies (especially tariffs), one might want to seek more conservativeness in their trading.
That being said, BROS is fundamentally one of the best growth stories I've analyzed. Revenues, earnings, cash management and funding, operational execution, etc., combined they check out the marks of a good investment. Yet, also fundamentally, it has a lot of optimism priced in, and as of this writing, we are confronting investors fears from the current uncertainty, high valuations, and profit taking period. we might see some selling pressure after a strong hike (assuming positive/expectations beat in earnings) due to profit taking and uncertainty. It has a very high valuation comparing to its peers, yet, it also has great growth comparing to its peers...
Not a financial advise, just a guy behind a screen.
Please do not hesitate to share your opinions, as long as it's logical.
October 05, Forex Outlook: Key Moves to Watch This Week!Welcome back, traders!
In today’s video, we’ll be conducting a Forex Weekly Outlook, analyzing multiple currency pairs from a top-down perspective—starting from the higher timeframes and working our way down to the lower timeframes.
Our focus will be on identifying high-probability price action scenarios using clear market structure, institutional order flow, and key confirmation levels. This detailed breakdown is designed to give you a strategic edge and help you navigate this week’s trading opportunities with confidence.
📊 What to Expect in This Video:
1. Higher timeframe trend analysis
2. Key zones of interest and potential setups
3. High-precision confirmations on lower timeframes
4. Institutional insight into where price is likely to go next
Stay tuned, take notes, and be sure to like, comment, and subscribe so you don’t miss future trading insights!
Have a great week ahead, God bless you!
The Architect 🏛️📉

September 28, Forex Outlook: What Can Traders Expect This Week?Welcome back, traders!
In today’s video, we’ll be conducting a Forex Weekly Outlook, analyzing multiple currency pairs from a top-down perspective—starting from the higher timeframes and working our way down to the lower timeframes.
Our focus will be on identifying high-probability price action scenarios using clear market structure, institutional order flow, and key confirmation levels. This detailed breakdown is designed to give you a strategic edge and help you navigate this week’s trading opportunities with confidence.
📊 What to Expect in This Video:
1. Higher timeframe trend analysis
2. Key zones of interest and potential setups
3. High-precision confirmations on lower timeframes
4. Institutional insight into where price is likely to go next
Stay tuned, take notes, and be sure to like, comment, and subscribe so you don’t miss future trading insights!
Have a great week ahead, God bless you!
The Architect 🏛️📉

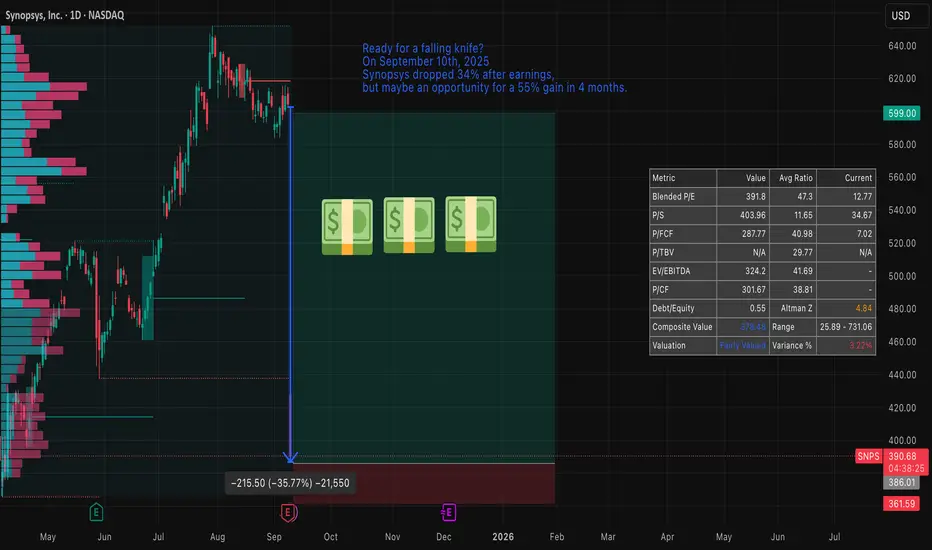
Synopsys — a sharp sell-off, risky entry and clear opportunitySynopsys plunged roughly 30–34% on 10 September 2025, wiping out a large chunk of market value after quarterly results missed expectations and guidance was cut. That kind of move often feels like a “falling knife”: attractive on paper, dangerous in practice.
Price action and technical context
The stock has gapped lower and left a sizeable down-gap to fill. From a technical viewpoint the setup resembles a fast, impulsive sell-off inside a broader downtrend established since the spring; price is now testing levels that were former support in April 2025. Short-term momentum indicators show oversold readings, but volatility is elevated and trend-following measures still favour the downside until a reliable base is formed.
Key technical reference points to watch:
Gap zone/topside resistance: around the pre-drop range near the mid-$600s.
Immediate support / stop placement: just below the April 2025 lows (your stated stop).
Possible gap-fill target: if the market rotates back, reclaiming the gap by January 2026 implies roughly a ~55% upside from current depressed levels (as you noted).
Fundamentals and why this remains an opportunity
Despite the headline shock, Synopsys’s underlying business remains high-quality:
Market-leading positions in EDA tools and IP libraries.
Strong, recurring revenue mix (software subscriptions and maintenance).
Long secular tailwinds from AI, advanced node design and chiplet modularity.
Valuation has re-rated materially after the drop — the company is no longer priced at the frothy multiples of earlier in the cycle. Analysts have revised estimates downward but many still target stock levels clustered around $600, reflecting belief in recovery by late 2025 / early 2026.
Options flow and timing
There is notable open interest concentration in both calls and puts around the $600 strike with expiries in December 2025 and January 2026. That concentration suggests the market expects meaningful activity/interest around that level into the winter and gives a window where a gap-fill or relief rally could materialize before January expiries.
Risk management and trade plan
Trade type: speculative rebound / gap-fill play, not a buy-and-forget investment.
Target: gap-fill / recovery toward pre-drop levels by January 2026 — roughly +55% potential from current depressed price (per your scenario).
Stop: just below April 2025 lows (limits downside if the downtrend resumes).
Position sizing: small relative to portfolio — treat as a high-volatility, event-driven trade.
Alternatives: consider defined-risk option structures (e.g., debit spreads) to cap downside while retaining upside exposure to a gap fill.
Catalysts to monitor
Any updates to guidance or profitability from Synopsys management.
China demand/FX developments and IP licensing commentary.
Options positioning into December 2025 / January 2026 expiries.
Broader semiconductor capital spending and AI-related design win announcements.
Technical indicators to watch
200DMA and April lows (support/resistance anchors).
RSI(14) and MACD for bullish divergence and momentum confirmation.
Volume on any recovery day — strong volume on up days increases odds of a sustained bounce.
Bottom line
This is a high-risk, high-reward setup: a classic “ falling knife ” that can be dangerous if you’re early, but presents a credible opportunity because Synopsys’s fundamentals remain solid, valuation is more attractive, and market positioning (options interest near $600) favors a potential recovery window through January 2026. Use tight risk controls (stop under April lows) and consider defined-risk option plays if you prefer limited downside.
August 24, Forex Outlook: What Can Traders Expect This Week?Welcome back, traders!
In today’s video, we’ll be conducting a Forex Weekly Outlook, analyzing multiple currency pairs from a top-down perspective—starting from the higher timeframes and working our way down to the lower timeframes.
Pairs to focus on this Week:
USDJPY
USDCAD
EURGBP
EURJPY
GBPCHF
NZDCHF
USDCHF
Our focus will be on identifying high-probability price action scenarios using clear market structure, institutional order flow, and key confirmation levels. This detailed breakdown is designed to give you a strategic edge and help you navigate this week’s trading opportunities with confidence.
📊 What to Expect in This Video:
1. Higher timeframe trend analysis
2. Key zones of interest and potential setups
3. High-precision confirmations on lower timeframes
4. Institutional insight into where price is likely to go next
Stay tuned, take notes, and be sure to like, comment, and subscribe so you don’t miss future trading insights!
Have a great week ahead, God bless you!
The Architect 🏛️📉

BTC short idea, Pullback might be on its way. RR 1:9Price broke the latest daily uptrend and it is testing it back. Looks like there might be a chance of some pullback on its way. Might execute short position entry if this 4HR candle gives some reversal signal. Trade carefully and cheers !

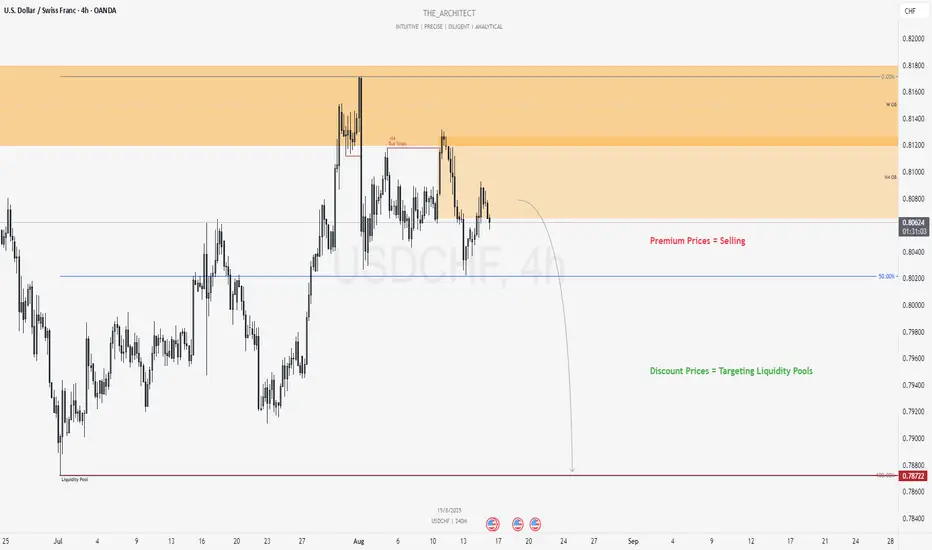
USDCHF: Bearish Continuation Setup From Weekly Supply ZoneGreetings Traders,
In today’s analysis of USDCHF, we observe that the prevailing institutional order flow remains firmly bearish. This directional bias positions us to focus on high-probability selling opportunities aligned with downside liquidity objectives.
Key Observations on H4:
Weekly Bearish Order Block Rejection: Price recently rejected a weekly bearish order block, initiating a decisive market structure shift to the downside. This rejection validates the weekly supply zone as a strong institutional resistance area.
Premium Price Context: Current price action is positioned within premium territory, offering an advantageous zone to seek short setups.
H4 Bearish Order Block Reaction: Price is presently reacting to an H4 bearish order block, strengthening the case for a sell-side continuation.
Trading Plan:
Entry Strategy: Seek confirmation-based entries on the lower timeframes (M15 and below) within the H4 order block to refine risk.
Target Objective: Aim for discount-side liquidity pools, in alignment with institutional objectives to rebalance price and capture liquidity resting below.
Remain disciplined, let the market confirm your bias, and execute with precision risk management.
Kind regards,
The Architect 🏛️📉
August 11, Forex Outlook: What to Expect from This Weeks TradingWelcome back, traders!
In today’s video, we’ll be conducting a Forex Weekly Outlook, analyzing multiple currency pairs from a top-down perspective—starting from the higher timeframes and working our way down to the lower timeframes.
Pairs to focus on this Week:
USDCAD
EURGBP
EURJPY
GBPCHF
USDCHF
NZDCHF
EURNZD
Our focus will be on identifying high-probability price action scenarios using clear market structure, institutional order flow, and key confirmation levels. This detailed breakdown is designed to give you a strategic edge and help you navigate this week’s trading opportunities with confidence.
📊 What to Expect in This Video:
1. Higher timeframe trend analysis
2. Key zones of interest and potential setups
3. High-precision confirmations on lower timeframes
4. Institutional insight into where price is likely to go next
Stay tuned, take notes, and be sure to like, comment, and subscribe so you don’t miss future trading insights!
Have a great week ahead, God bless you!
The Architect 🏛️📉

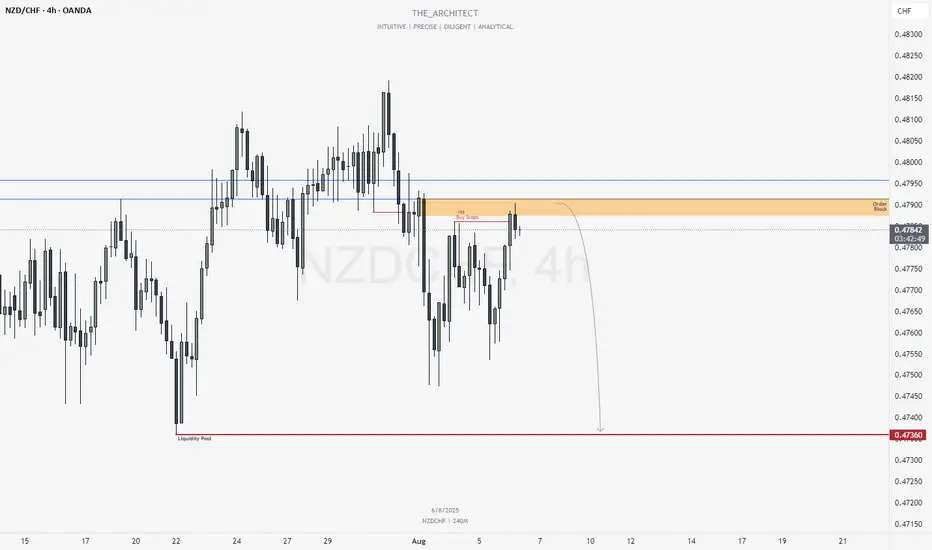
NZDCHF: Selling Within Bearish Order Flow & Order BlockGreetings Traders,
In today’s analysis of NZDCHF, recent price action confirms the presence of bearish institutional order flow. As a result, we aim to align ourselves with this directional bias by identifying strategic selling opportunities.
🔍 Key Observations on H4:
Bearish Market Structure Shift
The H4 timeframe has confirmed a bearish shift in market structure, giving us a solid framework to seek short setups aligned with institutional momentum.
Bearish Order Block
Price has recently reached a bearish order block, expected to act as a strong resistance zone for potential downside continuation.
Liquidity Engineering
Buy stops on H4 have been taken out—this sweep may be used to order the pair against liquidity, favoring bearish continuation.
📈 Trading Plan:
Entry Strategy
Monitor lower timeframes (e.g., M15 and below) for bearish confirmation setups within or near the bearish order block.
Target Objective
Our draw on liquidity remains the liquidity pool located at deeper discount levels, in alignment with the prevailing short bias.
For a detailed market walkthrough and in-depth execution zones, be sure to watch this week’s Forex Market Breakdown:
Stay disciplined, trust your confirmations, and manage your risk wisely.
Kind regards,
The Architect 🏛️📉
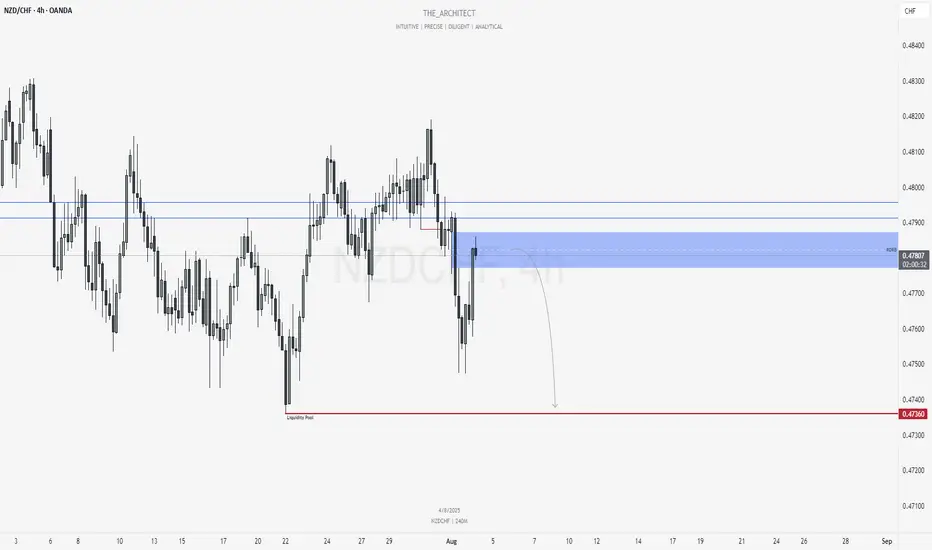
NZDCHF: Bearish Continuation from Re-Delivered Re-Balanced ArrayGreetings Traders,
In today’s analysis of NZDCHF, recent price action confirms the presence of bearish institutional order flow. As a result, we aim to align ourselves with this directional bias by identifying strategic selling opportunities.
Key Observations on H4:
Bearish Market Structure Shift: The H4 timeframe has recently confirmed a bearish shift in market structure, providing us with a clear framework to seek short setups in line with institutional momentum.
RDRB Resistance Zone: Price has retraced into a Re-Delivered Re-Balanced (RDRB) array—an area where prior institutional selling took place and has now been re-engaged. This region is expected to serve as resistance, offering a high-probability zone for confirmation entries to the downside.
Trading Plan:
Entry Strategy: Monitor lower timeframes (M15 and below) for bearish confirmation setups within the RDRB array.
Target Objective: The current draw on liquidity remains the liquidity pool residing at deeper discount levels, which aligns with our short bias.
For a detailed market walkthrough and in-depth execution zones, be sure to watch this week’s Forex Market Breakdown:
As always, stay disciplined, wait for clear confirmations, and manage your risk responsibly.
Kind regards,
The Architect 🏛️📉
August 3, Forex Outlook: High-Reward Setups You Need to See Now!Welcome back, traders!
In today’s video, we’ll be conducting a Forex Weekly Outlook, analyzing multiple currency pairs from a top-down perspective—starting from the higher timeframes and working our way down to the lower timeframes.
Pairs to focus on this Week:
EURUSD
USDCAD
EURGBP
EURJPY
GBPCHF
USDCHF
NZDCHF
EURNZD
Our focus will be on identifying high-probability price action scenarios using clear market structure, institutional order flow, and key confirmation levels. This detailed breakdown is designed to give you a strategic edge and help you navigate this week’s trading opportunities with confidence.
📊 What to Expect in This Video:
1. Higher timeframe trend analysis
2. Key zones of interest and potential setups
3. High-precision confirmations on lower timeframes
4. Institutional insight into where price is likely to go next
Stay tuned, take notes, and be sure to like, comment, and subscribe so you don’t miss future trading insights!
Have a great week ahead, God bless you!
The Architect 🏛️📉

EURGBP: Bearish Continuation from Reclaimed Order Block!Greetings Traders,
In today’s analysis of EURGBP, we observe that institutional order flow on the H4 timeframe has recently shifted bearish. This provides us with a clear directional bias to look for shorting opportunities in line with the prevailing higher timeframe trend.
Higher Timeframe Context:
On the weekly timeframe, price action is currently drawing towards a Weekly Fair Value Gap (FVG). This bearish draw on liquidity confirms the macro-level bearish sentiment. With the recent bearish market structure shift (MSS) on the H4, we now have strong confluence between the weekly and intraday order flow, favoring continued downside.
Key Observations on H4:
Reclaimed Bearish Order Block: After shifting structure to the downside, price has retraced into a bearish reclaimed order block—a region previously marked by institutional selling. This return to the origin of prior sell-side imbalance offers institutions the opportunity to mitigate earlier positions and reinitiate shorts. The failure of price to break higher confirms bearish intent.
Confluence with Weekly Draw: The reclaimed order block aligns with the broader draw towards the weekly FVG, providing an optimal zone for bearish confirmation entries.
Trading Plan:
Entry Strategy: Look for lower timeframe confirmation entries within the H4 reclaimed order block.
Target: The short-term target remains the Weekly Fair Value Gap, supporting a discount-side delivery.
As always, remain disciplined in execution. Let the market confirm your bias before entering, and manage risk according to your rules.
For a detailed market walkthrough and in-depth execution zones, be sure to watch this week’s Forex Market Breakdown:
Kind Regards,
The Architect 🏛️📉

July 29, Forex Outlook : High-Reward Setups You Shouldn’t Miss!Welcome back, traders!
In today’s video, we’ll be conducting a Forex Weekly Outlook, analyzing multiple currency pairs from a top-down perspective—starting from the higher timeframes and working our way down to the lower timeframes.
Pairs to focus on this Week:
USDJPY
AUDJPY
CADJPY
EURGBP
GBPCHF
USDCHF
NZDCHF
EURNZD
Our focus will be on identifying high-probability price action scenarios using clear market structure, institutional order flow, and key confirmation levels. This detailed breakdown is designed to give you a strategic edge and help you navigate this week’s trading opportunities with confidence.
📊 What to Expect in This Video:
1. Higher timeframe trend analysis
2. Key zones of interest and potential setups
3. High-precision confirmations on lower timeframes
4. Institutional insight into where price is likely to go next
Stay tuned, take notes, and be sure to like, comment, and subscribe so you don’t miss future trading insights!
Have a great week ahead, God bless you!
The Architect 🏛️📉

Weekly Trade Outlook | Lessons in Discipline, Risk & PerspectiveGreetings Traders,
In today’s video, I’ll be walking you through my end-of-week trade outlook, breaking down every setup I took throughout the week. This session is designed to offer insight into how I apply risk management, trading rules, and maintain psychological discipline in real-time market conditions.
Whether you're struggling with emotional trading, inconsistency, or overtrading, this video will give you a fresh perspective on how structure, faith, and discipline can shape a sustainable trading approach.
Remember: respect your trading rules, pray over them daily, and ask God for the strength to remain disciplined—so you don’t become your own worst enemy in the market.
Let’s grow together,
The Architect 🏛️📈

AUDJPY: Bullish Structure Shift Signals Institutional Buy ZoneGreetings Traders,
In today’s analysis of AUDJPY, we observe a recent bullish market structure shift (MSS), signaling potential for continued upward movement. With this in mind, we aim to capitalize on buying opportunities at key institutional points of interest to target higher premium prices.
Higher Timeframe Context:
The weekly timeframe maintains a clear bullish narrative. This long-term bias is now supported by a bullish MSS on the H4 timeframe, offering strong confluence and alignment across both macro and intermediate structures. This increases our confidence in expecting further bullish continuation.
Key Observations on H4:
Weekly Fair Value Gap (FVG) Support: Price recently pulled back into a weekly FVG and has rebalanced that inefficiency. This reaction aligns with the H4 MSS, reinforcing the weekly FVG as a strong institutional support zone.
Reclaimed Bullish Order Block: After the MSS, price retraced into a bullish reclaimed order block—an area where previous institutional positioning occurred. Since price has now reclaimed this level, it becomes a high-probability zone for renewed buying interest in the direction of the dominant trend.
Lower Timeframe Confirmation: This reclaimed order block will serve as our primary zone of interest to seek confirmations on the lower timeframes for precise entries.
Trading Plan:
Entry Strategy: Wait for bullish confirmation within the reclaimed H4 order block zone before entering long positions.
Target: The primary objective is the H4 liquidity pool situated at premium prices, which the market is likely to be drawn toward.
For a detailed market walkthrough and in-depth execution zones, be sure to watch this week’s Forex Market Breakdown:
As always, execute with discipline and align your trade management with your overall plan.
Kind Regards,
The Architect 🏛️📈

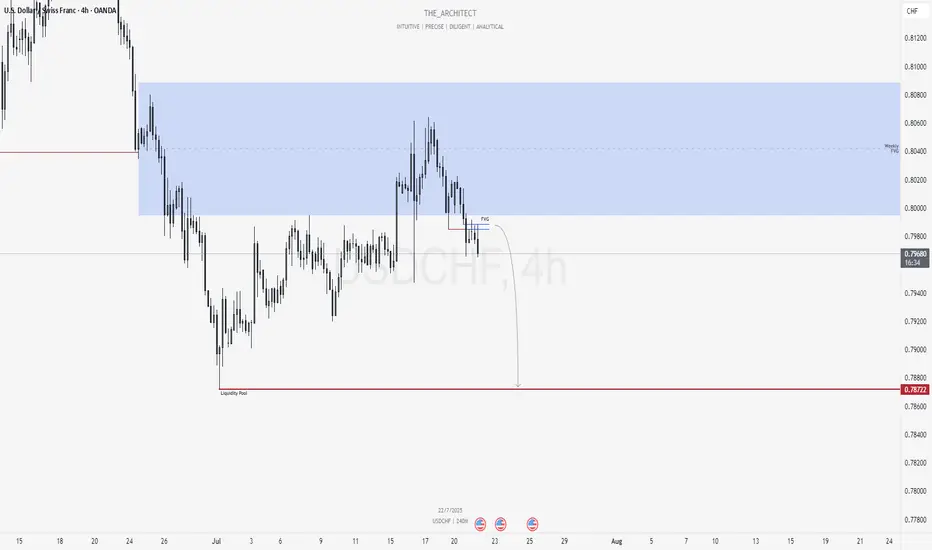
USDCHF: Bearish Shift Offers Premium Selling ZonesGreetings Traders,
At present, USDCHF is exhibiting a clear shift in institutional order flow toward the bearish side. In response, we aim to align with this directional bias by identifying high-probability selling opportunities within premium price zones.
Higher Timeframe Context:
The weekly timeframe remains bearish, offering a macro-level bias. Price recently pulled back into the weekly Fair Value Gap (FVG), a key internal range area. With this retracement complete, we now expect the market to begin its delivery toward external liquidity pools located in discounted price zones.
Key Observations on H4:
Market Structure Shift (MSS): USDCHF has recently presented a bearish MSS on the H4, confirming a change in the internal structure and further validating the bearish narrative.
H4 Fair Value Gap Rejection: Following the MSS, price retraced into a newly formed H4 FVG. This area now serves as a short-term institutional resistance zone.
Sell Opportunity Zone: This H4 FVG provides a valid zone to seek confirmation-based entries on the lower timeframes (e.g., M15), with the objective of targeting downside liquidity.
Trading Plan:
Entry Strategy: Look for short setups via confirmation on the M15 timeframe within the current H4 FVG zone.
Targets: Focus on internal liquidity pools within discounted price levels, with the broader objective being the external liquidity resting beneath recent swing lows.
For a detailed market walkthrough and in-depth execution zones, be sure to watch this week’s Forex Market Breakdown:
Kind Regards,
The Architect 🏛️📉
BTC/USDT | Trade Analysisbitcoin trade analysis.
expecting saturday , sunday bearish candle.
maybe they make 1 more higher high which in on around 107500 but less chance of it.
that's why i see short on around 104500.
currently i am expecting 9800 but lets see whts happen.
i don't on rely on technical i see the whole over all world market before making any trade.
but thats not a financial advice take trade on your own risk!

AGAIN WITH EURNZD, IS THIS A REVERSAL OR A PULL BACK?EURNZD is currently making a channel move on the 1h which indicates a pull back to previous weekly close. now we are looking for price reaction at 1.79500, a double top forming at this zone will indicate the coming in sellers to drive the price lower. this trade can make as much as 1:7. LOOKING for price to for an engulfing candle on the 1h and 4h or a pin bar candle on the 1h and 4h from this price level. 1.79500 is a key levle.

NIO (NIO): 55% Increase but Bearish Trends Still LoomA while back, we analyzed NIO, and recently, we’ve seen a considerable 55% increase in the stock price. However, despite this rise, nothing truly convinces us that this bearish trend has ended or that a sustainable upward movement is underway.
The critical factor here is that none of the key levels that need to be breached for a trend reversal have been crossed. Specifically, we’re looking at the current Wave ((iv)) level around $6.04. If this level isn’t breached, it’s likely that we could see further declines, possibly dipping into the $2.99 range—or even lower, potentially as far as $1. It may seem dramatic, but considering NIO has already dropped up to 62% since January, repeating such a decline isn’t out of the question.
In conclusion, the market remains quite weak, and we’re still cautious about the possibility of more significant setbacks. Always remember, it’s okay to stay on the sidelines and not invest in everything that catches your eye. 🤝

WIPRO - The IT sector pick with Minimal Downside Risk!Overview:
- Entry Point: Current Market Price (CMP) 475
- Target: Around All-Time High (ATH) 740
- Risk-Reward Ratio: With a downside risk of just 10% and aiming for a 50% upside, this trade offers an impressive 1:5 RR ratio.
Aiming for a significant upside with well-managed risk. Let's see if we can capture this opportunity right!
Stay tuned for updates and trade safely! Happy trading!
Disclaimer: This is NOT a buy/sell recomendation. This post is meant for learning purposes only. Please, do you due diligence before investing.
Thanks & Regards,
Anubrata Ray

IRCTC - Ready for a HUGE move? Aiming around 80%+ gains! IRCTC is set to double once it clears key resistance levels!
---
Weekly TF View:
Here's the plan:
- Critical Level: Watch for a daily candle close above ₹1000. This signals the first entry point around ₹1027.
- All-Time High Alert: If the weekly candle closes above ₹1300, prepare for a potential Marubozu candle, indicating strong bullish momentum. This will be our second entry point.
- Strategy: Entering before the breakout to catch the bottom. Remember, risk management is crucial. The market is supreme; we adapt.
- Price is bouncing from the important fibonacci support area. Showcasts buyers are strong!
Let’s wait and watch the show unfold!
---
Stay tuned for updates as IRCTC approaches these critical levels. Happy trading!
Disclaimer: This is NOT a buy/sell recomendation. This post is meant for learning purposes only. Please, do you due diligence before investing.
Thanks & Regards,
Anubrata Ray
