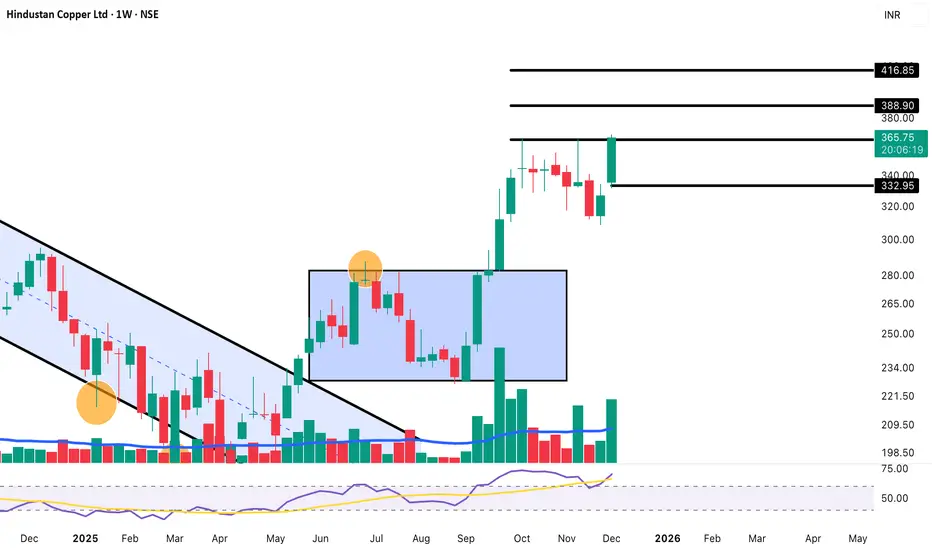
Hindustan Copper – Weekly Chart Analysis Professional Breakdown✔️ Buy Range
₹360 - ₹365
Or first green candle after pullback
🛑 Stop Loss
₹330 (Weekly SL)
🎯 Targets
T1 ₹388
T2 ₹402
T3 ₹416–₹420
T4 ₹450+ breakout possible
Disclaimer: For educational purposes only. Not SEBI registered.
Hindustancopper
Hindustancopper bullish hai strong bullishHi every one hindustan copper strong bullish hai
uptrend me hai
so you can find buy opportunity whenever you want

Hindustan Copper- Bullish | 25% growth expectedThe price was consolidating in an Inverse head and shoulder pattern near the daily support areas.
The price broke out of the neckline, which is the first sign of bullishness. After the breakout on 2/5/23, the next day price even retested the neckline which confirms the pattern breakout. On 4/5 price advanced further and now facing resistance near 108 horizontal resistance and 200dma.
Once daily closes above 200dma and 108.5-109 horizontal resistance, go long.
Stop Loss- Below the lows of breakout candle with some buffer.
Targets
1. 121
2. 131
Remember to keep trailing your stop loss and move stop loss to entry once Target 1 is achieved.
Also, do follow Risk management and Position Sizing.

HINDUSTAN COPPERDay chart of hindustan copper in which support and resistance is trendline above 125 level it can be bullish and below 100 level it can be bearish let's see in which side it give momentum.
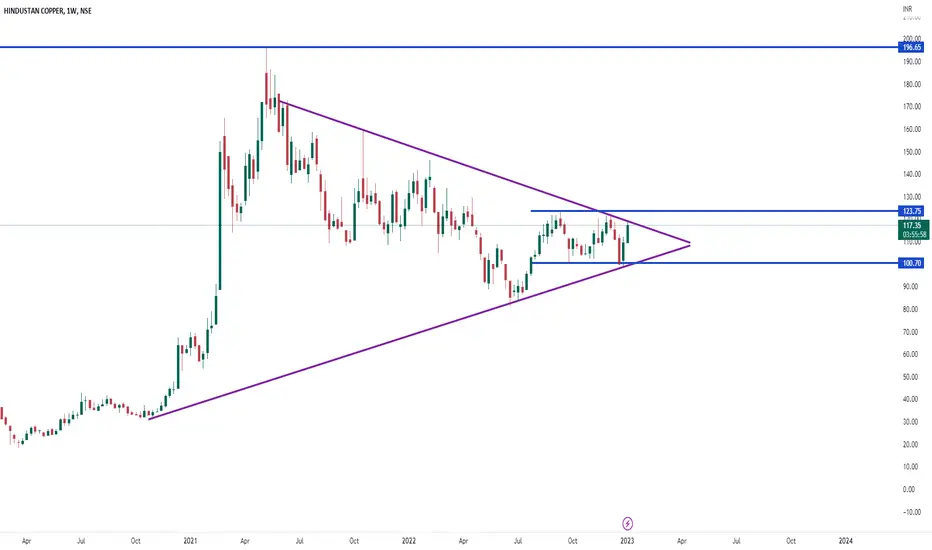
Hindustan Copper Mean (EMA) Diversion on Daily time frame*Hindustan Copper*
Time Frame: Daily
Observation:
* Rounding Bottom Formation
* Mean (EMA) Diversion on Daily time frame
Resistance/Target: 134 155 175 187
Support: 108 102

HINDUSTON COPPER EQUITY levels ...27/07/2021 (D candle) HINDUSTON COPPER EQUITY levels ...27/07/2021 (D candle)

