Hindcopper If we look at the share price forecast of Hindustan Copper Share Price Target 2025, the 1st Share Price Target is ₹520 and the 2nd Share Price Target is ₹695
Note!!
(no buy or sell recommendations )
Next report date
—
Report period
—
EPS estimate
—
Revenue estimate
—
3.05INR
2.95 BINR
17.17 BINR
327.41 M
About HINDUSTAN COPPER
Sector
Industry
CEO
Ghanshyam Sharma
Website
Headquarters
Kolkata
Founded
1967
ISIN
INE531E01026
FIGI
BBG000DFQP52
Hindustan Copper Ltd. engages in the exploration, exploitation, and mining of copper and copper ore. Its products include cast copper rod, copper cathode, copper concentrate, copper sulphate, sulphuric acid, reverts, anode slime, and nickel hydroxide. The company was founded on November 9, 1967 and is headquartered in Kolkata, India.

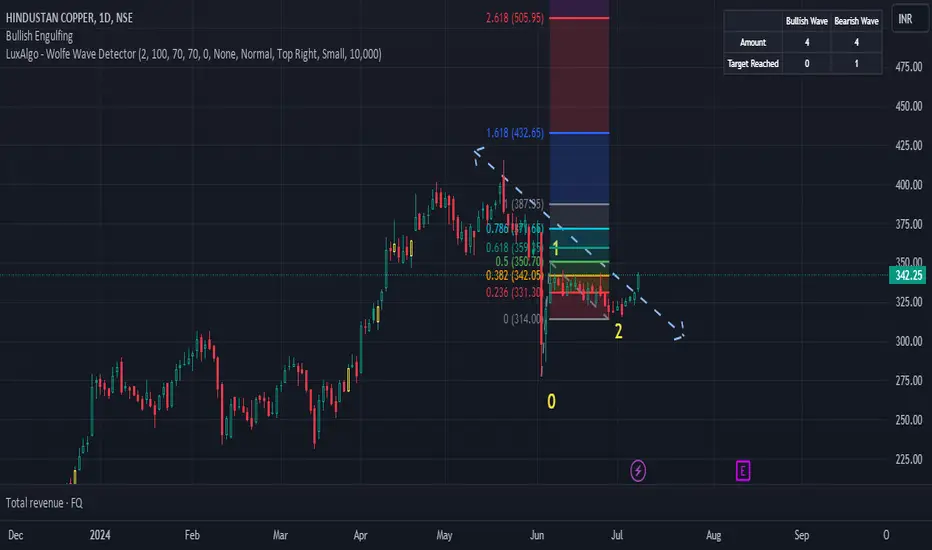
HINDCOPPERHi guys,
In this chart i Found a Demand Zone in HINDCOPPER CHART for Positional entry,
Observed these Levels based on price action and Demand & Supply.
*Don't Take any trades based on this Picture.
... because this chart is for educational purpose only not for Buy or Sell Recommendation..

Hindcopper If we look at the share price forecast of Hindustan Copper Share Price Target 2025, the 1st Share Price Target is ₹520 and the 2nd Share Price Target is ₹695
Note!!
(no buy or sell recommendations )

Hindustan copper may break all time highHindustan copper can double from here with in a year. Sl below the trend line.
Chart is self explanatory. Please follow the price action & take the trade as per your appetite.
The information provided here is only for educational purpose. The information provided here is not intended to be any kin

Hindustan Copper Rally StartedHindustan Copper NSE:HINDCOPPER rally has been started and 1st Traget would be 383 and this can extend upto 428(If you are ready to take risk using GTT).
Hindustan copper in flag and poleHindustan copper is making a good flag on 1 hr time frame. Watchout for breakout for entry.

HINDCOPPER LongNSE:HINDCOPPER1! looking strong at this point with the formation of Cup Handle pattern with justified volume support.
Obviously the SL point is too much but for that I would say this is the price level we can expect in down market.
Disclaimer: This is the idea I am sharing for knowledge pur

multiyear breackout HCL bullish flag pattern ### Chart Analysis
The chart provided is a monthly candlestick chart for Hindustan Copper (NSE:HINDCOPPER). Here's a detailed breakdown:
1. **Price Movement:**
- **Current Price:** 332.95 INR, down by 6.45%.
- **Historical High:** The chart shows a significant peak around 2012 and another ma

HINDCOPPER Swing LONGFor educational purposes only
Enter a long position when the price closes above 402. Set the stop loss at 354.9.
This is not a buy/sell recommendation.

HindCopper19/05/2024
Hind Copper
CMP: 388.25
If closed above 402
Target: 10 to 30 %
SL: 3 to 5 % or as per risk
Information is only for study purpose

See all ideas
Trade directly on the supercharts through our supported, fully-verified and user-reviewed brokers.


Frequently Asked Questions
The current price of HINDCOPPER is 315.40 INR — it has increased by 2.10% in the past 24 hours. Watch HINDUSTAN COPPER stock price performance more closely on the chart.
Depending on the exchange, the stock ticker may vary. For instance, on NSE exchange HINDUSTAN COPPER stocks are traded under the ticker HINDCOPPER.
HINDCOPPER stock has fallen by 0.79% compared to the previous week, the month change is a 4.42% fall, over the last year HINDUSTAN COPPER has showed a 148.44% increase.
HINDCOPPER reached its all-time high on Jan 20, 2010 with the price of 658.00 INR, and its all-time low was 18.25 INR and was reached on Mar 24, 2020. View more price dynamics on HINDCOPPER chart.
See other stocks reaching their highest and lowest prices.
See other stocks reaching their highest and lowest prices.
HINDCOPPER stock is 2.90% volatile and has beta coefficient of 0.86. Track HINDUSTAN COPPER stock price on the chart and check out the list of the most volatile stocks — is HINDUSTAN COPPER there?
Today HINDUSTAN COPPER has the market capitalization of 298.71 B, it has decreased by 2.62% over the last week.
Yes, you can track HINDUSTAN COPPER financials in yearly and quarterly reports right on TradingView.
HINDUSTAN COPPER is going to release the next earnings report on Aug 12, 2024. Keep track of upcoming events with our Earnings Calendar.
HINDCOPPER net income for the last quarter is 1.24 B INR, while the quarter before that showed 630.00 M INR of net income which accounts for 97.35% change. Track more HINDUSTAN COPPER financial stats to get the full picture.
Yes, HINDCOPPER dividends are paid annually. The last dividend per share was 0.92 INR. As of today, Dividend Yield (TTM)% is 0.30%. Tracking HINDUSTAN COPPER dividends might help you take more informed decisions.
EBITDA measures a company's operating performance, its growth signifies an improvement in the efficiency of a company. HINDUSTAN COPPER EBITDA is 5.47 B INR, and current EBITDA margin is 31.86%. See more stats in HINDUSTAN COPPER financial statements.
Like other stocks, HINDCOPPER shares are traded on stock exchanges, e.g. Nasdaq, Nyse, Euronext, and the easiest way to buy them is through an online stock broker. To do this, you need to open an account and follow a broker's procedures, then start trading. You can trade HINDUSTAN COPPER stock right from TradingView charts — choose your broker and connect to your account.
Investing in stocks requires a comprehensive research: you should carefully study all the available data, e.g. company's financials, related news, and its technical analysis. So HINDUSTAN COPPER technincal analysis shows the sell today, and its 1 week rating is neutral. Since market conditions are prone to changes, it's worth looking a bit further into the future — according to the 1 month rating HINDUSTAN COPPER stock shows the buy signal. See more of HINDUSTAN COPPER technicals for a more comprehensive analysis.
If you're still not sure, try looking for inspiration in our curated watchlists.
If you're still not sure, try looking for inspiration in our curated watchlists.