Volume Do Not Predict Price! - It Explains It!Most traders look at volume the wrong way.✖️
They expect volume to tell them where price will go next.
But volume’s real job is much more important:
Volume explains why price moved the way it did.
If you learn to read volume correctly, price action becomes clearer, not noisier.
1️⃣ Price Up + Rising Volume = Commitment
When price moves higher and volume expands, it means buyers are committed, not just reacting.
This is not random buying.
This is participation.
📈Rising volume during an impulse confirms that the move is supported by real interest, not just thin liquidity.
Strong trends are built on expanding volume.
2️⃣ Price Up + Falling Volume = Warning
When price continues higher but volume dries up, something changes.
The move still exists... but conviction doesn’t.
This often signals:
- exhaustion
- a potential pause
- or an upcoming correction
That’s when professionals stop chasing and start managing risk.
3️⃣ Sideways Price + Rising Volume = Accumulation or Distribution
This is where most traders get confused:
Price isn’t moving much, but volume is increasing.
That’s not boredom.
That’s positioning.
Large players don’t chase price.
They build positions quietly while price looks “dead.”
Breakouts that follow these zones tend to be fast and decisive, because the work was already done.❗️
4️⃣ Breakouts Without Volume Are Suspect
A breakout candle looks exciting.
But without volume, it’s just a move, not a decision.
Low-volume breakouts often lead to:
- fakeouts
- traps
- fast reversals
🏹Volume doesn’t need to explode... but it needs to confirm participation.
💡The Big Picture
Volume is not a signal by itself. It’s context.
Price tells you what happened, while Volume tells you how serious that move really was.
✔️When price and volume agree, trades feel easy.
✖️When they disagree, something important is hiding underneath.
⚠️ Disclaimer: This is not financial advice. Always do your own research and manage risk properly.
📚 Stick to your trading plan regarding entries, risk, and management.
Good luck! 🍀
All Strategies Are Good; If Managed Properly!
~Richard Nasr
Howto

Mastering Trading Psychology; Why Mindset is the toughest skillWelcome all to another post.
In this article we will dive into the process of Mastering Trading Psychology.
1) What is Trading Psychology:
Trading Psychology, it is your mindset. It is what you think, how you feel, what you need to do, what you want to do. It is a mixture of thoughts, future actions, emotions and past, present or future behaviors that influences your present self in making good, or bad decisions in the market.
It can be considered a “strategy” but leans more to a “skill” It’s about what your thought process is when you are under pressure.
Everybody, investor, gambler, trader, swing trader, day trader, scalper and holders, bring their own personalities & habits into the trading space. Whether it’s impatience, or patience, fear or greed, confidence or impulsiveness, or discipline. These mental sets determine how frequently you can follow your edge and how well you can manage wins, losses and uncertainty.
Trading psychology is the framework of the mind. It works for you or goes against you. Both are under your control to choose from. A strong, stable, clear mind keeps you going. A weak, broken, cluttered mind keeps you falling.
Ultimately, to master trading in psychology, you need to master yourself.
2) Pros and Cons of Trading Psychology:
Pros:
The pros/benefits of Trading Psychology, once it is mastered, is simple.
You understand the game. You understand the process. You understand why you lose, why you win, why manipulation takes place and why you trade it.
It is a skill that is developed through patience and perseverance along with constant practice.
Like every other skill, it demands TIME, ENERGY, and constant Trial and Error of failures, wins, adjustments and so on. It isn’t something that can be taught or learned once, except for those who learn to recognize and leverage their mental strengths & weaknesses can truly master it over time.
Cons:
Trying to master Trading Psychology means you need to LOSE. You need to experience loss after loss after loss after loss. You need to fail many times. Every time you fail, you understand how to take control of your emotions, you learn where things went wrong, you learn how to build your edge.
But it’s not always about losses, it’s about gains (wins )too. You need to maintain a stable status of emotions whether you win or lose. You can’t show anger, you can’t show excitement. Because both will come back at you with another loss.
This means you cannot allow yourself to be ruled by any emotion, positive or negative. It can be a long uncomfortable process that can take years to master. Sometimes even decades.
What makes it more challenging is that trading psychology does not exist in isolation.
Psychology outside of trading must be mastered too. How you think, act, live, every single day.
- We will explore this topic further down the article.
3) Why it is important in the trading space:
Psychology is an essential topic that must be taught and considered. Because without it, you will not succeed. Without self-control, or a strong mind, trading will become nothing more than just gambling like a slot machine.
It's a skill that many overlook. With it, you are aware of what works and what fails. It allows you to step back and re-assess the next trade instead of forcing it.
The end goal is to make money, but to even do that you first have to protect your capital. Only take A++ Set ups (High confluence/probability set ups) and avoid any traps involving emotions like: Fear of Missing Out (FOMO) or the “I just need 1 good pump” (One Big Win) Mindset.
With it being in the trading space, it gives users the ability to pause, re-assess and question your decisions on the trade you are about to take.
It helps to mention, “Is this an A++ Setup?” “Does it align with my strat, my edge, my goals?” If it does not and you decide not to take it, you save yourself a loss of capital and have made a win of improved trading psychology.
It assists you in distinguishing the difference between good/bad trades. Not on the result but the process. It keeps you grounded.
4) How to Master Trading Psychology:
Just because it is difficult & challenging, does not mean it is impossible.
First step – building discipline through consistency and structure.
Ensure you have a clear trading plan set up. One that defines your edge or can be adjusted to find your edge. Commit to following it no matter what the market is doing. Pumping, Dumping or consolidating.
Consistency in action will build mental strength.
Secondly, you must work on emotional control. Understand and be focused on how you feel when you experience fear, greed, or overconfidence. These emotions push you off your plan if you let them take over.
Each time this happens, you must log it. That way you can accumulate data and self-awareness.
With that, everyone says this. BackTEST or at least forward test you strategies extensively.
Keep a detailed journal that has a good list of questions that you must answer after each trade. Be brutally honest with yourself. Don’t hide losses because you have already hit 10 in a row. Log them all down. This way you will then be able to recognize emotional triggers and recurring patterns appearing that are holding you back.
Being able to recognise them is the first step to controlling them. OBSERVE YOURSELF.
While this takes place, you must begin to build trust in your system (strategy) and in yourself. You will see how your actions and choices line up with your plan. That way your confidence will shift from emotions to process driven.
Last one is patience. The hardest yet most critical psychological skills. Take ONLY A++ set ups, for example a set up that has 4 confluences or 5 lining up. Doing this trains your mind into avoiding impulsive behavior or falling into FOMO based environments.
To see another deep dive into mastering trading psychology, review the post below to determine which mindset you currently have. Are you a trader? Or are you a gambler.
5) How Psychology in our daily lives affects our ability to trade:
Trading Psychology is an interesting concept, but so is psychology in general.
The human mind is weak and for it to be strengthened, it takes time & self-awareness.
A weak mind won’t get you anywhere.
Psychology is not a simple one sentence definition. It can mean many things, or many situations.
It is a critical role in our life, it shapes our emotions, reactions and choices. It can lead us to self-sabotage or it can lead us to success.
If you cannot control your psychology outside of trading, you won’t be able to control it inside of trading. By this I mean daily emotions.
For example:
Imagine an individual experiences a breakout, they are sad, they are angry, they are emotionally drained and hurt. Then they go off to trade. They will LOSE.
This is because when the mind is in an uncomfortable state, it seeks a dopamine hit, and when they associate a win in trading = dopamine hit, they naturally turn towards trading. They want to feel that dopamine hit, so they can feel good again. But then they are no longer following their edge.
This destroys discipline, objectivity and focus.
This is not just tied to relationship breakups, but everything in our day to day lives. If you experience a bad day at work, failed an exam, argued with family, or facing a stressful time. If you bring unresolved emotions, thoughts and feelings into the trading space, trading just becomes a big emotional outlet.
Psychology appears in every action we do, EVERY day. “I need to drink water” I will get water. I see soda, “I now want soda.”
The mind now as switched completely from the main objective “Water” to soda. If you cannot control your mind to stick to what is right, then you will not master trading psychology.
The better control you have over yourself, & your mind, the more consistent and rational your trading decisions will become.
KEY POINTS:
1) What is Trading Psychology:
- Trading psychology is the foundation of every mental action. You must master yourself before mastering the market.
2) Pros & Cons of Trading Psychology:
- Trading Psychology cannot be mastered without failure, each loss has a lesson, that lesson is based around strengthening your mind with emotional control.
3) Why it is important in the Trading Space:
- Without a strong mind, trading turns into gambling, you must become disciplined and maintain self-control. This splits pros from the gamblers.
4) How to Master Trading Psychology:
- Right to the point: Consistency & discipline, emotional awareness, journaling, and most importantly, being patient. These are core aspects of mastering your mindset and obtaining the right psychological discipline.
5) How daily psychology affects trading:
- The way you manage your everyday emotions outside of trading mirrors the way you will end up reacting to the markets.
Control your life, then control your trades.
Psychology is a great skill, but it’s only part of 3 keys that will lead you to success. Find out the 2 other keys below:
Thank you all so much for reading - I hope this post brings a lesson into everyone's trading journey.
I am aware that this is a big long article, however Trading psychology goes even deeper - I have summarized my knowledge and research that I have obtained over time and summarized it.
Please let me know if any of you would like an a post on a specific topic.
I'd love to provide more for the community!

Understanding Psychological LevelsDefinition:
In Trading, Psychological levels are often called round numbers or psy levels.
This is because the price ends in zeros and fives naturally attracting a trader’s attention.
Examples:
• Forex: 1.0000, 1.0500, 1.1000
• Stocks: $50, $100, $150, $200, $250
• Cryptocurrency: $10,000, $15,000, $20,000, $25,000
These levels are crucial as traders instinctively see targets in round numbers. (Or Incremental levels such as 5, 10, 15, 20, 25, 30 and so on...
This causes many buy, sell, and stop orders to cluster around the same price zones, creating self-reinforcing areas of interest in the market. Again, price sits at 113.2k – Psychological level is 115k.
___________________________________________________________________________________
Why Psychological Levels Matter in Trading
1) Human Bias:
Traders and investors often place orders at simple, rounded numbers. This makes their charts and order list “Clean.”
2) Institutional Targeting:
Large groups, whales or organizations use these levels to find liquidity or trigger stops. (Eg, BTC swept 125k before dumping)
3) Market Memory:
When a Psychological level reacts, traders remember it, and it often becomes relevant again in the future. (Turns into a prev liquidity sweep.)
5) Order Clustering:
Stop losses, take profits, and pending orders frequently build up around these areas. (As above, it builds liquidity.)
__________________________________________________________________________________
How to Identify Psychological Levels
Begin with marking clean, round (or quarterly) numbers on your chart. These are often major levels such as 4.0000, 5.0000, or 6.0000.
See the example below:
Then identify the midpoints/quarter points between them, like 4.5, 5.5, 6.5, 7.5, 8.5
See the example below:
For stronger assessments, look for psychological levels that align with other forms & tools of technical confluence—such as previous S & R, Supply/Demand, Highs & Lows, Fibonacci retracements, trendlines, or volume clusters.
See the example below:
When multiple forms of technical evidence converge near a round number, the level tends to have greater impact.
__________________________________________________________________________________
Trading Around Psychological Levels
When price approaches a psychological level, three common behaviors can occur:
1) Rejection:
Price touches the level and reverses quickly, suggesting strong defense by buyers or sellers. (Liquidity Sweep)
2) Break and Retest:
Price breaks through the level, then revisits it to confirm it as new support or resistance.
3) Compression or Grind:
Price consolidates near the level before a breakout as liquidity builds up.
Practical Application:
Enable alerts slightly before major psychological levels to observe reactions in real time (for example, 4.45 instead of 4.5 ). Wait for confirmation using price action such as a clear rejection wick, an engulfing candle, or a BOS (Break of Structure). Combine this analysis with liquidity or other forms of technical tools for a stronger assessment.
__________________________________________________________________________________
Trader Behavior at These Levels
Market reactions at psychological levels are largely directed by emotion and herd (Group) behavior. Fear of missing out can push price through a round number with momentum & speed while profit-taking can trigger short-term reversals & rejections. Stop hunts are also common, where smart money briefly pushes prices beyond a round level to collect liquidity before reversing. (From 4.0 up to 4.25 then down again)
Because many traders watch these same levels, reactions often repeat, reinforcing their significance.
__________________________________________________________________________________
Example: BTC/USD for $125k
When Bitcoin approaches $125k, many retail traders view it as a significant threshold. They might place short orders just below it or stop just above. Institutions recognize this and may intentionally push prices above $125k (sweeping $126k) to trigger those stops and fill large positions.
Once that liquidity is collected, price can reverse, and the $125k area may later serve as a new resistance zone.
This type of liquidity hunt and reversal pattern occurs frequently across all markets.
__________________________________________________________________________________
Practical Tips
1) Never trade purely based on a round number. Always wait for confirmation through structure or price action. (Retests, MSS, BOS, candle patterns etc)
2) Use alerts & alarms rather than fixed lines; prices often wick slightly above or below the exact level.
3) On higher timeframes, psychological levels often act as major turning zones. On lower timeframes, they tend to attract short-term reactions. (Lower the time frame, the more reactions = constant noise)
4) Combine psychological levels with liquidity, order flow, or volume analysis for a more complete view.
__________________________________________________________________________________
Summary
Psychological levels are where human reactions and liquidity meet. They represent areas of emotional and institutional/organizational interest rather than fixed points of reversal.
By understanding how traders behave around these zones and observing how price reacts to them, you can determine key movements with greater confidence.

The 3 KEYS to Trading SUCCESSToday we will discuss about the 3 Keys I believe are required for succeeding in trading.
When you enter into the trading field, you quickly understand that it’s not just about charts and setups — it’s about mastering yourself mentally.
There are 3 keys that separate those who last from those who don’t in Trading:
( 1 ) Psychology
( 2 ) Risk Management
( 3 ) Consistency
Every single one is equally important, but how you balance them determines your long-term outcome when trading.
1 ) Psychology — Master Your Mind Before You Master the Market
Trading, the mental game disguised as a financial one displaying 1s and 0s winners and losers. The market, the charts, the currency, they do not care who you are, what you think, or how badly you want to win.
It simply exposes your strengths and weaknesses in the world of psychology .
Most traders lose, this is not because they lack knowledge, but because they cannot control their emotions, feelings — fear of losing, fear of missing out, greed after a win, hesitation after a loss, anxiety, frustration, impatience.
Every emotional outburst leads to poor decision-making: closing early, revenge trading, over-leveraging, or ignoring your plan, right after you told yourself you were going to lock in and turn $100 into $1000000.
To master psychology:
( 1 ) Detach from the outcomes/end-result. Focus on executing well, not whether a trade wins or loses. Follow your plan.
( 2 ) Think of probability. Every setup, every trade must have an edge — not a guarantee.
( 3 ) Accept losses as part of the process. Losses are tuition fees in this business. Every loss is a win, because there is a lesson to be learned.
( 4 ) Stay grounded. Journaling, mindfulness, and post-trade reflection go a long way. Keep track of trades and review them during down time.
When your mindset stabilizes, when your thoughts are calm, your trading skills become consistent. The charts don’t change — you do.
In terms of training your mindset, see my previous post below which explains the difference between a Trader and Gambler. This is an excellent article for those who want to BECOME a trader.
2. Risk Management — Protect Before You Profit
If psychology keeps your calm, risk management keeps you alive.
This is the part most traders skip — until they learn the hard way and blow their own capital, or 10 fundeds in a row.
Your number one job as a trader is not to make money. It’s to protect capital so you can focus on staying in the game long enough for your strategy and edge to play out well.
Practical risk rules:
( 1 ) Never risk more than 1–2% of your capital on a single trade. (If you do, you increase the emotions of greed)
( 2 ) Always know your max loss before entering — no guessing, if you do not? Your loss, your fault.
( 3 ) Use stop-losses logically, not emotionally. Set them at resistances or supports. Key levels.
( 4 ) Avoid over-leveraging. Leverage magnifies both wins and mistakes. Higher the leverage, higher the risk.
( 5 ) Don’t chase. Missed trades are better than blown accounts. Record them down and log emotions.
Good risk management doesn’t make you rich overnight — but poor risk management will make you broke instantly .
You don’t need huge wins to grow; you just need small, controlled losses and consistent execution throughout your trading journey.
3. Consistency — Discipline Over Drama
Consistency is the glue that holds everything together, risk management to Psychology.
It’s easy to stick to your plan for a week; but it is hard to do it for months without deviation and drifts. But that’s exactly what separates traders who make it from those who burn out.
Consistency means:
( 1 ) Showing up daily, sticking to a fixed plan of study, back testing, assessing.
( 2 ) Following your trading plan with discipline.
( 3 ) Reviewing your trades honestly — both wins and losses. (Are YOU doing THIS?)
( 4 ) Avoiding impulsive changes just because of one bad day. Take a break if the loss affects you badly.
Progress in trading is slow and often invisible. You might not notice improvements week to week but look back after six months of focused consistency — and you’ll realize how far you have come. Remember, slow and steady wins the race. This is a game of Tortoise v Rabbit. Push fast and hard and you will make mistakes – be slow and steady and you will win the race.
Stepping back to view the bigger picture
Trading success isn’t luck — it’s the result of compound discipline, calculated trades and timing.
( 1 ) Psychology gives you control.
( 2 ) Risk management gives you longevity.
( 3 ) Consistency gives you results.
When you align all three, everything starts to click.
You don’t need to master the market — just master your mindset, your risk, and your routine . The profits follow naturally.
Thank you all so much for Reading. I hope this post becomes beneficial to you!

Trader vs Gambler: Why Trading Isn’t GamblingThe Trader vs The Gambler: Why Trading Isn’t Gambling
“Trading is gambling.”
You’ve probably heard it before — from friends, family, or strangers who’ve seen a few flashy headlines, red charts, and crypto hype videos and decided: “It’s all luck.”
To most outsiders, the markets look like chaos — numbers flashing, candles flying, influencers shouting “BUY!” and “SELL!” as emotions run high.
It’s understandable that they think it’s all random chance.
But here’s the truth:
Trading can look like gambling when it’s done like gambling.
When done properly — with education, discipline, and structured risk — trading is a profession built on probability, process, and data.
What Trading Actually Is
Trading is the art and science of buying and selling assets — currencies, commodities, crypto, or stocks — to profit from price movements.
But unlike gambling, trading involves skill, timing, and measurable probabilities.
Professional traders don’t rely on hope — they rely on edges.
An edge is a repeatable setup or condition that statistically produces profits over time.
A real trader studies and uses:
- Price Action & Market Structure: Recognizing higher highs, liquidity zones, supply and demand, and where big players enter or exit.
- Technical Analysis : Tools like moving averages, Fibonacci retracements, volume profiles, VWAP, trendlines, and fair value gaps.
- Fundamental Analysis: Macro data, interest rates, inflation, earnings, tokenomics, project development, and regulatory events.
- Sentiment & Flow: Gauging crowd emotion, open interest, whale activity, and on-chain data.
- Risk Management: Strict position sizing, stop-loss placement, and capital preservation.
- Statistics & Journaling: Tracking setups, win rates, risk-to-reward, and performance over hundreds of trades.
- Discipline & Emotional Control: The ability to not trade when conditions aren’t right.
A trader doesn’t ask, “Will it go up?”
They ask, “If it goes up, what’s my risk? What’s my probability? What’s my plan if I’m wrong?”
That’s not gambling — that’s probability management.
What Gambling Actually Is
Gambling is risking money on an uncertain outcome without any control, edge, or process.
You rely purely on luck — a spin of a wheel, a flip of a card, a random move in a market you don’t understand.
The outcome is fixed against you. In a casino, the house always wins.
A gambler thinks emotionally:
“I have a feeling it’ll go up.”
“My mate said this coin’s going to explode.”
“I’ll double my bet to win it back.”
No analysis. No backtesting. No data. No control.
Just hope — the same force that keeps casinos rich and players broke.
When someone dumps $10,000 into a random altcoin because they saw a tweet or meme, that’s not trading — that’s emotional speculation.
They’re not following a plan; they’re following a crowd.
The Trader’s Mindset vs The Gambler’s Mindset
TRADER:
- Decision Basis: > Data probabilities, confluences
- Goal: > Consistent Long-term growth
- Risk Control: > Defined, Limited, Pre-set
- Emotional State: > Patient, Detached, Focused
- Reaction to loss: > Reviews plan, learns, adjusts
- Education: Studies psychology, risk, analysis
- Funding approach: > Scales up, uses funded accounts
GAMBLER:
- Decision basis:> Emotion, impulse, hype
- Goal: > Quick jackpot
- Risk control: > Undefined, often all-in
- Emotional state: > Fearful, greedy, erratic
- Reaction to loss : > Doubles down or quits
- Education: > Follows noise & influencers
- Funding approach: > Risks personal savings recklessly
A gambler sees “one trade” as the make-or-break moment.
A trader sees “one trade” as part of a thousand trades that define their edge.
Example: The Math of a Trader vs a Gambler
Trader:
Win rate: 55%
Risk-to-reward: 1:2
Risking 1% per trade
After 100 trades, they’re up roughly +55R - 45R = +10R (10% growth).
Their plan, consistency, and edge made it possible.
Gambler:
Win rate: Random, maybe 45%.
Risk-to-reward: 1:1 or worse.
Risking 10–20% per “bet.”
After a handful of losses, they’re wiped out.
There’s no math, no longevity — just emotional chaos.
This is why traders survive, gamblers vanish.
Why Trading Is Not Gambling
1. Trading Has Positive Expected Value (EV)
Gamblers play games with negative EV — odds mathematically stacked against them.
Traders create systems with positive EV by identifying patterns that statistically outperform random chance.
Example:
If your setup wins 55% of the time and earns twice what it risks, your long-term outcome will always be positive.
That’s not luck — that’s math.
2. Trading Has Risk Management
In gambling, you can lose everything on one hand.
In trading, you risk a small percentage per trade.
Professionals risk 0.5–2% of their account per setup.
That’s why they can lose 10 trades in a row and still be in the game.
Gamblers can’t — they blow up because they never manage risk.
3. Trading Uses Control and Data
You can’t “analyze” a roulette spin. You can’t manage risk at a blackjack table.
But in trading, you can backtest, strategize, and control your exposure.
Markets may be uncertain, but traders control their actions within that uncertainty.
Gambling has no such control — it’s fixed odds, rigged in favor of the house.
4. Trading Rewards Skill and Experience
The more you study, journal, and refine your process, the better you get.
No amount of practice makes you better at roulette — the wheel doesn’t care.
But trading rewards time, reflection, and discipline.
Skill matters. Patience matters. Data matters.
5. Trading Has Funding Opportunities
No casino will give you $50,000 to “gamble responsibly.”
But trading firms will give you a $50K, $100K, or $200K funded account — if you prove consistency and discipline.
Funded trading isn’t luck; it’s a business.
You’re rewarded not for profits alone, but for following rules:
- Max daily drawdown
- Overall drawdown limits
- Minimum trading days
- Profit targets
That’s structure — something gambling never has.
Why Use a Funded Account Instead of Your Own $50K?
Because professional trading is not about flexing capital — it’s about proving control.
Funded accounts are training grounds for serious traders:
- You trade with someone else’s capital.
- You’re held accountable to strict limits.
- You’re paid for consistency, not luck.
That’s professionalism.
Gambling is the opposite — no structure, no accountability, and no risk control.
A gambler risks $50K of their own money and hopes for a jackpot.
A trader risks 0.5% of a $50K funded account with a defined plan.
One burns out in a week.
The other builds a track record and earns a living.
The Reality Check: When Trading Does Become Gambling
Trading becomes gambling when:
- You trade without a plan.
- You follow hype or influencers blindly.
- You over-leverage.
- You revenge-trade.
- You skip journaling and analysis.
- You ignore stop losses.
The activity isn’t gambling — the mindset is.
A professional can take the same tool a gambler uses — the same chart, same exchange, same coin — and produce consistent returns, because their intent, process, and control are different.
Real-World Example
Two people open Bitcoin trades at $60,000.
- Trader A: Risks 1%, sets stop at $59,000, target $62,000. Reviews structure, confluences, and volume.
- Trader B: Risks 100% of his savings because “it’ll go up for sure.”
Same entry, same price.
One plays a game of probability, the other a game of hope.
One grows, one disappears.
The chart doesn’t decide who wins — their mindset does.
The Trader’s Mindset
A real trader thinks like a scientist:
- Hypothesis: If price rejects support and volume confirms, it may move up .
- Experiment: Enters small, stops defined.
- Result: Win or loss logged.
- Iteration: Reviews data, improves setup.
Gamblers don’t have hypotheses — they have feelings.
The trader’s mindset is structured:
- Plan before execution.
- Accept losses as data.
- Control risk religiously.
- Focus on consistency over excitement.
Detach emotionally from outcomes.
That’s why traders survive long-term while gamblers chase short-term highs.
“But Crypto Is Just Gambling!”
Crypto can look like gambling — because most people in it treat it like one.
They buy hype, ignore fundamentals, and chase every new shiny coin.
That’s not trading.
Real crypto traders:
- Study tokenomics, development teams, and market sentiment.
- Use technical levels and liquidity maps.
- Manage position sizes and hedge exposure.
- Treat it like a business, not a casino.
The asset class doesn’t make it gambling — your approach does.
Final Thoughts
Yes — both trading and gambling involve risk.
But risk ≠ gambling.
Risk, when managed correctly, equals opportunity .
The difference is control, process, and purpose.
A trader plays the long game with discipline and math.
A gambler plays for emotion and chance.
Anyone can click Buy.
But not everyone can manage risk, follow process, and think in probabilities.
So next time someone says:
“Trading is gambling.”
Show them this:
🎲 Gambling is random.
📊 Trading is calculated.
One depends on luck .
The other depends on discipline .
Thank you all so very much for reading this article, I enjoyed creating it and I hope it becomes of use too you.
If you have any requests on strategies, articles or would like charting done, drop a comment below.
Gold, Yields, and the Fed: How Monetary Policy Drives Markets
Few forces shape global markets more than U.S. monetary policy. The Federal Reserve’s dual mandate, maximum employment and 2% inflation is the anchor for its decisions. For traders, understanding how these objectives translate into interest rate changes is critical for positioning in gold futures and across the yield curve.
The Fed’s Dual Mandate
1. Maximum Employment: Support jobs and minimize unemployment.
2. Stable Prices (2% inflation target): Prevent runaway inflation or deflation.
The Fed balances these goals using interest rates:
• Raising rates: Cools demand, strengthens the dollar, lifts yield, weighs on gold.
• Cutting rates: Stimulates demand, weakens the dollar, lowers real yields, supports gold.
The tension lies in the trade-off: controlling inflation often hurts employment, while boosting employment risks higher inflation.
Gold and Monetary Policy
Gold is highly sensitive to real interest rates (nominal yields minus inflation):
• Hawkish Fed: Higher real yields, dollar strength, gold struggles.
• Dovish Fed: Lower real yields, weaker dollar, gold rallies.
However, given the recent surge in gold prices despite higher rates, traders must ask:
• Will gold continue rising as odds of rate cuts increase, and when they are eventually delivered?
• Is the traditional correlation between the dollar and gold futures prices breaking down?
Gold’s rally has also been driven by geopolitical tensions and rising long term yields, reflecting rising debt burdens across the globe.
Yield Curve and Monetary Policy
The yield curve reflects expectations about growth, inflation, and Fed policy.
• Short end (1M–5Y): Anchored by Fed policy rates. If markets expect hikes/cuts, the front end moves first.
• Long end (10Y–30Y): Driven by expectations for long-term inflation, growth, and Treasury supply/demand dynamics.
Typically, investors and market participants watch for the following patterns:
• Inverted curve: Short yields > long yields, often a recession signal. See last year’s yield curve.
• Steepening curve: Usually follows Fed cuts, as front-end yields drop faster than the back end.
Two Classic Scenarios
Scenario 1: Inflation Stays High, Jobs Weaken
• Fed resists cutting, prioritizing price stability.
• Gold: Consolidates or weakens (real yields elevated).
• Yield curve: While the short end stays pinned, long end could rise on higher inflation risk and increasing debt worries, signaling stagflation risk.
Scenario 2: Inflation Stabilizes, Jobs Weaken
• Fed pivots dovish, prioritizing employment.
• Gold: Breaks higher on falling real yields.
• Yield curve: Steepens as short yields fall faster than long yields.
The Policy Backdrop
Powell’s last symposium before his term ends, at the Jackson Hole appearance, Fed Chair Powell delivered a dovish pivot, highlighting rising risks to the labor market while downplaying the inflationary effects of tariffs. The reasoning behind this shift deserves its own deep dive, but for now, our focus remains squarely on how monetary policy, specifically interest rate decisions, impacts inflation, growth, supply, and demand in the U.S. economy.
What’s on the Docket Until the Next Fed Meeting (September 17, 2025)
Markets will be glued to data in the coming weeks:
• Aug PCE / Core PCE (Aug 28–29) → Fed’s preferred inflation gauge.
• Aug NFP (Sep 5) → Labor market health; weak print strengthens the case for cuts.
• Aug PPI (Sep 10) → Upstream price pressures; hot numbers signal inflation risks.
• Aug CPI & Core CPI (Sep 11) → Key headline data; softer print supports dovish case.
• Fed Decision (Sep 17) → Will Powell stress inflation vigilance, or shift toward labor concerns?
How the Charts Tie It Together
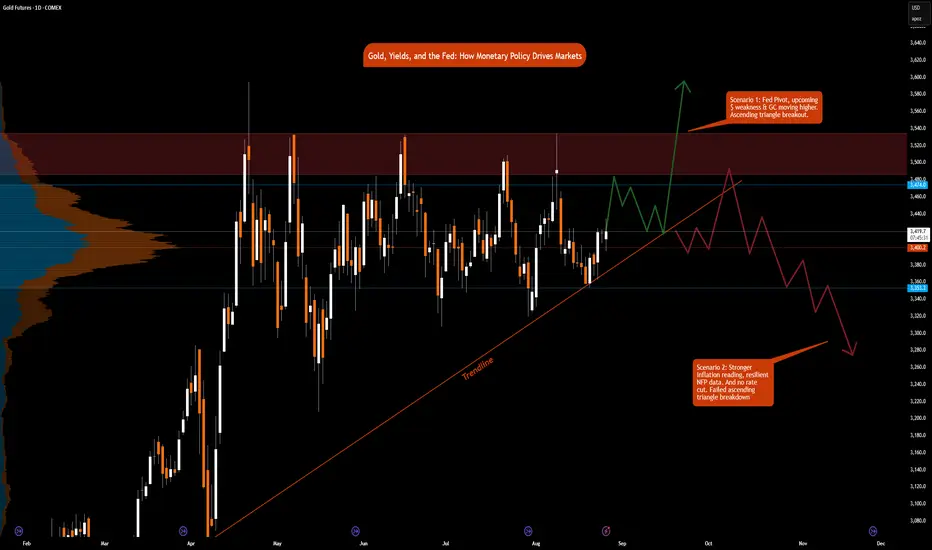
• Gold Futures:
o Ascending Triangle breakout above resistance towards $3,600, if Fed pivots dovish and deliver a rate cut or a bigger rate cut.
o Ascending Triangle breakdown toward $3,350 if inflation remains sticky and the Fed holds. In this scenario, gold remains in balance overall.
• Yield Curve:
o Short end reacts directly to Fed rate expectations.
o Long end reflects investor conviction on inflation, growth and increasing debt concerns.
Takeaway for Traders
The Fed’s dual mandate creates a constant push and pull between inflation control and employment support. Gold and the yield curve are two of the clearest real-time mirrors of that balancing act:
• Watch short-term yields and gold to gauge how markets are pricing the Fed’s next move.
• Watch the long end of the curve to see whether investors believe inflation is truly anchored.
By linking economic data → Fed mandate → asset price response, traders gain a roadmap that works not just for this Fed meeting, but for every one that follows.
In our next educational blog we will briefly explore other policy tools used by the Fed i.e., QE and QT. Quantitative Easing and Quantitative Tightening.
FRED:FEDFUNDS ECONOMICS:USINTR
CME_MINI:ES1! CME_MINI:MNQ1! CME_MINI:NQ1! COMEX:GC1! MCX:GOLD1!
CBOT:ZB1! CBOT:ZN1!
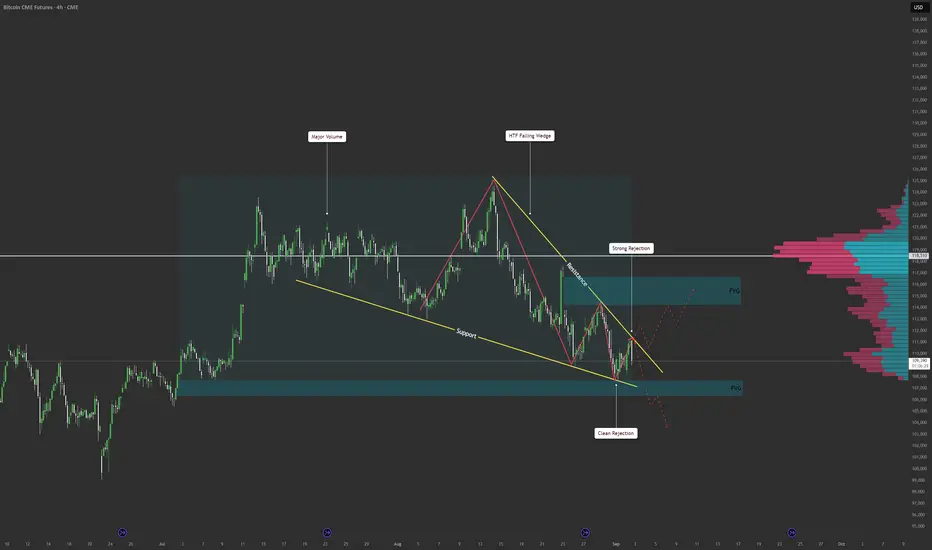
BTC Futures – Falling Wedge Break Incoming? | 4H AnalysisBitcoin CME Futures is currently trading inside a falling wedge on the 4H timeframe.
We’re sitting at a key decision point, with liquidity both above and below.
Volume profile shows strong resistance, with a large high-volume node.
Support has held, with a clean rejection and demand showing up.
Fair Value Gaps (FVGs) are left above and below acting as magnet zones.
This setup leaves us with two clear scenarios:
Bullish Scenario 🟢
Breakout above wedge resistance
Reclaim 110K as support
Target 112K–118K FVG for liquidity fill
If momentum holds, possible test of 120K resistance zone
Bearish Scenario 🔴
Failure to break wedge resistance
Breakdown under 107K support
Target 97K–100K FVG as downside liquidity
Deeper rejection could extend to mid-90K levels
⚠️ No trade bias until price confirms direction. Waiting for a break + retest is key here.
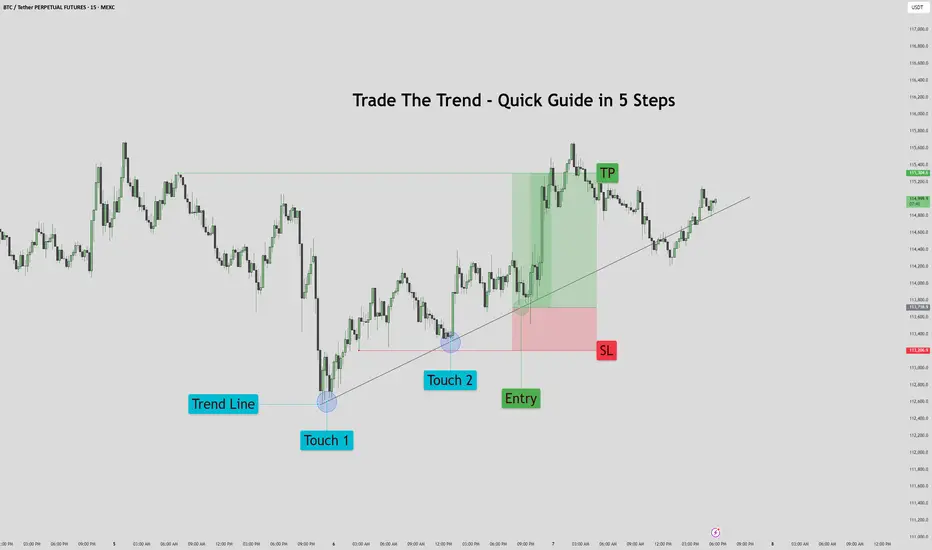
Trade The Trend – Quick Guide In 5 StepsWhat is Trading the Trend?
Trading the trend means buying when the market is going up, and selling when it’s going down.
You're following the direction of the market, not fighting it.
If the trend is up:
Price makes higher highs and higher lows
You look for chances to buy (go long)
If the trend is down:
Price makes lower highs and lower lows
You look for chances to sell (go short)
Why it works:
You’re going with momentum
Simple rule:
Buy in an uptrend, sell in a downtrend — never trade against the flow
1. Assess the chart. Where is it headed? It's headed up.
2. Place your trend line by connecting the first two points.
3. Let the chart play out for a bit. Afterwards prepare your entry on previous failed trend line retest. Set your stop loss below the previous trend line retest, and your TP just before the previous sweep above.
4. Proceed to let the chart play out, then set your pending order.
5. Watch the Trade enter and play out with patience.
This method works for bearish trends as well, just reversed.
If you would like to see more 5 step guides, comment down below.
Thank you!
Support & Resistance – Quick Guide In 5 StepsSupport and resistance are key concepts in technical analysis that help traders identify where price is likely to react.
Support acts like a floor — a level where buying interest is strong enough to prevent further declines.
Resistance acts like a ceiling — a level where selling pressure can stop price from rising.
These zones often lead to bounces, reversals, or breakouts, and are used to plan entries, exits, and stop-losses.
How to Identify them:
1. Assess the chart.
2. Identify Swing Points: Look for repeated highs/lows and label them. (Flags)
3. Multiple touches: Highlight the zones with multiple touches. 2+ Touches are stronger.
4. Define: Clearly define the zones. Above is resistance, below is support.
5. Entry: When price makes it way down to support, wait for the reversal. Upon reversal enter on the low time confirmation. Ensure price has failed to break below the support.
Then set TP to the previous High/Resistance zone.
Tips:
Always treat S&R as zones, not exact lines.
Combine with trend, candlestick patterns, or volume for better confluences.
Avoid trading into strong S/R — wait for breaks or retests.

TRX coin look good to go upentry 0.13455
SL 0.13386
TP 1:1
LIVE TRADING,INTRADAY,CRYPTO,stock market,how to trade,livetrading,trading,forex,forextrader,update,live,tecnical,annalys,market,stratgy,tecnical annalys,fundamental,education

QUICK AND EASY WAY TO MAKE A CHART (GAPS) - PLTRIF your an advanced trader and good at charting, you likely won't find this information useful. In the future, I'll have more educational posts that go in depth, but this one is for the newbies.
STEP 1 - Find your gaps (circled in blue) ONLY MARK GAPS THAT HAVE YET TO CLOSE
STEP 2 - MARK your GAPS with a Horizontal Line (alt + h)
STEP 3 - DUPLICATE your Horizontal lines (CTRL + CLICK each line while holding ctrl to multi select lines, CTRL + SHIFT + CLICK AND DRAG to duplicate)
STEP 4 - These are now your long term trading zones (COLOR Lines accordingly, TIP - Try not to pick colors that blend together) red and green do not mean buy/sell, they mean top of the gap, and bottom of the gap, 4.22% or so... It doesn't need to be exact.
STEP 5 - Line thickness (IF multiple lines stack up, you can create a thick line to simplify chart. KEEP IT SIMPLE, REMEMBER, this is not to be exact, this is to create zones to prepare you for future movements based on past gaps)
Why is this useful? Well, if you know a price gap is statistically likely to close, then you can be pretty certain that at some point in the future, that gap will close, meaning price will return to @ or above the price gap.
With this in mind, you can plan ahead and start to realize when your emotions are getting the best of you.
This is also great because you can do this on any time frame with candles.
Why ISNT this useful? Well, this gives you no indication of timing. Past results don't guarantee future results. AND this gives you no indication of current price action. In other words, a GAP could form and close 2 years later, and the entire time before it closes, price keeps going lower and lower.
Good luck, and remember, this is just a quick and easy way for newer users to identify potential price targets, while limiting emotion in decision making.

CHFJPY Short Analysis + Trade IdeaCHFJPY 4HR Analysis + Trade Idea by OfficialKieranTrewick
Looking for a 4HR fractal pivot rejection off 170.750-171.000 to provide good entries for shorts down to 169.500 - 167.000, The daily trend is very strong with chfjpy ongoing since 2021 and with multiple recent rejections off the latter side it seems it may be loading up for the surge into ATNH but with how strong of a resistance there has been at 171.500 i am not sure if this will be anytime soon, and with how strong the trend has been there is definitely room for some exhaustion down to 165-163 without affecting any long term market structure.
Currently where the inner trend meets the underside of the largescale trend within a large range zone block trapped between 50% and a strong resistance level, the key here is just patience and waiting for the right confirmations to play out.
On friday I already entered a short position with my VIP group from around 170.850 with various take profits levels down to 170.750, 170.500, 170.250, and 169.250.

Gold xauusd Intraday Signal 21-11-23R3 LRS 2003-2008
R2 MRS 1990-93
R1 HRS 1980-83
S1 HRB 1970-73
S2 MRB 1957-60
S3 LRB 1938-43
These are the Supports and Resistances for the Intraday based on H1 Fibo levels combined with larger time frames SNRs.
FOR DETAILS ON HOW TO AND WHERE TO TAKE AN ENTRY. PLEASE VISIT MY PROFILE TO GET THE VIDEO LINK FOR FREE

Gold xauusd Intraday Signal 20-11-23R3 LRS 2003-2008
R2 MRS 1993-98
R1 HRS 1983-88
S1 HRB 1973-78
S2 MRB 1953-58
S3 LRB 1933-38
These are the Supports and Resistances for the Intraday based on H1 Fibo levels combined with larger time frames SNRs.
FOR DETAILS ON HOW TO AND WHERE TO TAKE AN ENTRY. PLEASE VISIT MY PROFILE TO GET THE VIDEO LINK FOR FREE

Gold xauusd Intraday Signal 17-11-23R3 LRS 2008-2003
R2 MRS 1993-98
R1 HRS 1983-88
S1 HRB 1973-68
S2 MRB 1963-58
S3 LRB 1953-48
These are the Supports and Resistances for the Intraday based on H1 Fibo levels combined with larger time frames SNRs.
FOR DETAILS ON HOW TO AND WHERE TO TAKE AN ENTRY. PLEASE VISIT MY PROFILE TO GET THE VIDEO LINK FOR FREE

Gold XAUUSD Intraday Signal 14-11-23R3 LRS 1988-93
R2 MRS 1968-73
R1 HRS 1948-53
S1 HRB 1938-43
S2 MRB 1928-33
S3 LRB 1918-23
These are the Supports and Resistances for the Intraday based on H1 Fibo levels combined with larger time frames SNRs.
FOR DETAILS ON HOW TO AND WHERE TO TAKE AN ENTRY. PLEASE VISIT MY PROFILE TO GET THE VIDEO LINK FOR FREE

Gold XAUUSD Intraday Signal 13-11-23R3 LRS 1988-93
R2 MRS 1968-73
R1 HRS 1948-53
S1 HRB 1938-43
S2 MRB 1928-33
S3 LRB 1918-23
These are the Supports and Resistances for the Intraday based on H1 Fibo levels combined with larger time frames SNRs.
FOR DETAILS ON HOW TO AND WHERE TO TAKE AN ENTRY. PLEASE VISIT MY PROFILE TO GET THE VIDEO LINK FOR FREE

Gold XAUUSD Intraday Signal 07-11-23R3 LRS 2018-23
R2 MRS 2003-08
R1 HRS 1988-93
S1 HRB 1978-83
S2 MRB 1968-73
S3 LRB 1953-58
These are the Supports and Resistances for the Intraday based on H1 Fibo levels combined with larger time frames SNRs.
FOR DETAILS ON HOW TO AND WHERE TO TAKE AN ENTRY. PLEASE VISIT MY PROFILE TO GET THE VIDEO LINK FOR FREE

Gold XAUUSD Intraday Signal 06-11-23R3 LRS 2018-23
R2 MRS 2003-08
R1 HRS 1988-93
S1 HRB 1978-83
S2 MRB 1968-73
S3 LRB 1953-58
These are the Supports and Resistances for the Intraday based on H1 Fibo levels combined with larger time frames SNRs.
FOR DETAILS ON HOW TO AND WHERE TO TAKE AN ENTRY. PLEASE VISIT MY PROFILE TO GET THE VIDEO LINK FOR FREE

Gold XAUUSD Intraday Signal 03-11-23R3 LRS 2018-23
R2 MRS 2003-08
R1 HRS 1983-88
S1 HRB 1978-83
S2 MRB 1968-73
S3 LRB 1953-58
These are the Supports and Resistances for the Intraday based on H1 Fibo levels combined with larger time frames SNRs.
FOR DETAILS ON HOW TO AND WHERE TO TAKE AN ENTRY. PLEASE VISIT MY PROFILE TO GET THE VIDEO LINK FOR FREE

Gold XAUUSD Intraday Signal 02-11-23R3 LRS 2018-23
R2 MRS 2003-08
R1 HRS 1983-88
S1 HRB 1978-83
S2 MRB 1968-73
S3 LRB 1953-58
These are the Supports and Resistances for the Intraday based on H1 Fibo levels combined with larger time frames SNRs.
FOR DETAILS ON HOW TO AND WHERE TO TAKE AN ENTRY. PLEASE VISIT MY PROFILE TO GET THE VIDEO LINK FOR FREE

Gold XAUUSD Intraday Signal 01-11-23R3 LRS 2018-23
R2 MRS 2003-08
R1 HRS 1993-98
S1 HRB 1978-83
S2 MRB 1968-73
S3 LRB 1953-58
These are the Supports and Resistances for the Intraday based on H1 Fibo levels combined with larger time frames.
FOR DETAILS ON HOW TO AND WHERE TO TAKE AN ENTRY. PLEASE VISIT MY PROFILE TO GET THE VIDEO LINK FOR FREE

gold xauusd intraday signal 31-10-23R3 LRS 2023
R2 MRS 2009 Supply Area
R1 HRS 1993 SNR
S1 HRB 1993 SNR
S2 MRB 1983 Demand Area
S3 LRB 1973 Demand Area
D1 On Support Sma200 1933
W1 On Support Sma44 / 1934
MN On Support 23.6.0% / 1973 On Resistance 0.0% / 2085
SELL> 2018-23 BUY> 1993-98
OBSERVATIONS: FOR (TRADING VIEW MEMBERS) FULL DETAILS VIDEO LINK IS IN THE PROFILE
