BTC HTF new layoutNew layout format for journalling trade progress; instituting a new system of trading under mentorship.
who isnt watching 36k.
Trading Disclaimer:
All trades and ideas posted from this account, including setups, are given for educational purposes only. 95% of trades never win, and instead realize losses. Trading involves risk, there are zero guarantees that you will win any given trade, including this one or others related to it or this account. If you follow any setups, you do so at your own risk, taking full responsibility of any actions and / or outcomes. Nothing posted is to be taken as financial advice. The information and opinions presented by this account should not be construed as investment or trading advice, and is not meant to be a solicitation or recommendation to take actionable trading on any asset, cryptocurrency, securities, or any other tradable digital asset.
All content presented is for entertainment and education.
No Financial Advice.
Past performances are not a guarantee of future outcomes and or results: trading involves strategizing probabilities, there are no expectations on any given trade.
Always do your own research and consult a team of professionals from finance and law before proceeding with any type of action in personal finance.
All information provided by this account is a general market commentary and does not constitute investment advice or financial advice. None of the information communicated in this accounts tradingview publishings are financial advice and/or incentives, solicitng, advertising, manipulation tactics, and any other malicious behaviour - no, solely for entertainment purposes ONLY.
Coffee Boy of CL .
HTF

GBPJPY 2 - 6 August Outlook
1- Monthly structure still bullish even with the resistance formation at 155.63 as long we hold closes above 151 we will challenge the highs again. Anticipating August candle to wick down forming a support on Daily and 4H for testing the highs at 153.40 and above.
2- Weekly structure is bearish and a close above 153.65 will give the opportunity to continue the monthly bullish structure.
3- Daily structure still bearish with LH/LL formation, holding support above 152 will give the opportunity to challenge 153/153.65 for bullish continuation. A close back below 152, will invalidate the bullish move and a possible retest to the lows created at 149.50.
4- 4H structure solid bullish with HH/HL formation.
I've 2 Scenarios as following:
Scenario 1: Bullish
Holding support above 152 will give the opportunity to retest the 153/153.65 and with a close above will indicate that we had formed HL on daily which will target the 154/154.50.
Scenario 2: Bearish
A close below 152 will be the first sign of rejection, a lower resistance formation below will confirm the daily bearish structure continuation and the lows created at 149.50 will be in play as targets.
Also note that we have important news almost everyday for JPY and GBP, so please map the news and set alerts.
Good luck all, wishing everyone a good trading week.

30 July - GBPJPY Trade Plan 30 July - GBPJPY Trade Plan
It's Friday and End of Month so will just watch the plan and not going to trade
Session Bias: Bearish
Daily: Bullish
4H: Mixed
30m: Bearish

29 July - GBPJPY Trade Plan29 July - GBPJPY Trade Plan
Session Bias: Bullish
Daily: Bullish
4H: Bullish
30m: Bullish
News
9:30 Consumer Credit(Jun)
9:30 Net Lending to Individuals (MoM)(Jun)
9:30 M4 Money Supply (MoM)(Jun)
9:30 M4 Money Supply (YoY)(Jun)
9:30 Mortgage Approvals(Jun)
GBPJPY

Long on US30This idea shows my anticipated new all time highs on US30, The key is to get on a higher time frame, make analysis and enter on small time frame to increase the RR.
However, in this idea, the RR is almost 1:1, but if you are familiar with important market concepts you can reduce the stop and increase the RR on this trade.
I am still long on US30 until I see a confirmation for short because i see a series of All time highs on all index and after most of the retail traders will have long bias,
The much awaited crash will take place..
**This is no financial advice, Just analysis**

28 July - GBPJPY Trade Plan28 July - GBPJPY Trade Plan
Session Bias: Bearish
Daily: Bearish
4H: Mixed
30m: Bearish
- Daily formed resistance at 152.50
- 4H resistance at 152.55 is still rejecting a close above will push for retest of 153.13 /.40
- 1H solid bullish structure with support at 152.20 and 151.84
News
19:00 FOMC Statement
GBPJPY

BTC Analysis 28.07.2021 (part one)Part 2 is next.
1) HTF
2) Volume profile
3) Channels
4) Fibo (/ EW)

$LINK: Pitchfork check in#Chainlink has been respecting this log pitchfork that we've drawn for months and months now. We recently flirted with the bottom 2.0 deviation. And we're now bouncing back from pretty big previous ATH support. I'd really like to see the price get above the green box, and above that lower 1.5 prong.
I wouldn't be surprised at all to see a more clear double bottom formed on the daily? If we re-tested that lower 2.0 prong? It would probably be the exact same price as the last low?
Either way. $LINK at these prices is a generational opportunity. I wish I had more capital to invest, but I'm stacking what I can. Don't worry marines. We're literally all going to make it.

GBPJPY 5- 9 July Weekly Outlook and Trade Plan - Daily ChartGBPJPY
Previous Month : Bearish
Previous Week : Bearish
Previous Day: Bullish
Weekly : Still reacting to the formed Year High reached and the Weekly resistance formed on Jan 2018 but holding bullish weekly structure with June 21 Support formed.
Daily : Structure is solid bullish respecting every zone created during the bullish run since March 2020. currently we are holding support above daily zone low at 151.24 where price formed a solid support trying to push again to the 155 year high, but failed to hold above the broken support at 154.60 forming a lower high. On a daily short term view we are looking bearish with LL/LH formation. If we managed to close below 152.70 a retest to the lows at 151.50 is expected with more potential to extend the move down further.
A close above 154.00 will give the opportunity to test the broken support at 154.80 and 155 level. Holding support at these levels will indicate that retracement from the Year High is finished and we can expect a new year high to form after reaching 156.
4H : Structure still showing LH/LL formation which is keeping GBPJPY to the down side. With the completion of a TOL/Retest of the broken daily support at 154.20 and a resistance formation below will open for more down side.
No Major news for GBP and JPY during this week, but we have the G20 meeting on Thu and Fri, so would expect markets to have some reactions with any news coming out from there.
COT report showing GBP Longs are decreasing during the past 12 weeks while JPY Shorts are still strong. That will keep GBP/JPY to the upside.

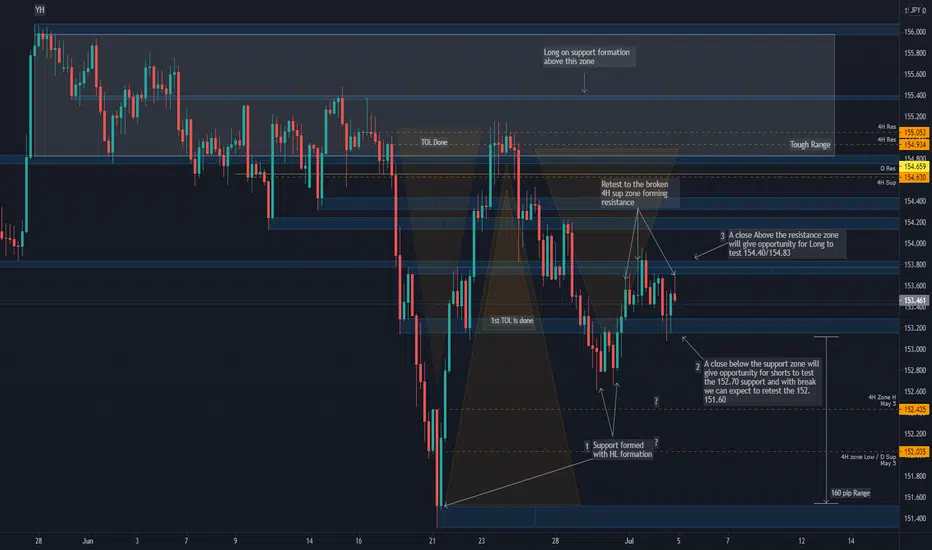
GBPJPY 5- 9 July Weekly Outlook and Trade Plan - 4H ChartGBPJPY
Previous Month : Bearish
Previous Week : Bearish
Previous Day: Bullish
Weekly : Still reacting to the formed Year High reached and the Weekly resistance formed on Jan 2018 but holding bullish weekly structure with June 21 Support formed.
Daily : Structure is solid bullish respecting every zone created during the bullish run since March 2020. currently we are holding support above daily zone low at 151.24 where price formed a solid support trying to push again to the 155 year high, but failed to hold above the broken support at 154.60 forming a lower high. On a daily short term view we are looking bearish with LL/LH formation. If we managed to close below 152.70 a retest to the lows at 151.50 is expected with more potential to extend the move down further.
A close above 154.00 will give the opportunity to test the broken support at 154.80 and 155 level. Holding support at these levels will indicate that retracement from the Year High is finished and we can expect a new year high to form after reaching 156.
4H : Structure still showing LH/LL formation which is keeping GBPJPY to the down side. With the completion of a TOL/Retest of the broken daily support at 154.20 and a resistance formation below will open for more down side.
No Major news for GBP and JPY during this week, but we have the G20 meeting on Thu and Fri, so would expect markets to have some reactions with any news coming out from there.
COT report showing GBP Longs are decreasing during the past 12 weeks while JPY Shorts are still strong. That will keep GBP/JPY to the upside.
XRP - Monthly - Log Scale WedgeHTF Pattern on this pair.
Expecting more downside to come over the next few months.
Should break out of this wedge when we have the SEC case out of the way :)

EURNZD - 31 May to 4 June 2021 Weekly Trade PlanEURNZD
This is my 31 May– 4 June 21 Week Trade Plan for EURNZD
Glad that i'm back after a long break again to my favorite habit "Charting"
Previous Month : Bearish
Previous Week : Bullish
Daily : Bullish
- After creating new high at 1.7020 resistance, EURNZD couldn't hold a support above the resistance zone 6980/7020 along with previous week news on Wednesday that leaded for more NZD strength pushing the price into the tough ranging zone 6800/6680.
- The current drop in EURNZD still holding above the solid support zone 6650/6600 which could lead to a range plays from lows to retest the highs at 7020.
- COT report still showing that NZD longs are firm and at the highest of the year and shorts are still weak, which means that i do expect EURNZD to maintain the bearish momentum and continue it's down move and any spike in price up reaching a solid resistance level/zone is going to get rejected and will give a solid opportunity for Shorts.
- Seasonality showing that NZD will weaken till mid May and strength till end of May continuing into June to create new NZD highs which will lead EURNZD to create a new low.
- Technically, i'm looking for EURNZD to still range between 7020/6650, which makes me look for longs from range lows and shorts from range highs as long no break and support/resistance formation above Sup/Res zones marked.
- On Friday, RBNZ Gov Orr will have a speech on London session open which will cause NZD to be volatile, so taking cautious at that time will be recommended.
Daily Chart:
Weekly Chart:
Monthly Chart:

XRP/USDT - Did YOU Spot the Incredible Entry?!📈These long term levels still holding in crypto.
XRP crashed down to 70 cents, a key previous resistance level several times.
A long wick was left behind as investors flocked to buy XRP back up.
We are currently testing the 1$ mark looking to push higher as the crypto resurgence continues!
Did you catch this entry?

GBP/USD - CRUCIAL Level in Price. Where are we heading?!🤔We are currently testing 1.42 yet again on this pair.
A potential long term double top formation has occurred. Will this, coinciding with the 1.42 whole level be enough to turn the tide on this pair and put USD bulls back on top?
Always zoom out to the HTF and mark key long term levels - then scale down!

LONG QSP/BTC MACRO BOTTOMHere we have a huge IH&S on QSP/BTC. I have had a phenomenal success rate with this pattern. Currently at the range low, fantastic buy for a mid/long-term swing trade. Project looks to be good with some solid backings from reputable companies.

GOLD - MonthlyTop-down analysis on this pair from Monthly to Daily.
Showing starts of a downtrend, $1500 is a round target.
Support levels below and expectations over the next few months towards the end of the year.

GOLD - DailyGetting close to the upper trendline from the Higher Time Frame analysis.
Awaiting a rejection / break of the upper trendline for confirmation.
Favoring sells on this pair.

DXY - MonthlyDollar Index Monthly Timeframe
Broke a bearish trendline at support, expecting a bullish few months for the $

XRP - MonthlyJust something I noticed on the higher timeframes with XRP
We have tapped the Dec 2017 & Jan 2018 candle body closes / open perfectly and showing a solid rejection.
$1.96 is a solid reversal zone being the 12M candle closes as well as the Monthly candle closes.
I will go into more detail about why this is a solid reversal point in the next post on the Weekly Timeframe for more confluences.
And also refer back to my previous post for the Daily Timeframe completing the analysis.
My idea is that we can easily come back to sub $0.30 after this rejection to see the Dec 2020 & Jan 2021 candle body closes / open.
More reasons as to why is the next 2 posts!


Bitcoin HTF chart.$BTC HTF chart.
The fib levels are scary accurate on the supply & demand areas
Forming a H4 bear pennant
Bunch of stops below $50k to wipe out, most likely causing another liq cascade
-0.168 perfectly aligning with the untested S/R flip at $40k
Judge for yourself.

Argument for Shorting TECK.It took me 2 hours to review 5 charts with this method of analysis. That is obviously not efficient enough, but I was really pleased with the way my ideas continually flowed into one another until I came up with a "solution". Have I created order out of this chaos? Probably not, but this is what I came up with and I'm really excited to see if it plays out. Normally, I am trying to do all of this in my head, so it felt really good to write it down on the chart for once.
Definitely need to refine this approach. From my perspective it is like if you were training to run a marathon by running for 30 miles. The marathon will never be easy, but compared to 30 miles maybe it will be achievable with regularity.
Realistically, I'm the 400/800 guy, but I prefer my suffering long and drawn out L.O.L.

GBPJPY - 5-9 April Weekly Trade PlanGBPJPY
Monthly: Bullish
Weekly Bullish
Daily: Bullish
4H: Bullish
COT:
GBP : Long 68% - Short 32% (Strong)
JPY : Long 23% - Short 77% (Weak)
Monthly: Solid bullish and with previous month close above 150.40 indicates a bullish continuation to target current monthly resistance at 155.
Weekly: Solid Bullish after 22-26 March week candle tested broken resistance 148.85 and bounced with a long nice lower wick. While last week closed solid bullish above the resistance formed at 151.62. Current weekly resistance is 153.84 April 2018 weekly candle wick then 155.
Daily: Strong Bullish momentum with close above previous resistance formed at 151.90 and with GBP is currently strong and JPY is weak from COT data that is already reflected on the chart, bullish momentum continuation is expected to extend further to target 155. Retracement should be contained within 151.90/151.
So I've 2 Scenarios for next week as following:
Scenario 1 : Looking for GJ to retrace and form a support between 152.26 and 151.84 to confirm creating a HL to extend the bullish momentum and to test highs
Scenario 2 : A failure to create a support will indicate a LH is formed and we may extend the correction to test 150.68
Weekly Trade Plan 4H Chart:
Daily Chart Outlook:
