Hype's path to $55BYBIT:HYPEUSDT.P is currently forming a wedge shape pattern, is it indicating that it will break out and follow Path A, the blue path? I'm not so sure, I am sure we'll hit $55 either way.
If we take the red path, Path B, we'll come down to some heaviy support which could give us the fuel needed to get to $55
Out of all of the oscillators I was using, all except the chop zone on the daily mind you, were in bearish mode. So logically one would choose the red Path B right?
I can't wait to see how this plays out, shall we dip some and buy some more BYBIT:HYPEUSDT.P on Path B or experience more of a continuation of the current trendline to $55?
Let me know what you think in the comments, that'ls all for today, let's go HYPE!!! straight to $55!
Hype

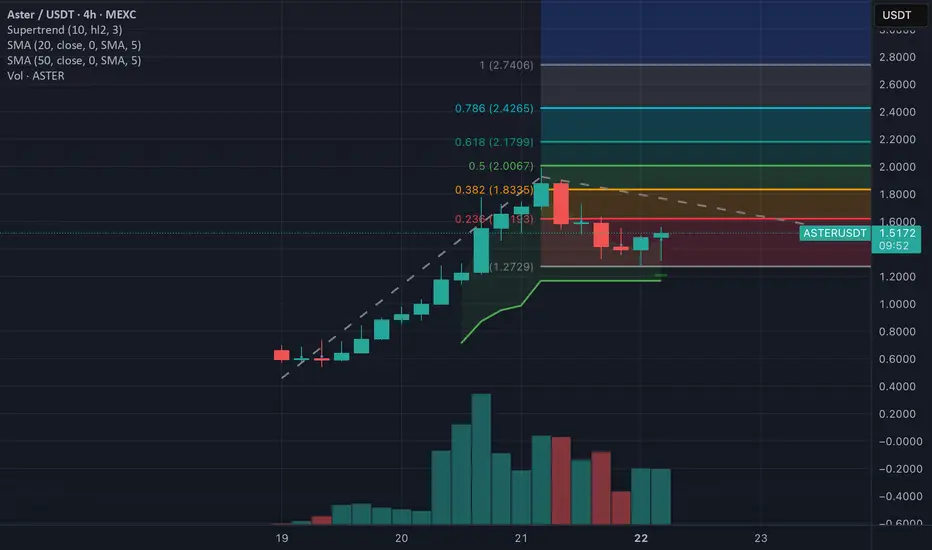
$ASTER to $4 - CZ would like thisMost of you have forgotten what happened with CAKE (biggest DEX on BSC) last cycle.
CAKE has gone from $3 million mcap to $6.6 billion mcap for 5/6 months. At that point of time biggest DEX and competitor to Pancakeswap was Uniswap which grew in the same time from $500 million mcap to $21.5 billion mcap (ATH)
Now we can see similar pattern. Just that Hyperliquid has been live already for a whole year.
-> This means BCS competitor doesn't have the same time to boost their token and will do it much faster.
Hype is trading around $17 and $20 billion mcap and there is still some time to break it's ATH mcap.
Very similar mcap as Uniswap at it's ATH moment.
Now with CZ backing personally ASTER and taking the $1000 per BNB moment, I see huge potential in the token price and both the fundamentals behind - ASTER exchange performance.
Minimum mcap of ASTER which I am looking to sell is same as in past cycle CAKE ATH mcap - $6.6 billion, which means at 1.65 billion tokens in circulation exactly $4 price per ASTER.
CZ's favourite number :)
1.65 billion tokens in circulation but if you take in consideration that 94% of total tokens are in founders hands, only 480 million tokens stay in real circulation. This means that pumping the token is much easier and needs less buy volume.
From the low info the graph gives us, we can predict the Fib levels.
HYPE Swing Long IdeaHYPE Swing Long Idea
📊 Market Sentiment
FED has resumed its rate-cutting cycle, starting with a 0.25% cut in September, with two more 0.25% cuts expected in the coming months. Additionally, institutional liquidity inflows have accelerated as the U.S. officially adopts crypto as part of its reserves. While inflation remains elevated, the weakening labor market is forcing the FED to ease, driving more capital into risk-on assets.
📈 Technical Analysis
Price broke the HTF Key Level and closed above, leading to price discovery.
It is also supported by the HTF Bullish Trendline.
Currently, price is retracing from its discovery highs.
📌 Game Plan
1-Retest of HTF Key Level at $50
2-Retest of HTF Bullish Trendline
3-Possible retrace into Fibonacci EQ (discount zone) at $47.55
🎯 Setup Trigger
• 4H break of structure after retest
• Alternative: Daily close back above HTF Bullish Trendline in case of deviation (deviation entry method)
📋 Trade Management
Stoploss: Below the 4H swing low that breaks structure
Target: $59.5 (ATH)
Carrying 25% runner with stop at breakeven for extended gains
💬 Like, follow, and comment if you find this setup valuable!
⚠️ Disclaimer: This content is for informational and educational purposes only and does not constitute financial, investment, or trading advice. Always DYOR before making any financial decisions.

Hyperliquid showing weakness as competition moves in.HPYE momentum is slowing down at the end of a rising wedge. Divergence is a sign that bullish momentum is slowing down, and follow-through should be expected. As trend line liquidity is hunted, be prepared for the base of the wedge to be a solid POI.
HYPE has successfully broken out of the red resistance zone 📊 GETTEX:HYPE Market Update
GETTEX:HYPE has successfully broken out of the red resistance zone 🔴✅
👉 If price keeps pushing upward, the next target is the blue line level 🎯📈
⚡ Breakout confirms bullish momentum — manage your trades and watch for continuation.

HYPE- long plan ,bullish continuation 🚀 GETTEX:HYPE Daily Chart looking 🔥
🔹Price has broken out strong and is now setting up for a healthy retracement. Eyes are on the Daily FVG + Fib Zone around $50 – a perfect area for bulls to reload before the next leg up.
🔹Liquidity has been swept, structure is bullish, and momentum is still on our side. As long as this zone holds, the next move could send us into new highs. 📈
This dip = opportunity. Don’t fade the HYPE. ✨


HYPE | Looking for All-Time HighsHYPE | Looking for All-Time Highs
📊 Market Sentiment
Market sentiment remains strongly bullish as the FED is set for a 0.25% rate cut, with the possibility of a 0.5% cut in September. Monetary policy is being adjusted not only in response to inflation but also weak labor market data. Recent August and September job numbers came in soft, signaling that the economy is cooling rapidly. This shift is fueling expectations for one of the strongest bullish runs in the coming weeks.
📈 Technical Analysis
HYPE continues to show a strong HTF bullish trend — one of the most bullish structures currently in crypto. Price retraced into the 0.75 HTF discounted range and reacted strongly from there. This level also aligned with the HTF bullish trendline, creating a clean confluence. Following the bounce, price established a fresh 4H demand zone, adding further validation to the bullish outlook.
📌 Game Plan
I will be watching for price to revisit the 4H demand zone, which also overlaps with the HTF bullish trendline. This zone aligns with the 0.5 Fibonacci equilibrium level, making it a key area of interest for continuation to the upside.
🎯 Setup Trigger
I will look for a confirmed 1H break of structure before entering long.
📋 Trade Management
Stoploss: Below the 1H swing low responsible for the BOS
Targets:
• TP1: $47.78
• TP2: $51.20 (ATH)
💬 Like, follow, and comment if you find this setup valuable!
⚠️ Disclaimer: This content is for informational and educational purposes only and does not constitute financial, investment, or trading advice. Always do your own research before making any financial decisions.

Hype Breakout Above $47.6?Hype continues to consolidate near the 45.95 resistance on the 4-hour chart. In this update, I break down the short-term roadmap with clear resistance and support levels. A breakout above 45.95 could open the way to 47.57, 49.32, and even 52.14 in the coming sessions.
On the downside, supports to watch are 44.32, 42.58, and 40.49. The broader structure remains constructive above 38.27, and my bias continues to be for more upside as long as that foundation holds. Watch these levels closely as they will define the next move for Hype.

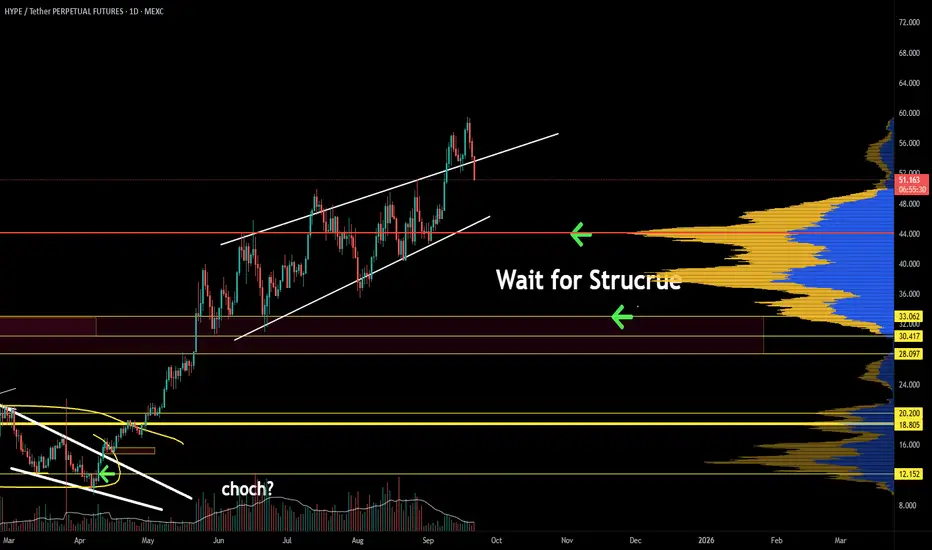
TradeCityPro | HYPE Weakens Inside Ascending Channel👋 Welcome to TradeCity Pro!
In this analysis, I want to review the HYPE coin for you. It is one of the coins that has recently trended and with a market cap of 15.31 billion dollars is ranked 12th on CoinMarketCap.
📅 Daily Timeframe
In the daily timeframe, this coin has had a very long-term upward trend that has now shown weakness after breaking the 31.132 zone, and its slope has decreased significantly.
✨ After the 31.132 break, an ascending channel has formed, and the price is correcting in the direction of the trend.
📊 The volume has gradually decreased, indicating weakness in this upward move, and on the other hand, RSI has shown a strong divergence.
💥 Of course, the RSI divergence has not yet been activated, and it is natural for RSI to show divergence when the price is in a correction and consolidation phase.
✅ Currently, the price is in the lower half of the channel and has reacted several times to the bottom and midline of the channel. If the resistance at 49.223 is broken, the price structure can change, and if volume starts to increase, the probability of breaking the channel top rises significantly.
⚡️ On the other hand, considering all the negative signs that have led to this trend weakness, the possibility of breaking the channel to the downside is also high.
📈 In that case, with the break of the 40.625 or 36.871 triggers, we can open a short position, but in my opinion, as long as the price is above the 31.132 zone, short positions are not logical and the market trend remains bullish.
📝 Final Thoughts
Stay calm, trade wisely, and let's capture the market's best opportunities!
This analysis reflects our opinions and is not financial advice.
Share your thoughts in the comments, and don’t forget to share this analysis with your friends! ❤️

$HYPE – Moon at $50 or steal it at $20?KUCOIN:HYPEUSDT | 1D
Hyperliquid rallied 446% off the lows, grinding up to $51.
The hurdle that needs to regain is the $47–48 level. If price won’t reclaim this zone and loses its base, a drop toward $30–27 (previous value area high) is likely.
Strongest buy zone remains $20–17.

HYPE-USDT SHORT UPDATE #1Hello my friends 😍
I am back with a very interesting update from the last analysis I put on the HYPE-USDT cryptocurrency 😎
💁♂️ In the previous analysis I identified the supply area and considered two scenarios
1️⃣ The first scenario was that it enters the supply area and consumes liquidity and then we will see a price correction
2️⃣ The second scenario was that it crosses the supply area and consumes liquidity from the higher areas and then we move downwards
✅ The first scenario was activated and after hitting the supply area we have seen a price correction of more than 14% so far
What could be better than this? 🙂↕️
Did you use the analysis and find it useful? 🤔
Share your comments with me 😍
To support me, I would appreciate it if you boost the analysis and share it with your friends so that I can analyze it with more energy for you, my dears. Thank you all. 💖

Hyperliquid defended the $43 level ┆ HolderStatOKX:HYPEUSDT.P on the 8h chart is showing strength after breaking out of a falling channel. The price is holding above 42.9, supported by a pattern of triangles and sideways ranges that consistently preceded bullish extensions. If momentum holds, the market could target 47.5 and eventually 50, suggesting accumulation is ongoing with breakout potential building.

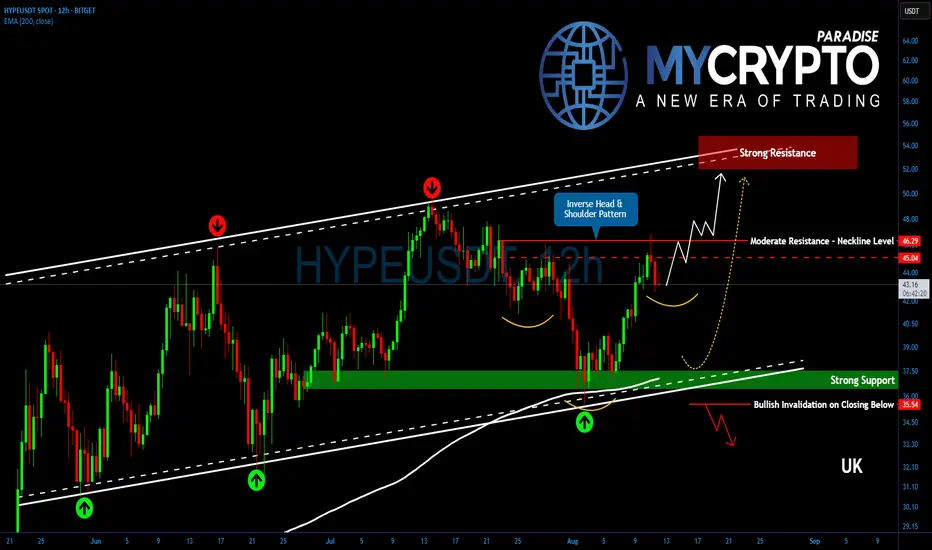
Breakout or Breakdown? HYPE Approaches Critical Price ZoneYello, Paradisers! Could we be moments away from #HYPE’s next explosive leg up? The chart is giving us some big clues right now…
💎HYPE continues to stand out as one of the market’s strongest altcoins, maintaining its climb inside a well-defined ascending channel. On top of that, an inverse head and shoulders pattern is taking shape, a classic bullish signal hinting at further strength ahead.
💎Currently, #HYPEUSDT is pressing against a key resistance zone at 45.05–46.30, which also lines up perfectly with the neckline of the emerging pattern. This is a moderate but crucial area for bulls to conquer.
💎If we see a clean breakout above this range, supported by strong buying volume, it would confirm the bullish pattern and likely propel price toward the 52–54 zone, right where the top of the channel is positioned.
💎On the downside, minor support lies between 43.00–41.90. Losing this zone could open the way for a deeper pullback toward the 37.50 region, where the EMA-200 offers strong technical support.
Paradisers, strive for consistency, not quick profits. Treat the market as a businessman, not as a gambler.
MyCryptoParadise
iFeel the success🌴
SHELLUSDT —Accumulation Phase or Breakdown?📌 Overall Chart Overview
Currently, SHELLUSDT is trading within a Descending Triangle pattern on the daily timeframe. This structure is characterized by lower highs pressing down through a descending trendline, while the bottom side is being defended by a strong demand zone at 0.13 – 0.15 (yellow box).
This setup signals that the market is in a tug-of-war phase: sellers are consistently applying pressure, yet buyers are still holding the line at support. The outcome of this compression will likely lead to a major move in the coming weeks.
---
🔼 Bullish Scenario (Breakout)
If the price manages to close above 0.15 and break through the descending trendline:
It would confirm a bullish breakout, signaling the potential start of a short-term trend reversal.
Upside targets to watch:
T1: 0.2047 (minor resistance)
T2: 0.2275 – 0.2400 (supply zone)
T3: 0.2600 (psychological resistance)
Extension: 0.3301 (major level, opening the path toward 0.5941 in the mid-term).
A valid breakout usually comes with a surge in volume, so volume confirmation will be key.
---
🔽 Bearish Scenario (Breakdown)
On the other hand, if price fails to hold the 0.13 – 0.15 zone and we see a daily close below 0.13:
The Descending Triangle would be confirmed as a bearish continuation pattern.
Downside targets:
T1: 0.1200
T2: 0.1077 (previous major low)
Extension zone: 0.1000 – 0.0960 (psychological levels).
This would highlight seller dominance and potentially extend the downtrend further.
---
📊 Additional Insights
Volume & Momentum: Volume is currently flat, reflecting indecision. A spike in volume will likely be the early signal of a major move.
Sentiment: A breakout would turn this demand zone into a golden accumulation area for buyers. A breakdown, however, would act as a trap for weak longs.
Risk Management: Waiting for a daily candle close beyond 0.13–0.15 is the safest approach to avoid fakeouts.
---
✨ Conclusion
SHELLUSDT is at the apex of its Descending Triangle, and the 0.13 – 0.15 range is the critical battle zone. A breakout above 0.15 opens the door for a trend reversal toward 0.20 – 0.26, while a breakdown below 0.13 could drag price down to 0.1077 or even lower.
Traders should remain patient and wait for clear confirmation before committing to an aggressive position. The current market is in a “wait and see” phase, and a powerful move is likely coming soon. 🚀📉
#SHELLUSDT #CryptoAnalysis #Altcoin #PriceAction #TechnicalAnalysis #DescendingTriangle #SupportResistance #BullishBreakout #BearishBreakdown #CryptoTrading #RiskManagement

HYPE-USDT SHORT Hello friends 💖
💁♂️I am at your service with another analysis
But this time I will not place a position with a stop and I will only suggest one currency to put in your watch list because in case of a decline it can see attractive targets and a very good decline is expected
This suggestion is nothing but the HYPE-USDT cryptocurrency
Be sure to have this cryptocurrency in your watch list because I think it is approaching the end of the upward trend
In case of a decline, the lower orange areas can be good targets for this cryptocurrency
👉 Do not rush to enter and be sure to enter in the right place when you see the trigger 👈
To support me, I would appreciate it if you boost the analysis and share it with your friends so that I can analyze it with more energy for you, my dears. Thank you all. 💖

HYPE Swing Long IdeaHYPE Swing Long Idea
📊 Market Sentiment
Overall sentiment remains bullish, supported by expectations of a 0.25% rate cut in the upcoming FOMC meeting. A weakening USD and increasing global risk appetite are creating favorable conditions for further upside in crypto assets.
📈 Technical Analysis
HYPE is showing relative strength compared to other crypto assets.
Price bounced from the bullish trendline, forming a 4H demand zone.
It tapped into this 4H demand zone again and found support, confirming buyers’ interest.
📌 Game Plan
I will be watching for a return to the 4H demand zone and a run of the first tap at $42.4 to initiate a potential all-time high move.
I will also be looking for either a tap or deviation from the bullish trendline, followed by a close back above it.
🎯 Setup Trigger
I will be waiting for a 4H–1H market structure shift before entering the trade.
📋 Trade Management
Stoploss: 4H–1H swing low confirming the BOS
Targets:
TP1: $47.4 – Internal High
TP2: $49.8 – All-Time High
💬 Like, follow, and comment if you find this setup valuable!
⚠️ Disclaimer: This content is for informational and educational purposes only and does not constitute financial, investment, or trading advice. Always do your own research before making any financial decisions.

Hyperliquid held above the $40 ┆ HolderStatKUCOIN:HYPEUSDT on the 4h chart is showing resilience as the market holds above the $40 level. The chart highlights a sequence of triangles, falling channels, and a recent rising channel, with price now testing the $47 resistance zone. A sustained break above this level would signal further bullish continuation, potentially reaching $50–52. The pattern suggests repeated rebounds from support with buyers steadily regaining control. As long as the price stays above $40, momentum favors the bulls, with accumulation zones indicating the potential for the next upward wave.

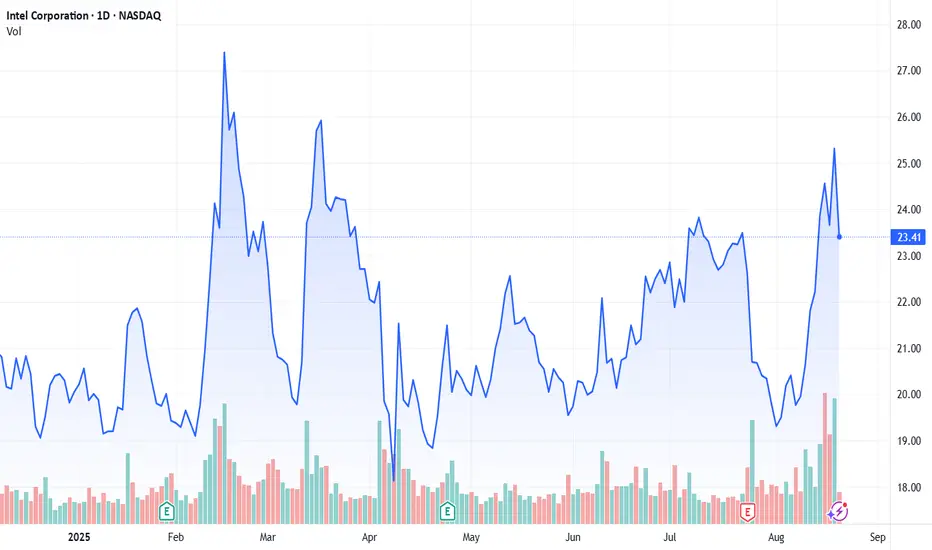
Intel in 2025: The Pre-Boom Echo of Early Nvidia?In 2018, Nvidia (NVDA) was trading at a fraction of its current valuation, largely overlooked despite its cutting-edge GPU tech and early AI involvement. Fast forward to 2023–2024, it became the poster child of the AI revolution, with exponential growth driven by massive demand for AI infrastructure. Intel (INTC) today mirrors that earlier phase: undervalued, undergoing strategic shifts (Gaudi AI chips, foundry expansion, AI PCs), and investing heavily in AI and semiconductor independence in the West. While NVDA had clear early tech leadership, Intel is positioning itself as the alternative > a comeback story with geopolitical tailwinds, untapped AI potential, and a lower price entry. If history rhymes, Intel might be where NVDA was , not in dominance, but in opportunity.
Easy words, BUY SOME AND HOLD!!!
Hyperliquid will test the support ┆ HolderStatOKX:HYPEUSDT.P on the 4h chart is showing consolidation through triangle and sideways formations, with price stabilizing above 41.20 support. The falling channel has been broken, and momentum suggests a possible breakout above 47. If successful, upside targets at 50–52 remain in play. The structure signals accumulation with strong reaction zones marked.

$HYPE/USDT is up 15% after breaking out of its wedge pattern,$HYPE/USDT is up 15% after breaking out of its wedge pattern, showing strong bullish momentum. Price is now eyeing the $50–$60 zone, with the setup remaining valid as long as it holds above $38 on the daily close.

HYPEUSDT.P 4H Chart Analysis | Volume Surges...HYPEUSDT.P 4H Chart Analysis | Volume Surges As Price Approaches ATH
🔍 Let’s break down the HYPE/USDT perpetual contract and scope out bullish momentum alongside key technical catalysts.
⏳ 4-Hour Overview
The 4-hour chart confirms an upward trend, reinforced by strong candle structure and sustained volume inflows. Price is approaching its all-time high (ATH) around $49.618, making this level crucial for the next directional move.
📊 Key Highlights:
- Volume: Noticeable volume convergence during the latest upward leg, demonstrating strong buyer interest as price accelerates toward ATH.
- 3SMA Trend: Moving averages (7, 25, 99) currently support the bullish structure, with price action maintaining strength above these key levels at $47.224, $45.752, and $41.744, respectively.
- Upward Trend: Higher lows and consistent higher highs define strong momentum, while the chart illustrates bullish continuation potential after consolidation.
- ATH Test: A breakout and hold above all-time high could open the door for further rallies, especially if volume continues to expand in sync with price.
🌐 DeFi Momentum
- Total Value Locked (TVL): DeFi markets are surging with $2.237B TVL across top protocols, underscoring broader sector confidence.
- Top 10: HYPEUSDT's movement mirrors strength seen among top DeFi assets, hinting at sector-wide bullish alignment.
🚨 Conclusion:
HYPEUSDT is building bullish energy as it tests the ATH with volume backing the move. Keep a close eye on price action near resistance—if buyers sustain momentum, next targets could materialize quickly. Support rests on 3SMA levels, with DeFi sector trends providing further tailwinds.

WALUSDT — Breakout or Breakdown? Golden Pocket the Key!Quick Context: Since May, price has formed a series of lower highs connected by a descending trendline (yellow). Beneath it lies a strong demand zone at 0.406–0.420, aligning with Fibonacci 0.5 (0.419) and 0.618 (0.407) — the golden pocket. Current price is around 0.435, pressing against the trendline and approaching the apex of the pattern.
Pattern & Key Levels
Main Pattern: Descending Triangle (downward-sloping top, relatively flat base/zone). Theoretically slightly bearish, but since it sits right on the golden pocket with compression, the probability of an impulsive breakout in either direction is high.
Major Demand / Support: 0.406–0.420 (golden pocket + base).
Immediate Resistance: descending trendline + 0.44–0.46 area.
Next resistance targets (yellow dashed lines): 0.484 → 0.542 → 0.674 → 0.732.
Downside supports if broken: 0.380 → 0.350 → 0.296.
Bullish Scenario
1. Confirmation: Daily close above the trendline and ideally > 0.460 (clear breakout confirmation).
2. Healthy Retest: Pullback to 0.44–0.46 / trendline, now acting as support.
3. Step Targets:
T1: 0.484
T2: 0.542
T3: 0.674
T4: 0.732
4. Bullish Invalidation: Daily close back below 0.420; strong invalidation if < 0.406 (loss of golden pocket).
Bearish Scenario
1. Rejection: Fails to break 0.44–0.46 / trendline and turns down.
2. Weakness Confirmation: Daily close below 0.406 (loss of base + golden pocket).
3. Downside Targets:
S1: 0.380
S2: 0.350
S3: 0.296
4. Bearish Invalidation: Daily close above 0.460 with a successful retest flips bias to bullish.
Execution Notes
Apex Break: The closer price gets to the apex, the higher the risk of false breaks — always wait for a daily close to confirm.
Volume: A valid breakout should be accompanied by increasing volume.
Risk Management: Place stops beyond the invalidation zones of your chosen scenario (below 0.406 for breakout longs; above 0.460 for rejection shorts).
> Summary: WALUSDT is being squeezed between the descending trendline and golden pocket 0.406–0.420. A daily close above 0.460 could open the path to 0.484/0.542, while a breakdown below 0.406 may trigger a drop towards 0.380–0.350.
Not financial advice; purely for educational and technical reference.
#WALUSDT #Walrus #CryptoTA #PriceAction #DescendingTriangle #Fibonacci #SupportResistance #Breakout #RiskManagement
