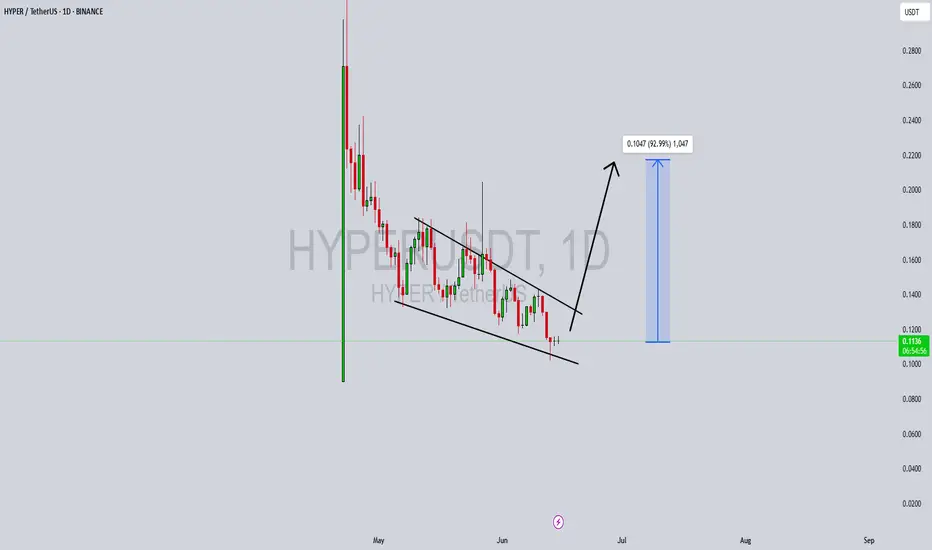
HYPERUSDT Forming Bullish WaveHYPERUSDT is forming a clear bullish wave pattern, a classic bullish reversal signal that often indicates an upcoming breakout. The price has been consolidating within a narrowing range, suggesting that selling pressure is weakening while buyers are beginning to regain control. With consistent volume confirming accumulation at lower levels, the setup hints at a potential bullish breakout soon. The projected move could lead to an impressive gain of around 90% to 100% once the price breaks above the wedge resistance.
This falling wedge pattern is typically seen at the end of downtrends or corrective phases, and it represents a potential shift in market sentiment from bearish to bullish. Traders closely watching HYPERUSDT are noting the strengthening momentum as it nears a breakout zone. The good trading volume adds confidence to this pattern, showing that market participants are positioning early in anticipation of a reversal.
Investors’ growing interest in HYPERUSDT reflects rising confidence in the project’s long-term fundamentals and current technical strength. If the breakout confirms with sustained volume, this could mark the start of a fresh bullish leg. Traders might find this a valuable setup for medium-term gains, especially as the wedge pattern completes and buying momentum accelerates.
✅ Show your support by hitting the like button and
✅ Leaving a comment below! (What is your opinion about this Coin?)
Your feedback and engagement keep me inspired to share more insightful market analysis with you!
Hyperwave

BUY AND HOLDHello friends
You can see that the price is in an ascending channel and has made a fake breakout to remove short-term buyers, but in reality this is just a price correction and there is no need to worry, and in a price correction you can buy in steps with capital and risk management and move with it to the specified goals.
Note that the holding period is at least 3 months, so be patient and observe capital management.
*Trade safely with us*

Memecoin is risky but profitable...Hello friends🙌
Given the channel's failure on the weekly time frame, there is now a good opportunity to buy in the price reversal or price correction, of course, with capital and risk management.
🔥Follow us for more signals🔥
*Trade safely with us*

HYPERUSDT UPDATE#HYPER
UPDATE
HYPER Technical Setup
Pattern: Falling Wedge Pattern
Current Price: $0.3293
Target Price: $0.70
Target % Gain: 100.66%
Technical Analysis: HYPER is consolidating within a falling wedge on the 1D chart, a bullish reversal pattern. Price is holding near support around $0.32 and a breakout above resistance could trigger strong upside momentum toward $0.70.
Time Frame: 1D
Risk Management Tip: Always use proper risk management.

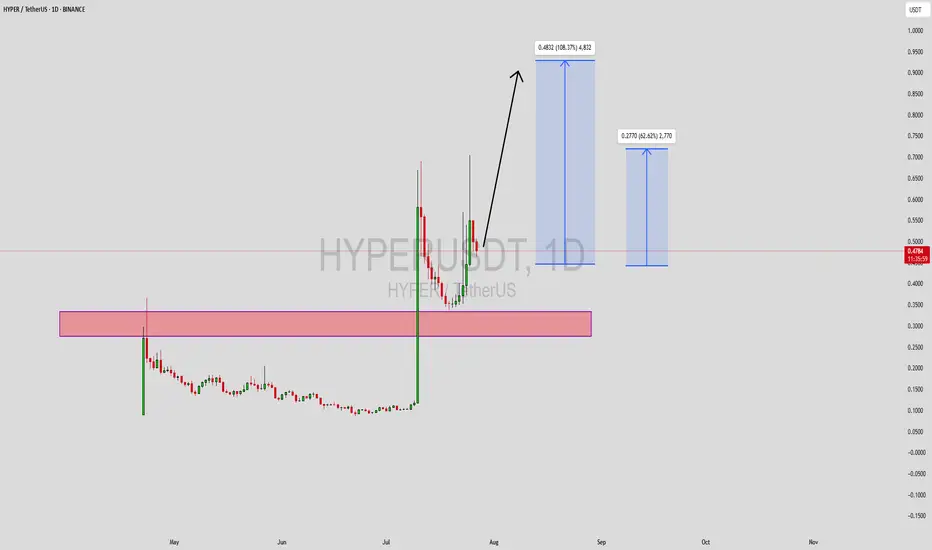
HYPERUSDT Forming Bullish ReversalHYPERUSDT is currently trading near a strong support zone, and the recent price action indicates a potential bullish reversal. After consolidating at lower levels, the pair is showing signs of accumulation, suggesting that buyers are stepping in with renewed confidence. This setup creates a strong foundation for a possible upward rally in the coming days.
The trading volume has remained steady, which supports the probability of a breakout move. With consistent buyer interest and fresh momentum building up, HYPER has the potential to recover quickly and test higher resistance zones. The chart structure highlights a sharp bounce possibility, aligning with the bullish sentiment forming in the market.
With expectations of a 90% to 100% gain from current levels, HYPERUSDT is shaping up to be one of the coins to watch closely. If price successfully breaks above its immediate resistance, the momentum could accelerate, leading to a sharp upside rally. This makes it an attractive option for traders looking for high-reward opportunities with favorable risk-to-reward setups.
✅ Show your support by hitting the like button and
✅ Leaving a comment below! (What is You opinion about this Coin)
Your feedback and engagement keep me inspired to share more insightful market analysis with you!

$HYPE/USDT is up 15% after breaking out of its wedge pattern,$HYPE/USDT is up 15% after breaking out of its wedge pattern, showing strong bullish momentum. Price is now eyeing the $50–$60 zone, with the setup remaining valid as long as it holds above $38 on the daily close.

HYPERUSDT Forming Bullish WaveHYPERUSDT is forming a compelling bullish wave pattern, a continuation formation indicating strong upward momentum is building following a recent correction and consolidation. This pattern typically reflects renewed buyer strength, marked by higher highs and higher lows as momentum reasserts itself—high-probability setup territory for traders looking for continuation moves.
Recent price action supports this bullish outlook: the pair has broken above a key resistance level on solid volume, reinforcing the pattern and increasing the likelihood of further upward acceleration. This breakout phase is often where traders look to position for the next leg up, and with volume backing the move, confidence in the rally's sustainability grows.
Fundamentally, the project behind HYPER is gaining traction as well. Bitcoin Hyper is positioning itself as a layer-2 scaling solution for Bitcoin—built using the Solana Virtual Machine for high performance and scalability. It offers near-instant(tx) finality and low-cost transactions, enabling DeFi, gaming, and app development on Bitcoin’s network. The narrative is gaining further momentum, with its presale surpassing $8 million and promising massive upside potential, especially in a renewed bull market.
Putting it all together, HYPERUSDT has the technical structure, volume support, and narrative tailwinds lining up perfectly for a strong bullish run. Traders targeting continuation setups should monitor for sustained price action above key levels. The projected 90% to 100%+ upside reflects the strength of this confluence.
✅ Show your support by hitting the like button and
✅ Leaving a comment below! (What is your opinion about this Coin)
Your feedback and engagement keep me inspired to share more insightful market analysis with you!

HYPERUSDT Forming Bullish ContinuationHYPERUSDT is capturing significant attention as it emerges from a consolidation zone, signaling a potential bullish continuation. After a massive impulse move to the upside, the price found support at a critical zone, which has now flipped into a demand area. This area is acting as a strong base for buyers, with volume steadily increasing—a key indication of accumulation and renewed interest from market participants.
Currently, the price is forming a structure that reflects bullish momentum, supported by recent higher lows and increased wick rejections from below. This kind of setup often precedes a strong breakout, especially when reinforced by strong volume, as seen here. The chart suggests a potential upside move of over 130%, targeting previous liquidity zones and untouched resistance areas, as buyers step in aggressively.
HYPER is becoming a trending topic in the altcoin space, with investors closely watching its price action for signs of a full recovery. As trading sentiment shifts bullish and on-chain metrics support the narrative, HYPERUSDT stands out as one of the higher potential mid-cap coins. A breakout beyond recent highs could quickly accelerate gains, given the relatively thin resistance levels above.
This setup is ideal for breakout traders and swing positions, especially as the broader market regains confidence. Patience and technical confirmation will be key, but HYPERUSDT is positioning itself as a standout opportunity for the weeks ahead.
✅ Show your support by hitting the like button and
✅ Leaving a comment below! (What is You opinion about this Coin)
Your feedback and engagement keep me inspired to share more insightful market analysis with you!

HYPERUSDT Forming Bullish ReversalHYPERUSDT is currently forming a bullish reversal pattern, suggesting a potential shift in momentum from bearish to bullish. This type of setup typically emerges after a downtrend, signaling that sellers are losing strength and buyers are preparing to reclaim control. The current chart shows early signs of trend exhaustion with tightening price action, which often precedes a breakout in the opposite direction. This setup is particularly attractive for swing traders looking to capitalize on a major reversal.
Volume activity is supporting the reversal thesis, with increased accumulation evident at key support zones. This suggests strong interest from investors and smart money anticipating a move higher. Bullish reversal patterns backed by volume typically lead to sharp rallies, and based on this structure, HYPERUSDT has the potential to deliver gains of 90% to 100%+ in the coming sessions. Confirmation of this setup will be a breakout above the neckline or key resistance with sustained buying volume.
Investor sentiment around HYPER is also improving, fueled by growing community support and rising visibility in crypto forums and social platforms. Technically, the coin is sitting at a major inflection point where a clean break can result in a parabolic upside move. Traders should remain alert for breakout confirmation and be ready to manage risk accordingly for maximum reward potential.
This trade idea aligns well with common reversal setups seen in successful altcoin rallies. If executed with precision, it offers both technical strength and strong upside risk-to-reward profile.
✅ Show your support by hitting the like button and
✅ Leaving a comment below! (What is You opinion about this Coin)
Your feedback and engagement keep me inspired to share more insightful market analysis with you!
HYPERUSDT Forming Bullish WaveHYPERUSDT is currently showcasing a bullish wave pattern, a strong technical formation that often signals the continuation of an upward move after a healthy correction or consolidation. This wave structure suggests that bulls are regaining control, creating the potential for a significant price expansion. With volume remaining solid and consistent, this aligns well with the expected upside breakout, making this a promising setup. Analysts and short-term traders alike are eyeing a 90% to 100%+ gain from the current levels based on wave projection.
The growing interest around the HYPER project adds a layer of fundamental strength to the technical setup. With active community engagement and strategic development updates, HYPERUSDT has been catching investor attention across crypto forums and social media platforms. This increasing visibility could further drive price action, especially if market conditions remain favorable for altcoin momentum.
Looking at historical price movements, HYPERUSDT has shown the capacity for sharp, impulsive waves followed by periods of consolidation—characteristics of a trending asset. If the current bullish wave completes its projected move, it could push the price back into a previous resistance zone or even break into price discovery, depending on broader market sentiment.
Given the technical pattern confirmation and rising investor interest, HYPERUSDT is shaping up to be a strong short-to-mid-term play. Traders looking for volatility and high-reward setups may want to keep this pair on their active watchlist.
✅ Show your support by hitting the like button and
✅ Leaving a comment below! (What is You opinion about this Coin)
Your feedback and engagement keep me inspired to share more insightful market analysis with you!

HYPEUSDT KUCOIN:HYPEUSDT 4H Analysis Price has broken out above the 44.5 support zone and is holding strong 🚀. As long as this level holds, targets are set at 50.615 and 57.164 📈. If 44.5 breaks down, next support is seen at 40.433 🔻.
Key Levels:
✅ Support: 44.5
🟩 Targets: 50.615 → 57.164
🔴 Next support if breakdown: 40.433

HYPERUSDT Forming Strong Bullish ReversalHYPERUSDT is currently trading within a classic falling wedge pattern — a formation known for signaling strong bullish reversals once a breakout occurs. This structure is typically a sign of seller exhaustion and accumulation by smart money, particularly when accompanied by steady or rising volume, as we see now. With bullish divergence becoming more apparent on momentum indicators, the technical conditions are aligning for a significant price rally.
This setup suggests the potential for an explosive breakout to the upside, with a projected gain range of 80% to 90%+ once the upper resistance of the wedge is decisively breached. The falling wedge is forming at the tail end of a sustained downtrend, which often serves as a base for major upward reversals. A breakout above key resistance could bring a sharp bullish wave, pushing HYPERUSDT back toward previous supply zones and even forming new local highs.
Investor interest in the HYPER project is gaining traction, with increasing mentions across social platforms and a noticeable uptick in trading activity. As new capital flows into smaller-cap altcoins showing promising technicals, HYPER appears to be on many watchlists, especially among swing traders and early-stage investors looking for asymmetric risk/reward setups.
Overall, HYPERUSDT is offering a compelling opportunity based on this pattern. A confirmed breakout from the wedge may trigger strong momentum in the days ahead, particularly as market sentiment leans increasingly risk-on.
✅ Show your support by hitting the like button and
✅ Leaving a comment below! (What is You opinion about this Coin)
Your feedback and engagement keep me inspired to share more insightful market analysis with you!
Renalytix hyperwave phase 6Possible Renalytix hyperwave phase 6. Will watch to see if it heads all the way back to phase 1.
Very rough phase lines drawn.

S&P500 (SPX) Hyperwave - have we entered phase 4?S&P500 (SPX) Hyperwave - have we entered phase 4?
SPX is potentially one of largest hyperwaves ever. Tyler Jenks predicted between $5600 by 2023 to $7500-10000 by 2025 (conservative/aggressive targets).


Apple - Dire WARNING - DANGER ZONEThis post addresses basic cycle theory. Parabolic curves and parabolic trends.
Yesterday the world laughed at Bitcoin and said that it was a BUBBLE and a PONZI scheme.
Today the whole world is in a bubble and the entire financial world is a ponzi scheme. Ironically we only need to look at examples of yesterday (Bitcoin) to understand how this is going to play out.
In this chart I simply analyse a very clean cut, tidy looking and VERY obvious parabolic trend. I cannot tell you when this is going to happen, or how far up this is going to run because that would be attempting to "time the market", as everyone knows this is a fools errand. But what i can allude to is that which is VERY likely going to be the outcome.
Anyone looking to play leveraged trade positions up here.......... is akin to a game of Russian-roulette with 5 chambers loaded.
Please scroll down for accompanying information and examples.
Please feel free to share your own examples of similar Parabolic trends and their outcomes. The community would love to collate this kind of information in one place.
Happy trading, stay safe. Don't be over exposed.

Breakout!Bitcoin broke downtrend resistance. Market buy btc. Consider loading up on bch/ether as well for alt coin portfolio.We are going to the moon


WRX Hyperwave StructureWatching for price patterns on WRX whilst trying to understand Hyperwaves better
Observations:
A - looked like a textbook Hyperwave - returned to first sell-off point
B - Exhibited common price patters as seen in A and manage to retrace - returned to first sell-off point
C - Exhibits common price patterns with A and B but much flatter - returned to first sell-off point
Although WazirX is not to the crypto space, the Binance WRX is a new Cryptocurrency so it's interesting to study its behaviour. It is tracking through some major price fluctuations in crypto but patterns are emerging. The general trend is up although this has slowed and flattened out in this C period. This might diminish upside to only previous highs?
BTC will no doubt have a role to play here. Very interested to see how WRX moves in next few days.
Best, Hard Forky

Natural Gas - Hyperwave Natural Gas seems to have completed a hyperwave cycle and is potentially in a new phase 1

Platinum - Completed a HYPERWAVE cycle Platinum - Completed a HYPERWAVE cycle , potentially starting a new phase 1 on the weekly

Silver AG Hyperwave on the weeklySilver (AG) seems to have completed a hyper wave cycle , and potentially starting a new phase 1.
Charted on the Weekly
