HYPE/USDT - Reversal Zone or Bearish Continuation?HYPE/USDT on the 12-hour timeframe remains in a clear medium-term downtrend. Price continues to trade below a well-defined descending trendline, which has been respected since the peak around the 49–51 USDT area. This structure confirms that sellers are still in control.
However, recent price action shows a reaction from the lower demand zone, signaling a critical decision area where the market may either reverse or continue its bearish trend.
---
Pattern Explanation
The dominant patterns visible on the chart include:
Descending Trendline (Bearish Market Structure)
Price consistently forms lower highs and lower lows, confirming a bearish trend.
Compression / Potential Descending Triangle
Price is compressing toward the trendline, indicating decreasing volatility and an upcoming breakout or rejection.
Minor Base Formation
A short-term consolidation is forming near the 22–25 USDT zone, showing early defensive buying pressure.
This type of structure often precedes a strong impulsive move.
---
Key Levels
Resistance Zones:
27.70 USDT → Descending trendline & short-term supply
29.80 USDT → Major horizontal resistance
34.70 USDT → Previous breakdown area
41.10 USDT → Mid-range resistance
49.20 – 51.48 USDT → Major supply & previous high
Support Zones:
25.00 USDT → Short-term support
22.19 USDT → Major demand zone & cycle low
---
Bullish Scenario
Price breaks and closes above the descending trendline (around 27.70 USDT) on the 12H timeframe.
Bullish confirmation becomes stronger if supported by increasing volume.
Upside targets:
29.80 USDT
34.70 USDT
41.10 USDT (extension target if momentum accelerates)
A confirmed breakout would shift the structure from lower highs to higher highs, signaling a trend reversal.
---
Bearish Scenario
Price fails to break the trendline and gets rejected near the 27.70 USDT area.
This rejection would confirm bearish trend continuation.
Downside targets:
25.00 USDT
22.19 USDT (critical support)
A breakdown below 22.19 USDT with strong volume could trigger a deeper sell-off.
---
Conclusion
HYPE/USDT is currently trading at a major decision zone. The descending trendline remains the key level that will determine the next directional move.
Breakout = potential trend reversal
Rejection = bearish continuation
Patience and confirmation are essential before taking positions.
---
#HYPEUSDT #Hyperliquid #CryptoAnalysis #TechnicalAnalysis #DescendingTrendline #TrendReversal #BearishMarket #BullishBreakout #AltcoinTrading
HYPEUSD

HYPEUSDT Breakout Confirmed. Ascending Triangle + EMA SupportKUCOIN:HYPEUSDT has recently broken out of an Ascending Triangle pattern on the 4-hour timeframe, indicating a potential shift toward bullish continuation. This pattern reflects sustained higher lows with strong horizontal resistance, and the breakout suggests buyers are now in control.
Price action is currently holding comfortably above the 50 EMA, which is acting as a dynamic support. This confirms bullish structure and increases the probability of continuation rather than a false breakout. Any healthy pullback toward the breakout zone or EMA may provide a better risk-reward opportunity.
In addition to technical strength, volume has expanded noticeably, supporting the validity of the breakout. Since GETTEX:HYPE is a #DEX platform token, the recent increase in platform activity and participation adds a fundamental tailwind to the bullish setup.
Overall bias remains bullish as long as price sustains above the breakout structure. Traders should continue to manage risk properly and keep a strict stop loss, as crypto markets remain highly volatile. This setup favors disciplined execution rather than aggressive leverage.
GETTEX:HYPE Currently trading at $25.8
Buy level : Above $25.5
Stop loss : Below $23
Target 1: $28
Target 2: $30
Target 3: $32
Target 4: $36
Max leverage 3x
Always keep stop loss
Follow Our Tradingview Account for More Technical Analysis Updates, | Like, Share and Comment Your thoughts

DeGRAM | HYPEUSD will go to the $24 level📊 Technical Analysis
● HYPE/USD continues to respect a descending resistance line, with multiple rejections inside the upper resistance zone near 25.2–25.5. Each rally stalls with lower highs, confirming short-term bearish control.
● Price is compressing between the falling resistance and rising support line, forming a contracting structure. Failure to reclaim 24.8 favors a pullback toward the 24.25 level and potentially the broader support area near 23.8.
💡 Fundamental Analysis
● Short-term sentiment across altcoins remains cautious as traders reduce risk exposure amid low holiday liquidity and BTC consolidation.
✨ Summary
● Bearish bias below 24.8. Resistance: 25.2–25.5. Targets: 24.25 and 23.8. Structure favors downside continuation.
-------------------
Share your opinion in the comments and support the idea with a like. Thanks for your support!

HYPE Mirrors ORDI’s Bearish Top — Lower Targets AheadThe structure on HYPE looks very similar to what we previously saw on ORDI. Both assets formed a clear bearish reversal structure at their local highs, followed by a breakdown from a rising wedge.
Based on this price action, I wouldn’t consider buying HYPE here — the chart suggests that it’s only a matter of time before the price continues moving lower.
My primary downside targets are:
$13–12
$6.6–5
Until the market shows a confirmed shift in structure, the trend remains bearish.

HYPERLIQUID Is it getting a relief rally?A month ago (November 13, see chart below), we gave a strong Sell Signal on Hyperliquid (HYPEUSD) after the Head and Shoulders (H&S) pattern turned into an obvious Channel Down, which easily hit our $30.00 Target:
Now we see some short-term relief before the next, larger drop as not only did the price make contact with the bottom (Lower Low trend-line) of the Channel Down, but also the 1D RSI is displaying the same kind of bottoming sequence it did on October 17.
Even though the resulting rebound/ Bullish Leg rose by +50.50%, even breaking above the 0.618 Fibonacci retracement level, this time the move might be limited by the 1D MA50 (blue trend-line) posing as a Resistance, even though the 1D MA100 (green trend-line) is the standard long-term one during Bear Cycles.
In any event, our 'modest' short-term Target for this bounce is $33.00.
---
** Please LIKE 👍, FOLLOW ✅, SHARE 🙌 and COMMENT ✍ if you enjoy this idea! Also share your ideas and charts in the comments section below! This is best way to keep it relevant, support us, keep the content here free and allow the idea to reach as many people as possible. **
---
💸💸💸💸💸💸
👇 👇 👇 👇 👇 👇

ONE Chart. SIX targets. Thats HYPE!The hyperliquid chart is showing signs of a head and shoulders pattern.
#HYPE has certainly garnered significant attention and acclaim for being one of the few altcoins to experience a surge this cycle.
This is due to the development of an innovative product: a decentralized perpetual DEX.
It has achieved product-market fit.
Receiving considerable attention on X.
However, it is not larger than the ongoing cycle.
At one point, they were purchasing $83M worth of tokens each month—this is why it has created a distorted head and shoulders pattern with multiple necklines.
Yet, in the world of crypto, if you develop something useful,
the code, idea, or platform will inevitably be replicated.
This highlights the fundamental issue with altcoins: the absence of a competitive moat and long-term sustainability.
Recently, they began unlocking a substantial amount of tokens, and it is likely that the team is offloading them through OTC transactions.
While innovation and profitable dapps are commendable... they can also become problematic.
Here are some bear targets for your consideration.
Which you can use to your advantage on their perp DEX ;)

HYPE price analysis#HYPE Third attempt to form a bottom — will it hold above $36?
The price of OKX:HYPEUSDT is again testing the same demand zone where two previous rebounds were formed.
At the moment, the key factor remains unchanged:
Key Levels
$36 — critical level that must be reclaimed and held
$49–50 — realistic short-term target if momentum flips
Breakdown below current support would open room for a deeper retrace
A successful breakout above $36 would confirm buyer strength and could trigger a short-term rally into the New Year period.
Question: Do you expect #HYPE to reclaim $36 and move toward $50, or is another sweep of the lows more likely?
______________
◆ Follow us ❤️ for daily crypto insights & updates!
🚀 Don’t miss out on important market moves
🧠 DYOR | This is not financial advice, just thinking out loud

FireHoseReel | HYPE on 0.618 Fibonacci Decision Zone🔥 Welcome To FireHoseReel !
Let’s jump into HyperLiquid (HYPE) market analysis.
👀 HYPE 1H Overview
HYPE is currently trading near a key support zone and is forming a lower low compared to the previous bottom. This area also aligns with the 0.618 Fibonacci retracement, making it a critical reaction zone.
📊 Volume Analysis
HYPE volume has dropped significantly. The first strong increase in volume is likely to define the next major move. Volume is the most reliable confirmation here.
✍️ HYPE Trading Scenarios
🟢 Long Scenario:
A breakout above $35.945, either through a short squeeze or strong buy volume, can activate a bullish move to the upside.
🔴 Short Scenario:
A breakdown below the current support near $33.179 with rising sell volume can trigger a solid short setup.
🧠 Protect your capital first. No setup is worth blowing your account. If risk isn’t controlled, profit means nothing. Trade with rules, not emotions.

HYPE — Updated Long ScenarioDespite the fact that in my previous publication HYPE broke through my invalidation zone, the overall long picture has not been destroyed — on the contrary, HYPE has actually strengthened its bullish intentions.
With this update, my target has been moved slightly higher.
🎯 New target: 37
❌ Invalidation zone: 31.78
Let’s see how the price action unfolds from here. As always, this is not financial advice — just my personal view.

HYPE — Impulse Loading In my view, HYPE is about to start a new impulse movement. The structure looks like it’s gaining momentum, and I’m watching it very closely.
📌 My target: 36.5
❌ Plan invalidation zone: 32.499
I also believe that HYPE has the potential to move even higher than my target, but first let’s see how exactly the price approaches level 36,5.
I’ll be posting updates along the way as the chart develops.
Stay tuned! 🚀📈

$HYPE planSetting bids 40.3/39.5 area for $HYPE. With a support line on 37.77. Rsi below 50 on 1h timeframe. The orange line is an important area on low and high time frame which is why I'm bidding it.

HYPEUSDT - up trend start?If you like the idea, please put a ‘like’. It's the best ‘Thank you!’ 😊 P.S. Always do your own analysis before a trade. Set a stop loss. Capture profits in instalments. Withdraw profits in fiat and make yourself and your friends happy.

HYPE Analysis (1H)Very basic PA pattern has formed on HYPE/USDT short term chart.
Trendline is about to be gone and there is inverse head and shoulders pattern which is going to be broken very soon.
I believe the target must be around 0.618 retracement levels.
Have a good day.
HYPERLIQUID Massive H&S targets $30 and $19 long-term.Hyperliquid (HYPEUSD) has formed a Head and Shoulders (H&S) pattern, a highly symmetrical structure that is has completed its Right Shoulder. At the same time, a Channel Down has emerged that is aiming for a -43.87% decline on the current Bearish Leg, similar to the previous one, targeting $30.00 short-term.
The H&S long-term Target is the 2.0 Fibonacci extension, which as you can see matches the 0.618 Fib from the April 07 bottom. That gives a $19.00 Target.
Notice the huge 1D RSI Bearish Divergence of Lower Highs since May 25, which further strengthens the long-term bearish trend.
---
** Please LIKE 👍, FOLLOW ✅, SHARE 🙌 and COMMENT ✍ if you enjoy this idea! Also share your ideas and charts in the comments section below! This is best way to keep it relevant, support us, keep the content here free and allow the idea to reach as many people as possible. **
---
💸💸💸💸💸💸
👇 👇 👇 👇 👇 👇

Don't fight the HYPE train!The James Wynn saga was wonderful advertising for the platform.
(Maybe it was staged).
Either way #Hyperliquid goes higher.
HYPE/USDT — Breakout, Retest Zone 43.5–40.5 Before Next Leg?Overview
After weeks of persistent selling pressure and a consistent lower-high structure, HYPE/USDT has finally shown signs of life — a clean breakout above the major downtrend line that has capped price action since early October.
This breakout signals a psychological shift in market sentiment, moving from fear-driven selling into an early optimism phase, where smart money begins accumulating before the retail wave arrives.
The 43.5–40.5 zone has acted as a crucial battlefield between buyers and sellers, now transforming into a key demand base — the foundation of a potential mid-term trend reversal.
---
Pattern & Structure Analysis
Primary pattern: Descending trendline breakout followed by a minor retest above structural support.
Context: After printing a panic wick in early October, price established a higher low and then broke through the descending line of resistance.
Technical implication: Bearish momentum is fading, while bullish pressure is gradually strengthening — an early indication of trend reversal.
---
Bullish Scenario — Momentum Reignited
If price holds above 47–48 USDT, the structure can evolve into a bullish continuation pattern with clear upside potential.
A confirmed breakout above 51 USDT would likely trigger the next expansion phase toward 59.4 USDT, aligning with the previous swing high and liquidity pocket.
Bullish Confirmation Signals:
12-hour candle closes above 48–51 with increasing volume.
Successful retest around 46–47 without falling back below the demand zone.
Upside Targets:
TP1: 51.00 (initial breakout zone).
TP2: 59.40 (major resistance / previous high).
TP3 (extended target): 65+ if momentum accelerates.
---
Bearish Scenario — False Breakout Trap
If the breakout fails to sustain and 51 USDT acts as a strong rejection point, the move may turn into a liquidity sweep — a classic bull trap.
A breakdown below 43.5–40.5 would invalidate the bullish structure and expose downside risk toward 36–32 USDT.
Bearish Confirmation:
12h candle closes below 43.5 with rising sell volume.
Clean breakdown of 40.5 with no rebound — confirming continuation of the previous downtrend.
---
Conclusion
HYPE is currently at a critical transition zone — between the end of a prolonged downtrend and the potential start of a new bullish cycle.
The 43.5–40.5 region remains the key battleground.
If buyers defend this base and reclaim 51 with strength, HYPE could enter a momentum expansion phase toward its previous highs.
Failure to hold this level, however, could send price back into extended consolidation.
Trader’s focus:
Watch the 47–51 USDT range for confirmation of strength, or wait for a clean retest and bounce from 43.5–40.5 for high-probability long setups.
---
#HYPEUSDT #Hyperliquid #CryptoBreakout #TechnicalAnalysis #PriceAction #SupportResistance #SmartMoneyConcepts #BreakoutTrading #TrendReversal #CryptoAnalysis

HYPE price analysisYesterday we looked at the possible prospects of #Aster, and today let’s dive into the chart of #Hype 📉
🔥 5 consecutive red daily candles on OKX:HYPEUSDT.P — something we haven’t seen for a long time.
And there are plenty of reasons for that. We’ll name just a few, and you can add more in the comments 👇
📉 Start of a broader correction on the crypto market
⚡️ #HYPE with 300x leverage on Aster DEX, while on Hyperliquid there’s only 3x leverage for their native token — a massive imbalance attracting big arbitrage volumes that push the price down
📰 A strong media campaign “Why Aster is better than Hype” → a clear example of dirty play by big money
💡 That’s why a bounce of #HYPE from $40 shows there’s still powder in the barrels.
From $36 — also fine, a retest of the first ATH.
But a potential fall to $29–30 would trigger a full stop-loss hunt on longs accumulated over the past six months.
❓Where do you think #HYPE will find support — $40, $36, or will it slip to $30?
______________
◆ Follow us ❤️ for daily crypto insights & updates!
🚀 Don’t miss out on important market moves
🧠 DYOR | This is not financial advice, just thinking out loud.

HYPE Analysis (12H)Before anything else, pay attention to the timeframe.
It seems we have a dual bullish phase on the chart, where the second phase is a triangle, and the price is likely to soon enter wave D of this second phase. The second phase is indeed a triangle.
Within the red-marked zone, we can look for sell/short setups.
You should aim for a reasonable profit target and manage your risk accordingly.
A daily candle close above the invalidation level will nullify this analysis.
For risk management, please don't forget stop loss and capital management
Comment if you have any questions
Thank You

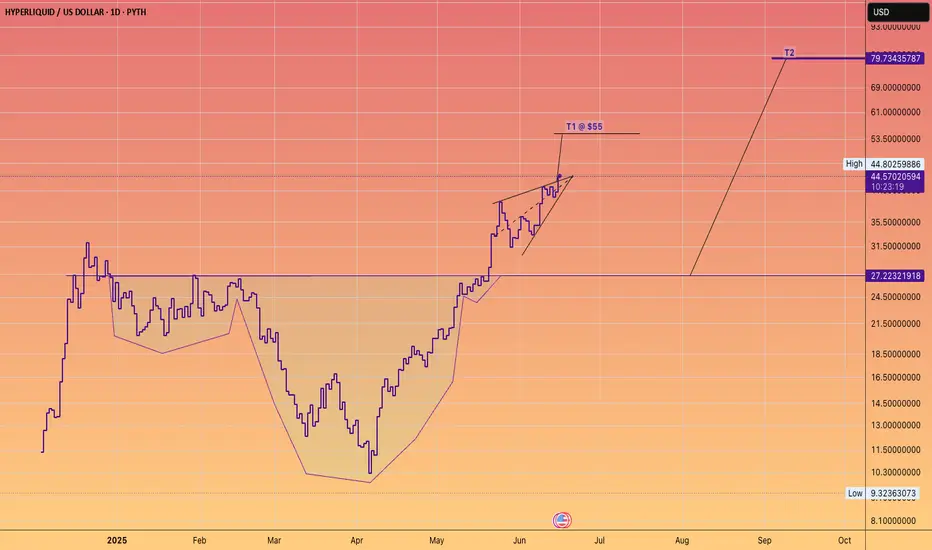
BUY AND HOLDHello friends
You can see that the price is in an ascending channel and has made a fake breakout to remove short-term buyers, but in reality this is just a price correction and there is no need to worry, and in a price correction you can buy in steps with capital and risk management and move with it to the specified goals.
Note that the holding period is at least 3 months, so be patient and observe capital management.
*Trade safely with us*

HYPE/USDT – Bullish Setup Towards $52.30Hello guys!
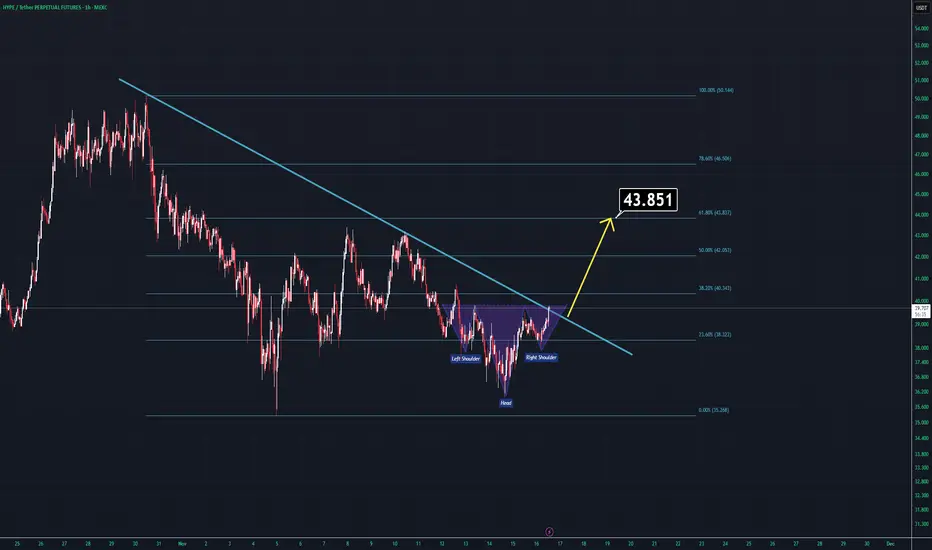
Pattern Formation: HYPE has completed a head and shoulders pattern, signaling a bullish reversal after the recent downtrend.
Trend Structure: At the same time, the price is moving within an ascending channel, confirming higher lows and higher highs, which strengthens the bullish case.
Target: The measured move from the pattern points toward $52.30, aligning with the channel’s upper boundary.
Risk Factor: If price breaks below the channel’s lower trendline, the bullish outlook would weaken and the setup could be invalidated.

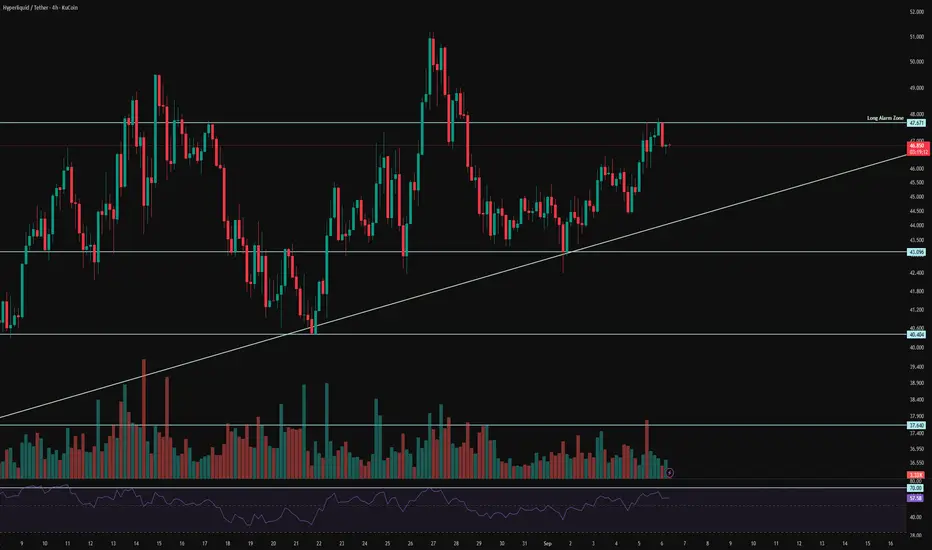
HYPE 4H Analysis - Key Triggers Ahead💀 Hey , how's it going ? Come over here — Satoshi got something for you !
⏰ We’re analyzing HYPE on the 4-Hour timeframe .
👀 On the 4H timeframe for HyperLiquid coin, we can see that the project is managed by the decentralized HyperLiquid exchange, which has become one of the notable platforms these days and has strong backing. Shortly after the news, the coin started moving toward its resistance but got rejected with a whale 4H candle from the $4,767 zone. Compared to other coins, this one has held up quite well and hasn’t gone through a deep correction. Yesterday’s rejection zone after the NFP news serves as a solid trigger point and even gives us a tight stop-loss setup.
⚙️ The key RSI level for HyperLiquid is around 70, which is the Overbought threshold. If RSI pushes beyond this zone, HyperLiquid could continue upward. Another point is that the coin’s recent price action has been moving along a trendline and has held well above the 50 level for several days.
🕯 The volume and size of HyperLiquid’s green candles have increased, showing strong upward momentum. Each time it forms a higher low, buyers respect the level and push in more volume. Based on this behavior and the previous leg up, the coin is now close to its all-time high, and with market strength, it has the potential to break that level and move higher.
📊 Looking at HyperLiquid vs. Bitcoin, there isn’t a chart available on TradingView, but you can see it on CoinMarketCap. HyperLiquid is a whale-favorite coin and has shown strong bullish performance against Bitcoin, moving steadily upward.
🔔 The alert zone for HYPE is at $47.67. If this level breaks, the coin could start a strong bullish move and head toward its all-time high.
❤️ Disclaimer : This analysis is purely based on my personal opinion and I only trade if the stated triggers are activated .
HYPERLIQUID This is its last chance to rebound.Hyperliquid (HYPEUSD) has been trading within a 4-month Channel Up and today made contact with its 1W MA20 for the first time since May 06. With the 1D MA100 (green trend-line) broken also yesterday, this is the token's last chance to find Support as it sits at the bottom of the pattern.
If it holds and doesn't close a 1W candle below the 1W MA20, this would technically be the new Higher Low that initiated the next Bullish Leg. All previous sequences reached at least the 1.236 Fibonacci extension, which is at 64.500.
If the candle fails on the 1W MA20 however, we expect more aggressive selling towards Support 1 where contact can be possibly made with the 1D MA200 (orange trend-line). In that case, our Target will be 36.000.
It is also worth mentioning that the 1D RSI is just above its 6-month Support Zone, enhancing the probabilities for a rebound.
-------------------------------------------------------------------------------
** Please LIKE 👍, FOLLOW ✅, SHARE 🙌 and COMMENT ✍ if you enjoy this idea! Also share your ideas and charts in the comments section below! This is best way to keep it relevant, support us, keep the content here free and allow the idea to reach as many people as possible. **
-------------------------------------------------------------------------------
💸💸💸💸💸💸
👇 👇 👇 👇 👇 👇

