Opening (IRA): IBIT March 20th -34P... for a 1.57 credit.
Comments: Adding at intervals at strikes better than what I have on, targeting the 25 delta strike.
Metrics:
Max Profit: 1.57 ($157)
Buying Power Effect: 32.43
ROC at Max: 4.84%
Will generally look to start taking profit at 50% max or take assignment and sell call against in the event I'm assigned shares.
IBIT

$IBIT Trading Gaps Mostly Filled - Open Gaps Higher UpI've been tracking the 4-Hour chart of the Black Rock I bit since Inception and noticed that 95% of the gaps fill similar to the CME gaps.
We can see two open gaps above in the 53 dollar range and the $45 range as unfilled.
And today we just broke through below $40 feeling a gap from November of 2024 but also creating a new Gap between $40 and $41. This could lead to upside pressure to reclaim these gaps in the future although hard to know when that would be.
There are no sizable buy limit blocks until much lower around $29 to $31.
It is however worth noting that these open gaps can be closed to where price will be magnetized in the future...
Right now waiting to see if Bitcoin will drop down to the 58k range where the 200 week SMA is which is usually a support Zone in Bear markets.

Opening (IRA): IBIT March 20th -43P... for a 1.30 credit.
Comments: Adding at intervals at strikes/break evens better than what I currently have on.
Metrics:
Max Profit: 1.30 ($130)
Buying Power Effect: 41.70
ROC at Max: 3.12%
Will generally look to take profit starting at 50% max or take assignment of shares and sell call against in the event the short put finishes in-the-money.

Opening (IRA): IBIT March 20th -46P... for a 1.42 credit.
Comments: Adding/laddering out at intervals at the 25 delta strike, assuming I can get in at break evens/strikes better than what I currently have on.
Metrics:
Max Profit: 1.42 ($142)
BPE: 44.58
ROC at Max: 3.19%
Will generally start to look to take profit at 50% max/roll down and out if it finishes in-the-money.

Opening (IRA): IBIT March 20th -48P... for a 1.37 credit.
Comments: Adding at intervals better than what I currently have on, targeting the 25 delta strike (ish).
Metrics:
Max Profit: 1.37 ($137)
Buying Power Effect: 46.63
ROC at Max: 2.94%
Will generally look to start to take profit at 50% max.

Opening (IRA): IBIT Feb 20th -45P... for a 1.07 credit.
Comments: Adding at intervals ... .
Metrics:
Max Profit: 1.07 ($107)
Buying Power Effect: 43.93
ROC at Max: 2.44%

Opening (IRA): IBIT January 30th -45P... for a 1.37 credit.
Comments: Adding at intervals at strikes better than what I currently have on (Jan 16th -47P, March 20th -52P), targeting the 25 delta strike.
Metrics:
Max Profit: 1.37 ($137)
Buying Power Effect: 43.63
ROC %-age at Max: 3.14%

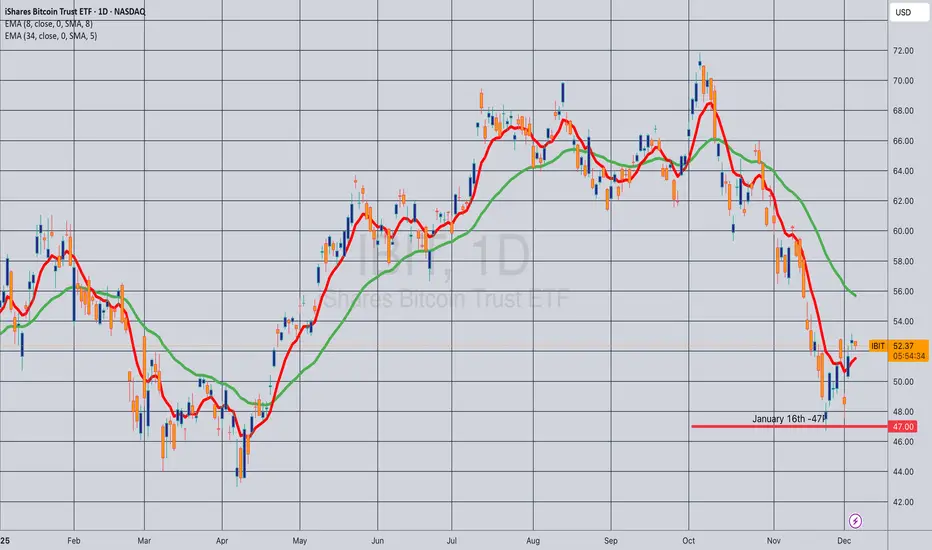
Opening (IRA): IBIT January 16th -47P... for a 1.36 credit.
Comments: Adding at intervals at strikes better than what I currently have on, targeting the 25 delta (ish) strike.
Metrics:
Max Profit: 1.36 ($136)
Buying Power Effect: 45.64
ROC at Max: 2.98%
Will generally look to start taking profit at 50% of max and/or roll to obtain assignment of shares at the lowest price the market will allow, after which I'll proceed to sell call against.
IBIT in 1H ApexAs you can see here, IBIT is consolidating inside the 100sma and the apex is in play. Likely to see continuation into the 200MAs and into the yellow box, the resistance area.
Possibly 10% in near term.

Opening (IRA): IBIT December 19th -56P... for a 1.67 credit.
Comments: A starter position at around the 25 delta strike. Will look to add at intervals, assuming I can get in at strikes better than what I currently have on.
Metrics:
Max Profit: 1.67 ($167)
Buying Power Effect: 54.33
ROC at Max: 3.07%

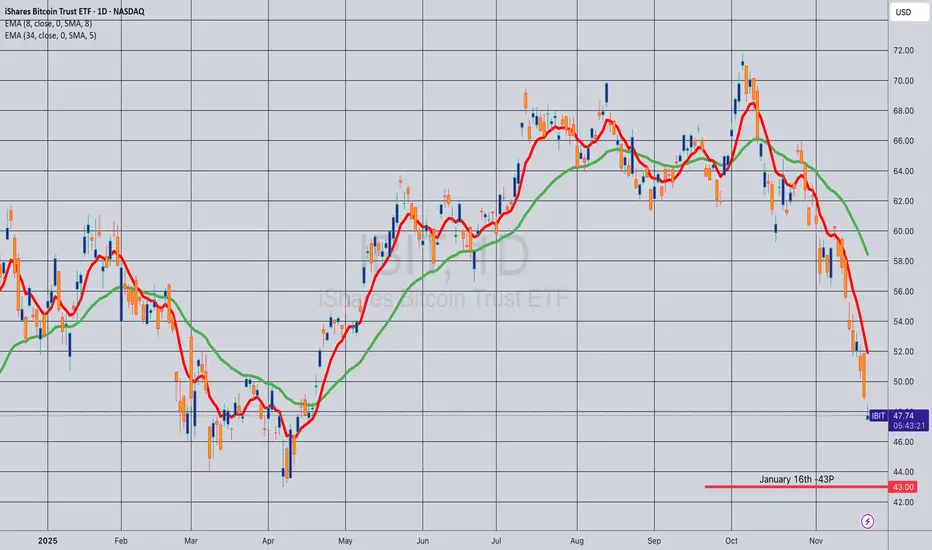
Opening (IRA): IBIT January 16th -43P... for a 2.07 credit.
Comments: Adding at intervals at strikes better than what I currently have on, targeting the 25 delta strike.
Metrics:
Buying Power Effect: 40.93
Max Profit: 2.07 ($207)
ROC at Max: 5.06%
MARA HIGH PROBABILITY BUY SETUP SOON!!!🚨 MARA HIGH PROBABILITY BUY SETUP 🚨
* Here We Can See Clearly The Next Potential Moves For MARA Coming Hours/Days.
* Keep Your Eyes Close On Your Trading Positions.
* Happy PIP Hunting Traders.
FXKILLA.

Opening (IRA): IBIT January 16th -50P... for a 2.24 credit.
Comments: Laddering out at intervals, assuming I can get in at strikes/break evens better than what I currently have on. Here, targeting the 25 delta strike.
Metrics:
Max Profit: 2.24 ($224)
Buying Power Effect: 47.76
ROC at Max: 4.69%
Will generally look to start taking profit at 50% max.

Opening (IRA): IBIT December 19th -52P... for a 2.24 credit.
Comments: High IVR/IV. Adding at strikes/break evens better than what I currently have on. Using a Plain Jane 20-ish delta short put here.

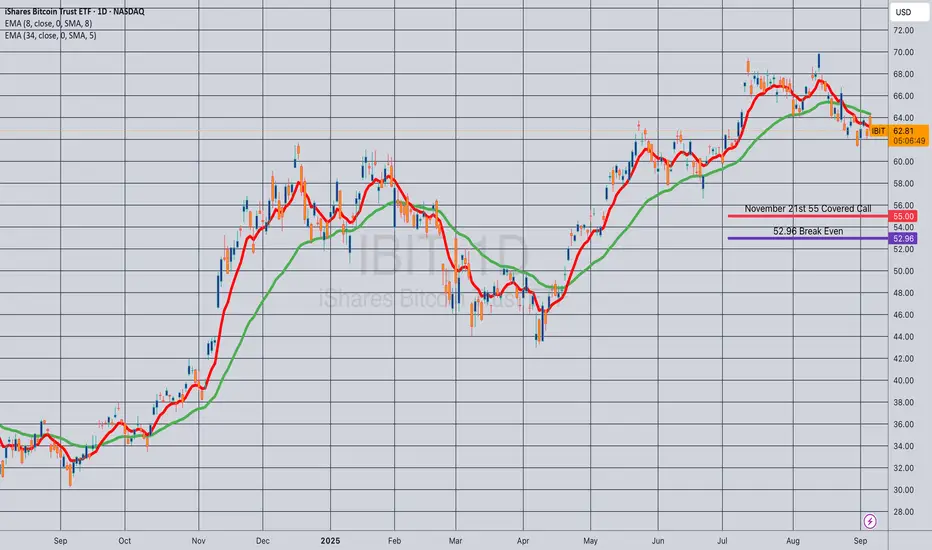
Opening (IRA): IBIT November 21st 55 Monied Covered Call... for a 52.96 debit.
Comments: Slowly building a position. Would've preferred a down day, but can't have everything. Selling the -75 delta call against shares to emulate the delta metrics of a 25 delta short put, but with the built-in defense of the short call and to take advantage of higher call side IV.
Metrics:
Buying Power Effect/Break Even: 52.96
Max Profit: 2.04 ($204)
ROC at Max: 3.85%
50% Max: 1.02 ($102)
ROC at 50% Max: 1.93%
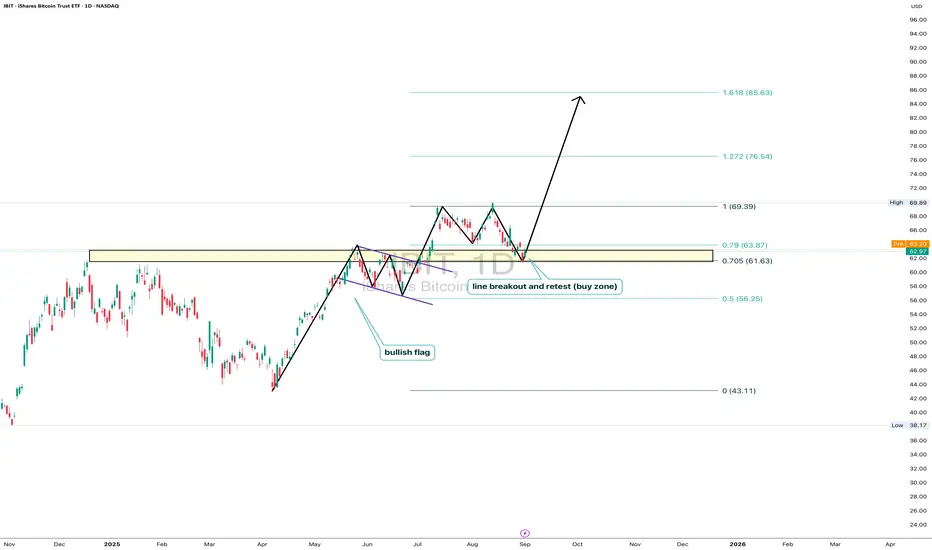
IBIT: ready for liftoffOn the daily chart, iShares Bitcoin Trust (IBIT) trades at $62.97, testing the key 0.705–0.79 Fibo zone ($61.63–63.87). This area marks a breakout and retest line, forming a clear buy zone. The technical structure remains bullish: after breaking out and pulling back, price holds potential to move toward $69.39, with Fibo extensions targeting $76.54 and $85.63. Volumes confirm buyer activity on dips, and the bullish flag pattern supports the continuation of the upward trend.
Fundamentally , the main driver is bitcoin itself, with institutional demand for BTC ETFs staying strong. Large funds continue accumulating positions, while expectations of a softer Fed tone add pressure on the dollar, fueling capital inflows into crypto. This strengthens the bullish case for IBIT.
Tactical plan: watch $61.6–63.8 as the key entry zone. Holding above opens the path toward $69.3, followed by $76.5 and $85.6. The scenario breaks only if price falls below $61.
And let’s be honest: IBIT isn’t just a ticker - it’s the “accelerate bitcoin” button for your portfolio.
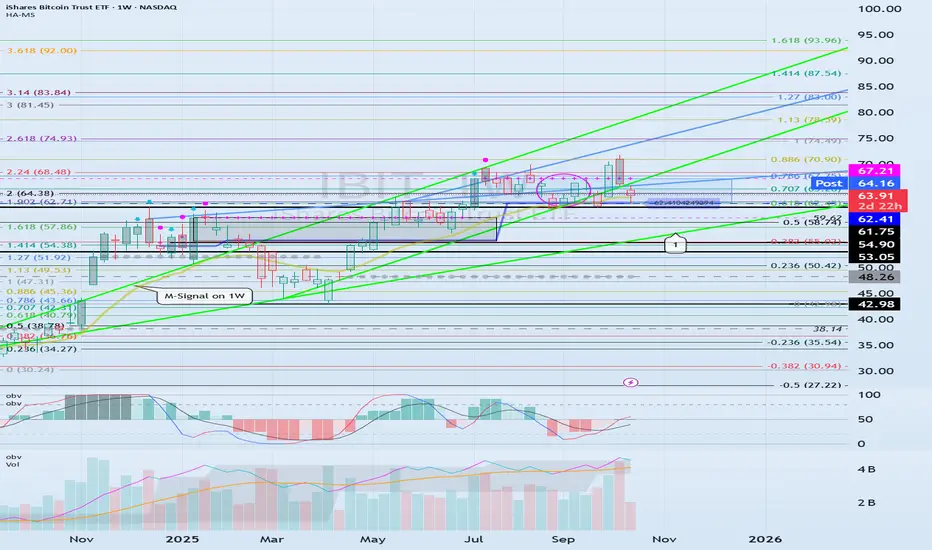
The key is whether it can rise above 67.21
Hello, traders. Nice to meet you.
By "Following," you can always get the latest information quickly.
Have a nice day today.
-------------------------------------
(IBIT 1W Chart)
Since the chart was created recently, the M-Signal indicator for the 1M chart is missing.
However, the HA-High and DOM (60) indicators indicate a stepwise upward trend.
The key question is whether the price can maintain its upward momentum above the HA-High ~ DOM (60) range of 62.41-67.21.
If it falls below 62.41, it is likely to touch the uptrend line (1) and re-establish the trend.
At this point, the key support and resistance levels are 53.05-54.90.
We need to check for support near this 53.05-54.90 range.
If it rises above 67.21, the target levels are:
1st: 74.93
2nd: 93.96
The target levels are expected to be around the first and second levels above.
--------------------------------------------------------
Because BTC is linked to the stock market and is being linked to it, it is highly likely to be affected by stock market movements.
However, it is always advisable to check the fund flow in the coin market first, as the coin market itself can exhibit price defense.
-
Thank you for reading to the end.
I wish you successful trading.
--------------------------------------------------
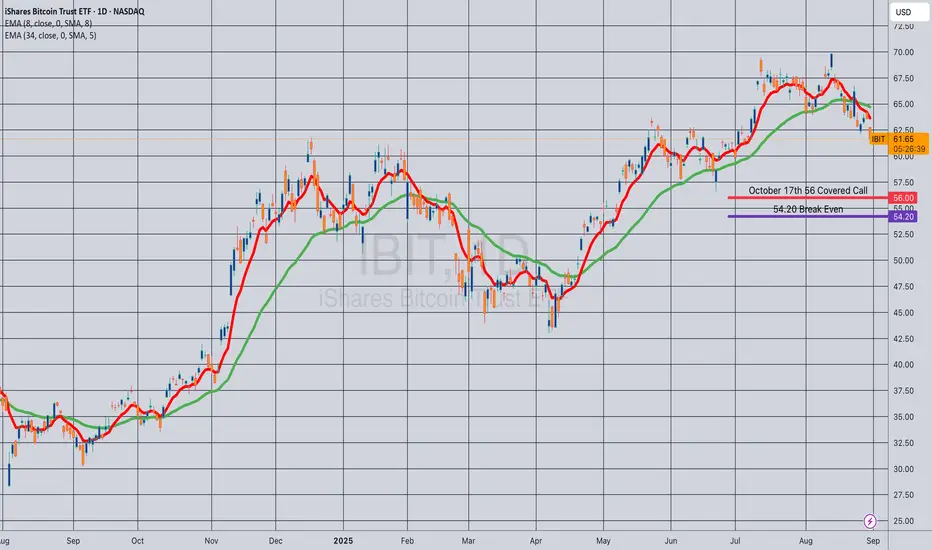
Opening (IRA): IBIT October 19th 56 Covered Call... for a 54.20 debit.
Comments: Selling the -75 call against shares to emulate the delta metrics of a +25 delta short put, but with the built-in defense of the short call and to take advantage of higher IV on the call side than on the put.
Metrics:
Buying Power Effect/Break Even: 54.20/share
Max Profit: 1.80
ROC at Max: 3.32%
Bitcoin Income: STRK vs IBIT – Dividends, Covered Calls *UpdateJoin me as I dive into my investment journey comparing MSTR, STRK (with dividend offerings), and IBIT (with covered calls) since January 31, 2025! Initially, STRK was outperforming IBIT with covered calls, but as of September 13, 2025, IBIT with CC has taken the lead. Check out the detailed breakdown:
STRK: Bought at $81.00, now at $95.65, with a 24.5% gain and 6.47% yield.
MSTR: Bought at $334.79, now at $331.44, with a 0.0% yield and -1.0% loss.
IBIT: Bought at $58, now at $66, with a 27% gain and a 12.79% yield.
BTC: Bought at $102K, now at $115K, with a 13.2% gain.
QQQ: Bought at $522.00, now at $596.66, with a 12.7% gain and 0.36% yield.
From Jan 31st to now, IBIT with covered calls has outperformed STRK, flipping the early trend. Learn how these strategies played out, my takeaways, and what this means for my portfolio. Drop your thoughts in the comments—would you adjust your strategy based on this?

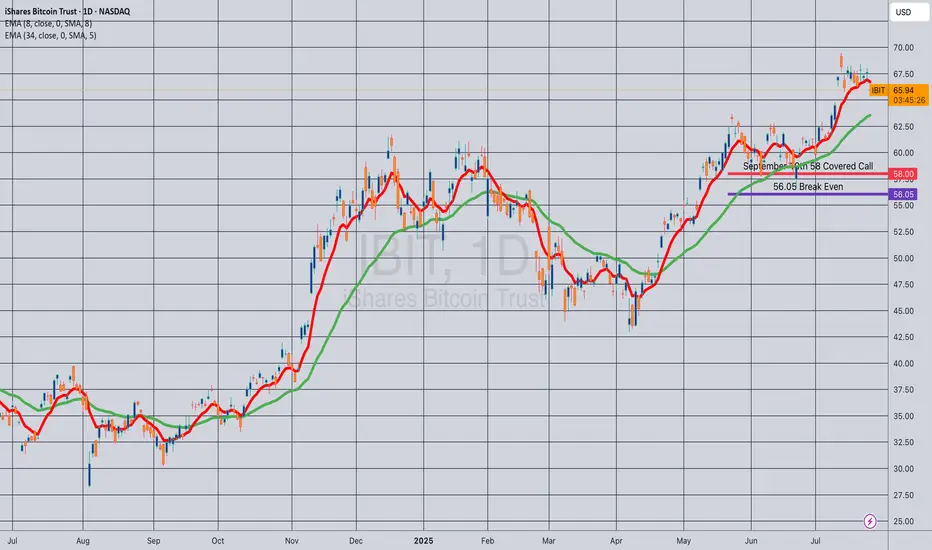
Opening (IRA): IBIT Sept 19th 58 Covered Call... for a 56.05 debit.
Comments: Selling the -75 delta call against shares to emulate the delta metrics of a +25 delta short put to take advantage of higher IV on the call side and the built-in defense of the short call.
Metrics:
Buying Power Effect/Break Even: 56.05
Max Profit: 1.95
ROC at Max: 3.48%
50% Max: .98
ROC at 50% Max: 1.74%
Will generally look to take profit at 50% max, add at intervals assuming I can get in at break evens better than what I have on.
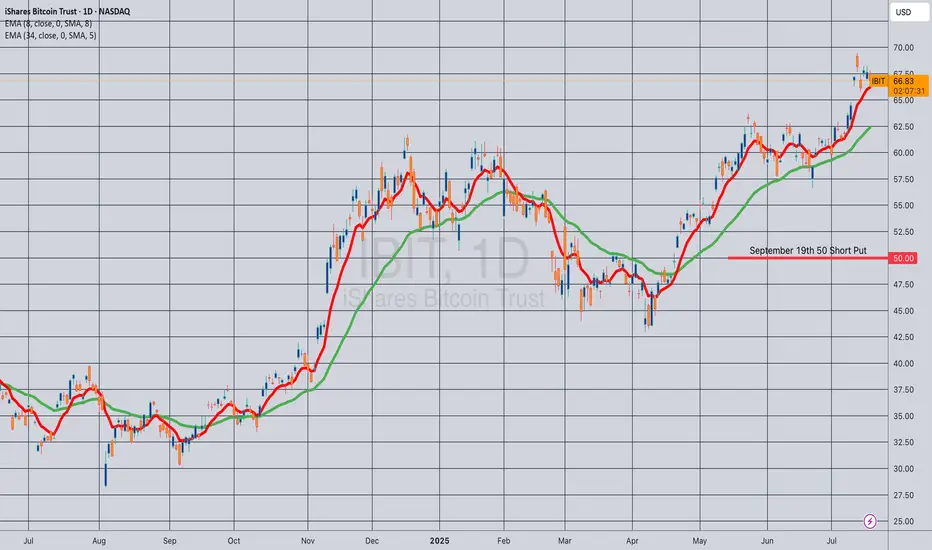
Opening (IRA): IBIT September 19th 50 Short Put... for a .52 credit.
Comments: Laddering out/adding at strikes better than what I currently have on, targeting the strike paying around 1% of the strike price in credit.
Will generally look to roll up at 50% max at > 45 DTE (Days 'Til Expiration).
ibit Bitcoin ETF LONG now is a good time to invest. If you go on Google and type in far side Bitcoin and click the link that goes to the farside uk Bitcoin site. You'll see the daily money flows into or out of all of the different Bitcoin ETFs. If you do the same thing but type ethereum instead you'll see all of the different inflows and outflows of money into the ethereum ETF.
This is important because with the Bitcoin ETFs you'll see that there's been hundreds of million dollars in inflows in the past week. Yet both the 19th and the 20th had outflows of money. 1 and 1/2 weeks ago the same thing happened there were two days without flows of money and then it continued with major inflows of money.
In my opinion I believe this is because the large corporations and investors put too much money in to the ETFs in order to manipulate it so that it will gain a higher value.
They also talk to each other and plan these events so that they can profit from them. So let's take five fake companies that we just call 1 2 3 and 4 and 5. These five companies will all talk to each other on the phone and tell each other well we want to put in 200 million over the course of the week well we want to put in 300 million over the course of the week.
Over the course of one week
Company 1 wants to put in 200 million
Company 2 wants to put in 300 million
Company 3 wants to put in 400 million
Company 4 wants to put in 250 million
Company 5 wants to put in 300 million
Total 1.45 billion, they want that money to stay in Bitcoin at their investment.
Like I said they all plan this to manipulate Bitcoin in my opinion.
This is what happens:
Company 2 puts in 600 million
Company 2 puts in 700 million
Company 3 puts in 800 million
Company 4 puts in 450 million
Company 5 puts in 600 million
Total real investment 3.15 billion
Why do they do it?
This is only an example but over the course of one week these companies wanted to put in 1.45 billion but they ended up putting in 3.15 billion.
3.15 billion
1.45 billion -
-------
1.70 billion + surplus
So they put in 1.70 billion dollars over the amount that they were supposed to in order to get a rally going where Bitcoin goes up in value by a lot.
They are also in contact with the stock market listed Bitcoin mining companies so that the Bitcoin mining companies do not sell the Bitcoin. Instead they Bogart the Bitcoin (keep it) so that they can sell at a higher price when the companies get back in touch with them to say it's time to sell.
All of silicon valley is involved as well I believe in my opinion. All the tech companies and private investors with a lot of money and who knows maybe Mr SpaceX and Mr Amazon are also involved.
It's like a cabal. (Private political group) But for cryptocurrency.
So when this rally happens of course other people buy into the ETF like your average Joe. Hoping to profit.
What happens?
The ETF goes higher in value which means Bitcoin goes a lot higher in value. Maybe it will go up to 125,000 this time? Or maybe it will go up to 130,000 this time before going down?
What's the point?
The point is they are going to be selling that 1.7 billion dollar surplus because they only had 1.45 billion that they were going to put in.
That 1.7 billion dollar surplus that got the rally going and when it's time to sell could possibly be worth 7% to 8.5% more. Plus they're all putting in their own money into it because it's like insider trading. When you're putting your money into a stock as an institutional investor of course you're going to put your own money into it too so these people are putting 50 million dollars by themselves, 500 million by themselves. Who knows?
So surplus of 1.7 billion + 7% is now worth 1.819 billion or a gain of 119,000,000 million dollars. So they sell and they make $119 million for their company. Plus how much do they make for themselves and all of their cohorts that they are in contact with?
Insider trading at its finest.
This happens with all companies. Take for instance an airline. Companies know that maybe airlines will go up in the summer. Or they know that it will go up in the travel season for the holidays Thanksgiving and Christmas. So all the different companies they get in touch with each other and they say hey we're going to buy $5 billion of airline one and then the other company tells them okay we're going to buy 2 billion of airline one. Of course again they're all putting in their own money as well.
The Bitcoin rally is not over. We may see as high as 138,000 this rally. Before the bear market hits.
Some say we could see 420,000. I'm not sure about that I wonder if that's for the next rally in 2028 after the halving?
Will you take a leap of faith and do the right thing for humanity and leave a comment under this post with what your opinion is?

Something I've never ever seen before. Strange? You tell me!getting right to the point there are two charts both XRP The top is the two hour time frame and the bottom is the one hour time frame. As you can see they are both using the squeeze momentum indicator. Have you ever seen before in your life that the two hour time frame would show green already while the one hour time frame would still be in the red for the squeeze momentum indicator? I've never seen that before. Always I've seen that the one hour time frame would go green before the 2 hour time frame. Any comments are appreciated on this matter. Interesting? I'd say so. A bit confusing? Yes. by the way a quick plug for myself if you don't know how to do this I'll create any indicator you want. the catch is I'm making it for myself too
