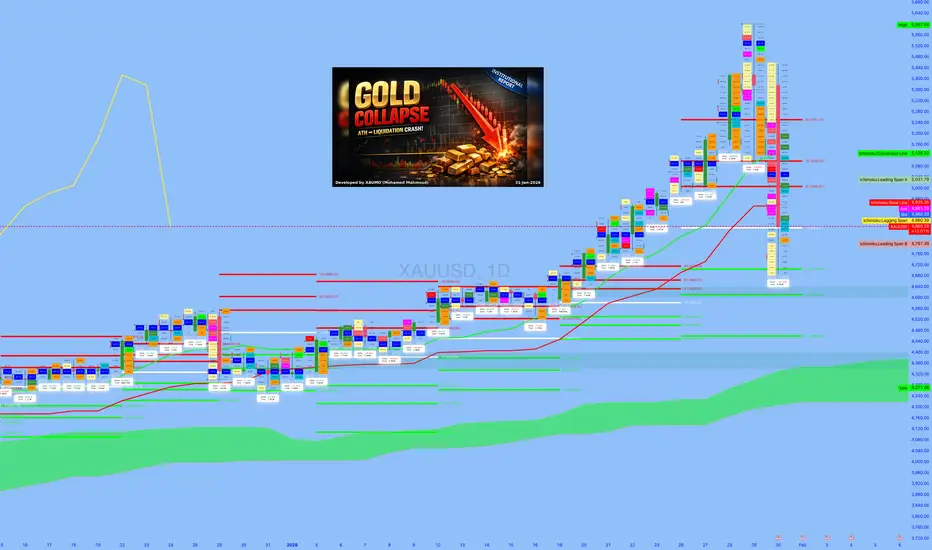
GOLD COLLAPSE
Instrument: XAUUSD (Gold) | Date: 31-Jan-2026
Context: ATH impulse → Friday liquidation → post-break value migration
Inputs: Your 15m / 1H / 4H / 1D / 1W / 1M charts + FRVP/FVRP map + volume footprint
EDUCATIONAL ONLY — Not financial advice — Not trade signals.
══════════════════════════════════════════════════════════════════════
1) EXECUTIVE SYNTHESIS (WHAT WE CONCLUDED THIS SESSION)
• Gold printed an ATH shelf around 5595–5597 (weekly/monthly high marker) then
collapsed violently on Friday into the ~4860 region (your screen’s bid/ask zone).
• This sequence is structurally consistent with “blow-off → distribution → forced unwind.”
The key is NOT the candle shape; it’s the auction migration: value left the upper
acceptance band and rotated down into a new lower composite balance.
• FRVP/FVRP inference from your rails: the market is transitioning from the 51xx–55xx
distribution inventory into a 49xx–48xx composite value area. This implies:
(A) upside bounces face heavy overhead supply until acceptance reclaims key rails,
(B) downside becomes controlled by the decision rail cluster 4804/4771 and the
hard-defense band 4712–4686.
2) AUCTION LOGIC: ATH → COLLAPSE = VALUE MIGRATION (NOT RANDOM VOLATILITY)
• Upper distribution completed at/near ATH: late-stage extension produced “fresh
inventory” (late longs, momentum funds, options hedging), which is vulnerable to a
regime shock (USD/rates).
• Liquidation cascade mechanics:
- Break prior HVN/POC supports → accelerate through LVNs (thin participation zones)
- Find the next HVN/value shelf → stabilize → rotate (balancing/accumulation pocket)
3) FRVP/FVRP MAP (DISTILLED FROM YOUR WEEKLY/MONTHLY/DAILY/4H RAILS)
A) Overhead Supply / Repair Ceilings (resistance ladder)
R1: 4922–4923 (macro + LTF sell rail confluence)
R2: 4944–4948 (local highs / immediate overhead)
R3: 4992–4996 (monthly “repair ceiling” / acceptance test)
R4: 5047–5048 (weekly breakdown rail; reclaim changes regime)
R5: 5108 → 5255 (prior weekly acceptance band; heavy inventory)
R6: 5563 → 5595–5597 (late-stage cap / ATH shelf; only after full repair)
B) Active Supports / Defense Pools (downside ladder)
S1: 4866–4855 (sweep/reject absorption pocket)
S2: 4816–4796 (LTF buy rails / local low zone)
S3: 4804–4771 (monthly breakdown + decision rail)
S4: 4712–4686 (4H hard support band / next “must-hold” if balance fails)
S5: 4617–4606 (liquidation shelf / last line before daily demand)
S6: 4509–4495 (daily demand shelf; larger repair base if reached)
S7: 4358 (deep daily rail; tail support before weekly 39xx zone)
4) VOLUME FOOTPRINT TAKEAWAYS (WHY FRIDAY LOOKED LIKE THAT)
• The down leg displayed characteristics of “initiative selling” (urgent liquidation):
stacked sell imbalances and fast travel through low-acceptance zones.
• The stabilization zone near 4866/4855 printed “sweep + reject” signatures:
- Sweep = liquidity run through resting bids/stops
- Reject = close/reclaim back above the swept level
Institutional read: responsive buying/absorption (not the same as trend reversal).
• Conclusion: market likely moved into “balancing/accumulation pocket” at lower value,
while overhead inventory remains dominant until proven otherwise via acceptance.
5) KEY TECHNICAL DECISION POINT (NEXT 1–3 WEEKS)
• The session’s primary “decision rail” is the 4804/4771 cluster.
- Hold above it: repair-range probability increases (auction rotates, builds value).
- Accept below it: continuation liquidation becomes dominant (4712–4686 → 4606 → 4509).
6) WHAT DROVE THE ATH IMPULSE (LAST WEEK’S STACKED RISK PREMIUM)
We framed the ATH week as a multi-driver stack rather than a single data print:
A) Safe-haven rush + geopolitical premium
• Risk headlines and uncertainty created a “fear bid,” reinforcing gold’s role as a hedge.
B) “Debasement / policy independence” narrative + USD softness (pre-Friday)
• Market discourse leaned toward hedging USD credibility and policy unpredictability,
which historically increases gold’s convexity to negative headlines.
C) Positioning and momentum mechanics (microstructure fuel)
• Once successive psychological/technical levels broke, flows can shift from “allocation”
into “forced chase”: trend-following, vol-control, and options gamma hedging amplify
upside in a grind. This sets up fragility: when the regime flips, exits become crowded.
7) WHY IT COLLAPSED ON FRIDAY (REGIME FLIP → USD + REAL-RATE REPRICING)
• Session conclusion: the Friday collapse was driven by a market regime shock to the
rates/credibility narrative (Fed leadership succession storyline). Mechanism:
- USD strengthened and rate expectations repriced → gold de-levered rapidly.
• Structural point: after ATH, the market holds maximum “wrong-way inventory,” so a USD
spike can trigger forced selling, accelerating drops through LVNs until the next HVN.
8) CROSS-ASSET TRANSMISSION MAP (CONFIRMATION BOARD)
A) USD (DXY proxy)
• Primary lever: strong USD bid = headwind for gold; gold rallies tend to fail at repair
ceilings when USD is persistently rising.
B) Rates (nominal + real yield expectations)
• Higher real-rate expectations compress gold’s multiple; lower real-rate expectations
tend to support gold. The Friday tape behaved like a “real-rate/credibility shock.”
C) Equities (SPX/NDX) + Vol (VIX)
• When “USD up + rates up” drives the tape, both duration assets and gold can fall.
• Gold trends best in “risk-off with USD down” (confidence shock / debasement regime).
• “Risk-off with USD up” often yields choppy gold (spike then fade), not a clean trend.
D) Metals beta (silver)
• Silver behaves as high-beta precious metals positioning; it can confirm crowding and
the violence of the unwind when the trade reverses.
9) GEO-MACRO THEMES DISCUSSED (THEATERS AS GOLD RISK-PREMIUM CONTRIBUTORS)
We structured geopolitics as “theater → transmission → gold levels”:
• Arctic/Greenland/Europe reliability: functions as alliance reliability premium and trade
spillover risk; supportive when it weakens confidence/predictability.
• Russia/Ukraine/energy: inflation uncertainty + Europe growth risk can support gold,
but can also create a two-way response if it raises rates/real yields.
• Israel/Iran: classic war-risk premium; may produce spikes that fade if USD bid dominates.
• China/Taiwan + Asia physical: viewed as structural “floor builder” over time; does not
prevent drawdowns but increases odds of absorption at major value shelves.
• Venezuela/LatAm: typically a tail cluster amplifier; rarely a solo trend driver, but it
stacks into the broader risk premium when USD credibility is in question.
10) 3-MONTH OUTLOOK (FEB–APR 2026): INSTITUTIONAL SCENARIO TREE
A) Scenario A — BASE CASE “RE-AUCTION / REPAIR RANGE” (highest probability)
• Thesis: post-liquidation balance forms. Price oscillates between a lower floor band
(4804/4771 into 4712) and a repair ceiling band (4995 into 5048).
• Path: defend absorption pocket → probe resistances → accept/reject decides speed.
• Confirmation: sustained acceptance above 4995, then above 5048.
B) Scenario B — BULL CASE “V-SHAPE RECLAIM” (lower probability)
• Thesis: Friday was capitulation; absorption expands; shorts trapped.
• Requirements:
1) Hold above 4804/4771 (no sustained value acceptance below)
2) Quick reclaim of 4923 then 4995
3) Break/accept 5048 (weekly reclaim)
• Targets: 5108 → 5232 → 5307/5374 (ATH shelf only after multi-week repair).
C) Scenario C — BEAR CASE “VALUE BREAKDOWN CONTINUATION” (meaningful risk)
• Thesis: bounce is mainly short-covering; sellers reassert at 4923/4995.
• Sequence: failure at resistances → break 4804 → accept below 4771 → 4712/4686 →
4606 → daily demand 4509/4495 (tail 4358 if macro compounds).
11) US GOVERNANCE SHOCK SECTION (ORGANIZED BY SEVERITY ON GOLD)
We added a dedicated governance chapter requested by you, ranked by probability of
forcing a USD/rates regime shift (the most gold-relevant mechanism):
Severity 1 (Highest): FED SUCCESSION / POWELL FIASCO (Powell → Warsh narrative)
• Direct channel: USD + real-rate expectations repricing → immediate gold repricing.
• Technical link:
- Bull repair requires acceptance above 5066 then 5137/5232.
- Bear continuation opens if 4909 fails → 4795 → 4741/4713 → 4668 → 4606/4509.
Severity 2 (High): GOVERNMENT CLOSURE / FUNDING PARALYSIS
• Can raise volatility and growth risk; gold response depends on whether USD becomes the
liquidity refuge. Best gold regime is shutdown stress that weakens USD credibility or
pulls real-rate expectations down.
Severity 3 (Medium): ICE / MINNESOTA CIVIC INSTABILITY CLUSTER
• Usually a “legitimacy premium” that fades unless it escalates into sustained paralysis.
• Cross-asset signature matters:
- Vol up + yields down + USD not surging = gold supportive.
- Vol up + USD up + yields up = choppy (spike/fade).
Severity 4 (Low→Medium): EPSTEIN FILES RELEASE
• Typically narrative/trust shock only; becomes gold-relevant only if it catalyzes legal/
political paralysis that feeds into shutdown risk or broader legitimacy crisis.
12) EXECUTION PLAYBOOK (HOW WE SAID TO TRADE THIS LIKE A DESK)
Rule 1: Don’t trade the headline. Trade the regime.
• Regime = USD direction + real-rate direction + risk/volatility state.
Rule 2: Upside is not “real” until acceptance reclaims the repair rails.
• First: 4923 then 4995 acceptance; structural change only after 5048 reclaim.
Rule 3: Downside is not “real” until breakdown rails break AND fail retest.
• Key: 4804/4771; if accepted below, the next auction targets 4712/4686 then 4606.
Rule 4: Use footprint confirmation:
• Bottoming = aggressive sell delta + price stops going down (absorption) + reclaim LVN.
• Topping = aggressive buy delta + price stops going up (distribution) + breakdown HVN.
13) “WHAT TO WATCH NEXT” CHECKLIST (NEXT WEEK)
• Does the 4866/4855 pocket keep printing “sweep → reclaim → hold”?
If yes: stabilization/balance is real.
• Do rallies repeatedly fail at 4922/4923 or 4995?
If yes: overhead supply remains dominant; range/mean-reversion favored.
• Most important: 4804/4771 decision rail behavior.
Hold above = repair; accept below = continuation to 4712/4686 → 4606 → 4509/4495.
ICE
ICE Eyes $5B MoonPay Deal as Institutions Deepen Crypto PushIntercontinental Exchange (NYSE: ICE) is reportedly in advanced talks to invest in crypto payments firm MoonPay at an estimated $5 billion valuation, marking a major step in Wall Street’s growing involvement in digital assets. The potential deal represents a sharp jump from MoonPay’s $3.4B valuation in 2021 and underscores renewed institutional confidence amid a more constructive regulatory environment.
From a fundamental standpoint, the move aligns closely with ICE’s long-term digital asset strategy. As the parent company of the New York Stock Exchange, ICE brings deep market infrastructure expertise, while MoonPay offers a compliant fiat-to-crypto on-ramp used across wallets, exchanges, and enterprises. MoonPay’s recently secured NYDFS Limited Purpose Trust Charter, along with its BitLicense, positions it among a small group of crypto firms fully authorized to operate in New York. This regulatory credibility significantly reduces counterparty risk for traditional financial institutions looking to integrate blockchain-based services.
The reported investment also follows ICE’s $2B commitment to Polymarket, highlighting a broader push into blockchain infrastructure, prediction markets, and tokenized financial services. Strategically, ICE appears to be positioning itself early in areas where regulated crypto payments, custody, and market data could converge with traditional exchanges. While crypto market volatility and regulatory shifts remain risks, the valuation jump signals increasing legitimacy and institutional acceptance of crypto service providers.
Technical Analysis:
On the chart, ICE remains in a long-term uptrend, trading above its rising 200-day moving average despite a recent pullback from highs near $189. Price has retraced toward the $150–155 zone, which aligns with the 100-day moving average and a prior breakout area, suggesting a key support region.
Momentum has cooled, but structure remains constructive as long as ICE holds above the rising trendline and the 200-day MA. A successful base here could open the door for a continuation move toward prior highs, while a loss of $150 would shift focus to deeper trend support

Sugar!!If you like my Idea, Don't forget to Boost and comment on my Analysis.. The recommendations are purely for educational purpose only, consult you financial advisor before trading.

Ice/UsdtOKX:ICEUSDT
**Ice Coin Overview**
- **Market Cap**: $39.5M 📊
This represents the total market value of all Ice Coin in circulation. It’s a key indicator of the asset's size in the crypto market.
- **24h Volume**: $10M 💵
This is the total trading volume in the last 24 hours. A higher volume usually indicates increased interest and activity in the coin, which could lead to price changes.
- **Fully Diluted Valuation (FDV)**: $126.32M 💎
FDV represents the total value of the coin if all tokens were in circulation. It gives a sense of the potential market value based on the total supply.
- **Total Supply**: 2.115B (2.115 billion coins)
This is the maximum number of Ice Coin that will ever exist. The current circulating supply may be smaller, but this is the cap for the coin's supply.
- **Current Price**: $0.005967 💰
This is the current trading price of the Ice Coin in the market. At this price, the coin is relatively low, and small price changes could have a larger percentage impact.
---
### **Resistance and Support Levels Explained**
- **Resistance**: $0.00600 📈
Resistance levels are price points where selling pressure is strong enough to halt the price from going higher. For Ice Coin, **$0.00600** is the immediate resistance level. If the price breaks and holds above this point, it could indicate continued bullish momentum (price moving up).
- **Next Resistance Levels**:
- **$0.0069534** 🚀
- **$0.00700** 🚀
These are the next levels where price could face resistance after breaking the $0.00600 mark. If the price successfully reaches and holds these levels, it indicates strong upward momentum. Traders will likely be watching these points to see if Ice Coin can break through and continue growing.
---
- **Support**: $0.05643 ⚖️ & $0.05500 ⚖️
Support levels are price points where buying pressure is expected to be strong enough to prevent the price from falling lower. If Ice Coin doesn't manage to break through the $0.00600 resistance, it could fall back to these support levels. If the price holds at these points, it may bounce back upward.
- **Next Support Levels**:
- **$0.00500** ⚖️
- **$0.00400** ⚖️
These are critical support levels where the price could find a strong buying interest if it falls below $0.05643. If the price drops below these support levels, it may indicate a bearish trend, and the price could continue to fall.
---
### **What This Means for Traders**
- **Increased Volume**: If trading volume increases, it could signal that more people are interested in buying or selling Ice Coin, which could push the price either upward (bullish) or downward (bearish), depending on how the buying and selling balance out. The volume is a key indicator to watch.
- **Breaking Resistance**: If the price breaks the $0.00600 resistance and holds above it, this would be seen as a bullish signal, meaning the price could keep rising. The next target would be $0.0069534 or $0.00700.
- **Falling Below Support**: If the price can’t hold the support levels at $0.05643 or $0.05500, the next downside targets are at $0.00500 and $0.00400. This would be seen as a bearish trend, and traders would be cautious about the price dropping sharply.
---
**⚠️ Important Note**:
This is **not financial advice**. Cryptocurrency is highly volatile, and prices can change quickly. Always do your own research (DYOR) and consider consulting with a financial advisor before making any trading decisions. 🚫
---

Cocoa Futures!!If you like my Idea, Don't forget to Boost and comment on my Analysis.. The recommendations are purely for educational purpose only, consult you financial advisor before trading.

ACE/USDT NEW INCREASE VOLUMEThe latest data shows that ACE might increase in volume after the market drop. We will keep watching to see if this coin can rise in the coming time.
We will monitor this coin to check for any confirmations.

Intercontinental Exchange (ICE) AnalysisStrategic Moves and Regulatory Tailwinds:
Intercontinental Exchange NYSE:ICE is set to benefit from recent SEC regulatory proposals that could shift more trading volume back to public exchanges, enhancing ICE's competitive position. Additionally, ICE's $13 billion acquisition of Black Knight Financial will bolster its presence in the mortgage technology sector, providing comprehensive exposure to the mortgage origination value chain.
Investment Outlook:
Bullish Outlook: We are bullish on ICE above the $124.00-$125.00 range.
Upside Potential: With an upside target set at $195.00-$200.00, investors should consider ICE's strategic acquisitions and favorable regulatory environment as key drivers for potential stock appreciation.
📊🏦 Monitor Intercontinental Exchange for promising investment opportunities! #ICE #MarketGrowth 📈🔍

SPX500 - bullish Adsorption or minor sign of strength
The Weis-methods shows clearly that the ice is tested for a following up-move.
-first lines converged
-strong down movement cutting the chanel
-a strong spring acoured and brought the price to the highest point and through the strong midpoint like a hot knife cutting butter
-actually the midpoint is tested very strong
-reaccumulation needed

SPX500 - Absorption takes time .. takes placeThe Weis-methods shows clearly that the ice is tested for a following up-move.
-first lines converged
-strong down movement cutting the chanel
-a strong spring acoured and brought the price to the highest point and threw the strong midpoint like a hot knife cutting butter
-actually the midpoint is tested

1INCHUSDT.P 1H long trade at resistance5M chart allowed to enter early
Aggressive trend trade 8R
- short impulse
+ resistance level
+ biggest level T1
+ biggest level 2Sp-
+ weak test
+ below first bullish bar closed entry
Calculated affordable stop
1 to take profit (can extend to 1 to 2 of 1H if closes volumed Sp)
1H chart situation
+ long balance
+ resistance level
- expanding ICE level
1D chart context
+ long impulse
+ significant bar level

NEW YORK SUGAR FUTURES: ST DOWNSIDE CORRECTION IS TAKING PLACEThe New York Sugar Futures continues performing as anticipated. The expected ST downside correction is taking place .

NEW YORK SUGAR still showing bullish tendencyNEW YORK SUGAR continues performing as anticipated. After the completion of the wave 4 correction, the market resumed rally to complete the wave 5 of the same degree.

ICE - Short Term Burst Before The Fall Continues?Following the recent sell off in the US market and general nervousness of investors is Intercontinental Exchange Inc attractive for short term gains?
Let's look at it in more detail.
Fundamental indicators:
Revenue and Profits - demonstrated consistent long-term earnings growth over the past 10 years
Profit margin - varies between 25% and 40%, so it is highly efficient company
P/E - 13.4x which is considerably lower than the current S&P500 ratio
Liabilities - liabilities to assets are within the norm, but debt to equity has been rising for several years and considered to be high
Technical Analysis (Elliott Waves):
Following the correction of March 2020 shares of ICE have enjoyed explosive growth cycle which is visibly slowing down now
And when the fifth wave is forming by a choppy movement in price it is very likely to be an Ending Diagonal, in this case Expanding one
It is likely that wave 4 has completed and we can expect another zig-zag to the upside to update the historic high of $139
Alternative Scenario: one of the risks with this scenario is the exceeding depth of wave 4 so as an alternative it is possible that the whole wave 5 has already completed, let's see how things develop
What do you think about ICE and its short term prospects?
Also let me know if you would like to see other stocks, indices, Forex or Crypto analysed using Elliott Waves.
Thanks
PS Below is the Educational post about Ending Diagonals

ICT Short EURUSD OTE Entry (just mute, I cannot disable laptop mic)
Another example of an NY trade today, Shorted the higher time frame bias, Have marked the chart up to show my logic, When you determine what you are looking for to fit criteria pre market and pre trade IE ( A rules based system) its much easier to sit back and wait for the boxes to tick themselves, I dont force trades and I don't make the market give me something, I just ride the wave.
This is another FTMO DEMO ACCOUNT pass for me while still testing this Strat, in just this trade. The market is making these moves everyday, Deciphering the chart and looking for evidence is all I do, It doesn't need to be more complicated, I truly believe that, I know my chart looks dirt but I've written all over it for this video and I'm also colour blind so trust me, In my eyes its beautiful (lol) -
Side note, If your studying ICT or OTE etc etc hit my inbox to join a discord with me, I'm not selling anything I'm not looking for anything other than to exchange ideas with like minded people as trading is a lonely game, What ever stage of your journey you are at. Hit me up lets start a conversation, Especially if your a London / NY session trader..

17% movement upwards for $ICEI have been preaching that $ICE is undervalued and the Wonderland FUD will die off, allowing $ICE to show its strength. Today, with all the bullish momentum in the market, $ICE is up 17%. When others are fearful, we are brave. My stabilized price target is ~$20-30 range. This means at least a 4x from here. Time frame from the start. has been 2-3 months, perhaps sooner if the market recovers appropriately.

UPDATE for ICE: ManipulationRecently we have had some manipulation in ICE with the yellow X's showing a large amount dumped quickly. This is likely to bring the price lower so that whales can buy back in the mid-high 3 dollar range. Not much sell pressure if you look at the order book. My understanding is that right now, it is time to accumulate and buy so that we can reap rewards with patience. When hope feels lost and people begin to sell, thats when we buy good projects like $ICE. We will see higher price levels in the future.

BKKT Extreme Volatility Option CallsBKKT is now at all time low, $3.41, after almost 3 months ago it was trading at $51.
Bakkt is oversold for the last 24 days!
But yesterday i noticed the highest out of the money calls that implied a huge volatility for BKKT: $35 strike price expiring May 20!
I haven`t seen such a 900% price difference since the GME calls 2 years ago.
This might be a great buy opportunity! if you don`t know BKKT, here are some details:
Cryptocurrency exchange Bakkt has a partnership with Mastercard to offer crypto debit and credit cards.
Bakkt has announced a separate deal with Fiserv .
Bakkt also partnered with Google to allow its users to purchase goods and services using cryptocurrencies through the Google Pay wallet.
Manasquan Bank, a NJ-based mutual community bank will be participating in its early adopter program, which will allow the bank’s retail clients to buy, sell and hold cryptocurrency through the bank’s mobile banking app.
BKKT`s Market Cap is 194Mil, basicaly a penny stock, lower than some of the most obscure crypto exchanges utility tokens.
And when you think Bakkt is owned by ICE, Intercontinental Exchange , the company who owns the New York Stock Exchange!
How high can this stock skyrocket from here?

BKKT 15K calls expiring today + Dark Pool Prints More than 15K calls on BKKT are expiring today. and those are the calls from the last month only.
The strike price varies from 14 to 75usd.
The price of the stock is now 9.08usd.
Yesterday we saw a volume of 32mil.
Besides the 32mil, Dark Pool Prints were 33Mil.
Dark pools are private exchanges not accessible by the investing public. Dark pools facilitate block trading by institutional investors who did not wish to impact the markets with their large orders and obtain adverse prices for their trades.
I expect strong intraday volatility.
i know it seems a little bit exaggerated, but i wouldn`t be surprised the see BKKT trading at 14-15usd.
don`t forget that on Nov 21 BKKT was trading at $50.80.
Looking forward to see how this trading day will end!
What is your opinion about this trade?

BKKT vision is to connect the digital economyBakkt taps into the $1.6+ trillion of digital assets across cryptocurrencies, rewards and loyalty points, gaming assets, gift cards and beyond.
BKKT allows consumers to aggregate digital assets, access liquidity and trade, transfer and pay however they want.
Cryptocurrency exchange Bakkt announced a partnership with Mastercard to offer crypto debit and credit cards.
Thanks to Mastercard and Bakkt, businesses and banks will be able to issue their own branded crypto debit and credit cards to consumers who want them.
How big do you think this can be?
Bakkt's also announced a separate deal with Fiserv .
Gavin Michael: “We want to provide consumer choice. We want to be able to provide the availability to use crypto currency in an everyday transaction,”
Is this the start of crypto adoption or what?
Bakkt also partnered with Google to allow its users to purchase goods and services using cryptocurrencies through the Google Pay wallet.
Buying BAKKT in this area looks like a great opportunity in my opinion!
My price targets are: 17usd short term, 26usd mid term, an 35usd by the end of 2022.
BKKT depends much on the adoption. in the most favorable scenario, we can see a spike to $60 anytime now.

Intercontinental exchange - Huge influence So many would wonder why I'm looking at this, you'll see why very soon for it will determine everything that happens.
NYSE:ICE
SP:SPX
TVC:SPX
FOREXCOM:SPXUSD
OANDA:SPX500USD
TVC:GOLD
TVC:SILVER
TVC:NDX
NASDAQ:NDX
CURRENCYCOM:US100
CAPITALCOM:US100
AMEX:SPY
CAPITALCOM:SPY

ICE: Breaking through the resistance level.Consolidation was broken upwards, but the target was not reached. After a rollback down, the stock is bought in the area of the local support level 108. A breakout of the resistance level in the area of 121 may lead to an increase in the area of 134.


Weekly update on ETH BTC SPELL ICE FTM AVAXMarket has been ripping higher. here are my chart ups and comments on where we are and where we may be headed.
