ICP/USDT at Key Support Level: Major Bounce or Further Decline?On the Weekly (1W) timeframe, ICP/USDT remains in a long-term bearish structure, characterized by a clear sequence of lower highs and lower lows after failing to sustain the double-digit price zone. Price is currently retesting a historical major demand zone at 3.23 – 2.70, which previously acted as the base for a strong bullish impulse.
This zone is extremely critical, as it represents a key weekly support and a decision area that will determine whether ICP enters a long-term accumulation phase or continues its bearish trend.
---
Key Levels
Major Weekly Demand / Support:
3.23 – 2.70 (yellow box)
Nearest Resistance:
3.90 – 4.60
Mid-Term Resistance:
6.85
Major Supply Zones:
10.95 – 14.55 – 18.80
All-Time High Reference:
38.02
---
Pattern & Structure Explanation
1. Descending Market Structure (Bearish Trend)
Price continues to form lower highs from the 18–20 region, confirming strong seller dominance.
2. Potential Base Formation / Double Bottom (Conditional)
Repeated reactions around 3.23 – 2.70 suggest a possible long-term base, but confirmation is required through a structural breakout.
3. Long Lower Wick Rejection on Weekly Support
Strong lower wicks indicate buying interest and demand absorption, often seen during early accumulation phases.
---
Bullish Scenario
The bullish scenario becomes valid only if:
Price holds above the 3.23 – 2.70 demand zone
A strong weekly close above 3.90 – 4.60 occurs
Bullish Targets (Step by Step):
4.60 → initial recovery confirmation
6.85 → structural resistance
10.95 → major supply zone
14.55 – 18.80 → potential distribution area
This scenario reflects a long-term accumulation and recovery phase rather than a short-term breakout.
---
Bearish Scenario
Bearish continuation is likely if:
Price breaks and closes below 2.70 on a weekly basis
No strong bullish reaction appears inside the demand zone
Bearish Implications:
Failure of the historical demand zone
Increased downside momentum
Potential move into lower price discovery zones
A breakdown below this area would signal structural support invalidation and full seller control.
---
Conclusion
The 3.23 – 2.70 area is a make-or-break zone for ICP.
As long as price holds above this level, long-term accumulation remains possible. A confirmed breakdown, however, would open the door for further bearish continuation.
This is a decision zone, not a FOMO area.
#ICPUSDT #ICP #CryptoAnalysis #WeeklyChart #DemandZone #SupportResistance #BearishTrend #BullishReversal #LongTermSetup
ICP

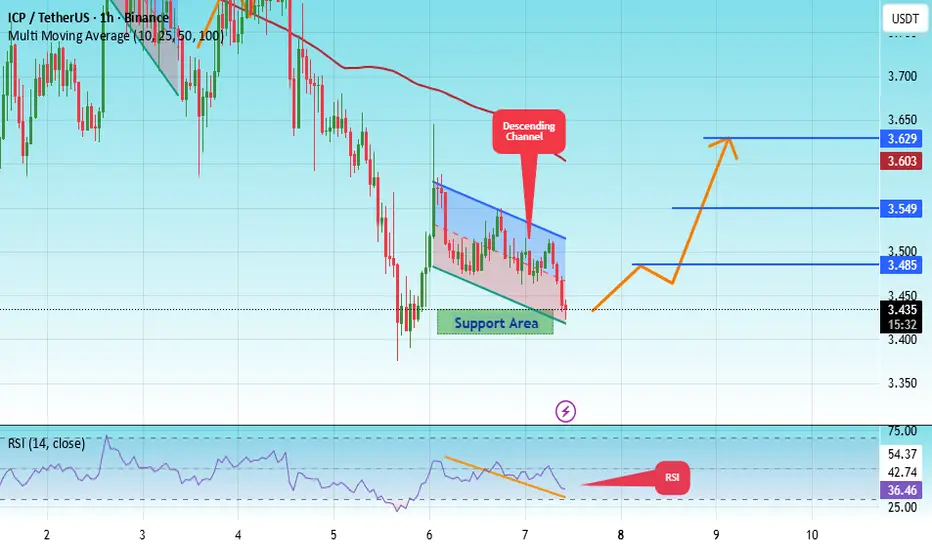
#ICP/USDT The price is moving in a descending channel#ICP
The price is moving within a descending channel on the hourly timeframe. It has reached the lower boundary and is heading towards a breakout, with a retest of the upper boundary expected.
The Relative Strength Index (RSI) is showing a downward trend, approaching the lower boundary, and an upward bounce is anticipated.
There is a key support zone in green at 3.16, and the price has bounced from this level several times. Another bounce is expected.
The indicator is showing a trend towards consolidation above the 100-period moving average, which we are approaching, supporting the upward move.
Entry Price: 3.32
First Target: 3.42
Second Target: 3.54
Third Target: 3.70
Stop Loss: Below the green support zone.
Remember this simple thing: Money management.
For any questions, please leave a comment.
Thank you.

ICP Bullish Structure | Smart DCA Entries at Key Support ZonesThe overall market structure of ICP is clearly bullish, with buyers actively stepping in at key support zones. This behavior shows strong demand, and it would be wise for us to align ourselves with the dominant trend by placing our buy orders within these support areas, allowing us to enter positions in the direction of the prevailing flow.
We are seeing consecutive bullish CH (Change of Character) and BOS (Break of Structure), which are strong confirmations of a potential continuation to the upside. The bullish impulse waves are powerful and impulsive, while the corrective moves are weak, shallow, and composed of small candles, indicating that sellers lack strength and that momentum remains in favor of the bulls.
There are two planned entry zones, and the position should be built using a DCA (Dollar-Cost Averaging) approach to manage risk and improve the average entry price. This strategy allows flexibility in case of short-term pullbacks while maintaining exposure to the bullish trend.
All targets are clearly marked on the chart, based on structure, liquidity zones, and higher-timeframe levels.
⚠️ Risk Management:
This bullish scenario will be invalidated if a daily candle closes below the invalidation level. Such a move would indicate a breakdown in structure and require reassessment of the setup.
As always, proper risk management is essential, and traders should manage position size according to their own strategy.
If you would like us to analyze a coin or altcoin for you, first like this post, then comment the name of your altcoin below.

Internet Computer ICP price analysisInternet Computer CRYPTOCAP:ICP is showing relative strength during the current market correction.
On the OKX:ICPUSDT chart, increased trading volumes stand out, suggesting active participation despite broader market weakness. While CRYPTOCAP:BTC is retracing, CRYPTOCAP:ICP price action remains comparatively stable.
Potential scenarios:
Confirmation setup
A sustained breakout and consolidation above $4.75 would validate bullish continuation, opening a potential upside range of approximately +80%.
Speculative accumulation
Entries between current levels and $3.50 offer a higher-risk opportunity with a broader upside of +145–150%.
Invalidation:
A breakdown below $3.00–3.20 would indicate fading market maker support and reduced upside probability.
Overall, CRYPTOCAP:ICP remains technically interesting as long as it holds above key support zones.
👉 Which scenario do you find more realistic for CRYPTOCAP:ICP over the coming weeks?
______________
◆ Follow us ❤️ for daily crypto insights & updates!
🚀 Don’t miss out on important market moves
🧠 DYOR | This is not financial advice, just thinking out loud

ICPUSDT Forming Bullish WaveICPUSDT is forming a clear bullish wave pattern, a classic bullish reversal signal that often indicates an upcoming breakout. The price has been consolidating within a narrowing range, suggesting that selling pressure is weakening while buyers are beginning to regain control. With consistent volume confirming accumulation at lower levels, the setup hints at a potential bullish breakout soon. The projected move could lead to an impressive gain of around 140% to 150% once the price breaks above the wedge resistance.
This falling wedge pattern is typically seen at the end of downtrends or corrective phases, and it represents a potential shift in market sentiment from bearish to bullish. Traders closely watching ICPUSDT are noting the strengthening momentum as it nears a breakout zone. The good trading volume adds confidence to this pattern, showing that market participants are positioning early in anticipation of a reversal.
Investors’ growing interest in ICPUSDT reflects rising confidence in the project’s long-term fundamentals and current technical strength. If the breakout confirms with sustained volume, this could mark the start of a fresh bullish leg. Traders might find this a valuable setup for medium-term gains, especially as the wedge pattern completes and buying momentum accelerates.
✅ Show your support by hitting the like button and
✅ Leaving a comment below! (What is your opinion about this Coin?)
Your feedback and engagement keep me inspired to share more insightful market analysis with you!

#ICP Is Coiling Up for a Big Move— Classic HNS pattern
Yello Paradisers! Have you spotted what’s shaping up to be a textbook Head and Shoulders pattern on #ICP? If not, you might be missing one of the cleanest bullish setups we’ve seen forming in recent weeks. The structure is clear, and the signals are starting to align—this could be your early heads-up before the next big leg.
💎We’re currently watching a classic inverse Head and Shoulders pattern unfolding, with a notable RSI divergence between the left shoulder and the head. That divergence often signals momentum shifting before price action catches up, and in this case, it’s a sign that buyers may be stepping in just as the pattern is maturing.
💎The neckline is the key level here. If the price breaks through that neckline with conviction, it will confirm the pattern and open the door to a high-confidence breakout scenario. But until that happens, patience is essential. Confirmation is everything in this type of setup.
💎To the downside, major support sits around $2.660. This will act as the final line in the sand for the bullish scenario. If price holds above this level, the bullish structure remains valid. A breakdown below it, however, would invalidate the setup and likely lead to further downside pressure.
💎The first obstacle is around $4.800, just below the psychological round number, which is also the projected level of the HNS pattern. This level may provide temporary rejection or hesitation. The bigger take-profit zone is around $6.500, which marks a significant resistance zone and aligns perfectly with the 0.618 Fibonacci retracement from the Nov–Dec 2025 downswing. That confluence adds even more weight.
💎The market is setting the stage, but the trade isn't ready yet. What matters now is not being early but being right. Let the pattern complete, let the market confirm, and then strike with confidence.
That is why we are playing it safe right now. If you want to be consistently profitable, you need to be extremely patient and always wait only for the best, highest probability trading opportunities like Paradisers do.
MyCryptoParadise
iFeel the success🌴

#ICP/USDT Short 1 H#ICP
The price is moving within a descending channel on the hourly timeframe. It has reached the upper boundary and is heading towards breaking it. A retest of this boundary is expected.
The Relative Strength Index (RSI) is showing an upward trend, as it has approached the upper boundary. A bearish reversal is expected.
There is a key support zone in green at 3.51. The price has bounced from this zone several times and is expected to bounce again.
A consolidation trend is observed above the 100-period moving average, which we are approaching. This trend supports a decline towards this level.
Entry Price: 3.22
Target 1: 3.15
Target 2: 3.047
Target 3: 2.94
Stop Loss: Above the green support zone.
Remember this simple thing: Money management.
For any questions, please leave a comment.
Thank you.

ICP is on the verge of a big breakout !!Price is coiling inside a massive multi month bullish descending wedge.
Breakout will probably be in days, not in weeks or months.
A floor has been put in at just below 3$ (around 2.91) and I guess this floor will not be broken for the time being.
M A S S I V E volume spike has occurred in november 2025, which should be a prelude of things to come.
ICP is a very ambitious project that is still under the radar and whose image has been affected by its launch that was highjacked by FTX and its Sam Bankman Fried.
ICP could be the number 1 decentralized AI project - the only fully onchain AI project of the digital asset space.
I guess I have still not enough ICP tokens.
NOTE: not financial advice, but I tell you what I am doing with my money.

Is ICP bottoming even against Gold ?The next days and weeks will show the truth but my gut is telling me that ICP is bottoming against hard currency !!
While the USD may not be a reliable unit of account anymore (considering its weakness and its hyper inflative nature) we try to measure its strenght relative to Gold (shout out to Francis the Crypto Sniper).

ICP/USDT at Make-or-Break Zone - Reversal or Further Sell-Off?ICP/USDT on the Weekly (1W) timeframe is still moving within a long-term downtrend structure after failing to hold above the $20 area. Price has now moved lower and is currently testing a very strong historical demand zone at $3.215 – $2.200 (yellow box).
This zone previously acted as a major accumulation base before the strong bullish impulse in early 2024. Price reaction in this area will be a key determinant for the medium- to long-term trend direction.
---
Structure & Chart Pattern
Primary Trend: Bearish (Lower High & Lower Low still valid)
Current Phase: Major Demand Zone Test / Accumulation Area
Market Structure:
Breakdown from the previous consolidation structure
Price has returned to the lowest historical support area
Volatility Spike:
Presence of an extreme long lower wick → strong rejection from lower prices & potential smart money buying
---
Key Levels
Major Demand Zone:
🟨 $3.215 – $2.200 (critical make-or-break zone)
Step-by-Step Resistance Levels:
$4.580
$6.850
$10.950
$14.550
Major Supply / Higher Timeframe Resistance:
$18.830 – $20.985
---
Bullish Scenario
The bullish scenario becomes valid if and only if:
Price holds above the $3.215 – $2.200 demand zone
A weekly higher low or bullish weekly close is formed
Followed by a break and close above $4.580
Bullish Targets (Step-by-Step):
1. $4.580 (structure retest)
2. $6.850 (mid resistance)
3. $10.950 (major breakout confirmation)
4. $14.550 – $18.830 (bullish continuation zone)
📌 Note:
As long as price holds above the demand zone, ICP has the potential to form a long-term accumulation base for a major reversal.
---
Bearish Scenario
The bearish scenario will play out if:
Price records a strong weekly close below $2.200
The major demand zone fails to hold
Bearish Implications:
Breakdown of historical support
Increased risk of extended panic selling
Price may enter lower price discovery
Bearish structure becomes stronger and fully validated
📌 $2.200 is the final psychological and technical boundary.
---
Conclusion
ICP is currently at a critical long-term decision point.
The $3.215 – $2.200 zone represents a major decision area:
Holding the zone → potential reversal & accumulation
Breaking the zone → extreme bearish continuation
Aggressive positioning is not recommended until a clear weekly close confirmation is observed.
---
#ICP #ICPUSDT #Altcoin #CryptoAnalysis #AltcoinAnalysis #WeeklyChart #MarketStructure
#DemandZone #SupportResistance #Downtrend #PotentialReversal
#SmartMoney

#ICP/USDT The price is moving in a descending channel#ICP
The price is moving in a descending channel on the 1-hour timeframe. It has reached the lower boundary and is heading towards a breakout, with a retest of the upper boundary expected.
We are seeing a bearish trend in the Relative Strength Index (RSI), which has reached near the lower boundary, and an upward bounce is expected.
There is a key support zone in green at 3.03, and the price has bounced from this level several times. Another bounce is expected.
We are seeing a trend towards stabilizing above the 100-period moving average, which we are approaching, supporting the upward trend.
Entry Price: 3.11
First Target: 3.13
Second Target: 3.22
Third Target: 3.33
Place your stop-loss order below the green support zone.
Remember a simple principle: Money Management.
For any questions, please leave a comment.
Thank you.

#ICP/USDT The price is moving in a descending channel#ICP
The price is moving in a descending channel on the 1-hour timeframe. It has reached the lower boundary and is heading towards breaking above it, with a retest of the upper boundary expected.
We have a downtrend on the RSI indicator, which has reached near the lower boundary, and an upward rebound is expected.
There is a key support zone in green at 2.77. The price has bounced from this zone multiple times and is expected to bounce again.
We have a trend towards stability above the 100-period moving average, as we are moving close to it, which supports the upward movement.
Entry price: 2.82
First target: 2.87
Second target: 2.94
Third target: 3.03
Stop loss: Below the support zone in green.
Don't forget a simple thing: capital management.
For inquiries, please leave a comment.
Thank you.

#ICP/USDT The price is moving in a descending channel#ICP
The price is moving in a descending channel on the 1-hour timeframe. It has reached the lower boundary and is heading towards breaking above it, with a retest of the upper boundary expected.
We have a downtrend on the RSI indicator, which has reached near the lower boundary, and an upward rebound is expected.
There is a key support zone in green at 3.10. The price has bounced from this zone multiple times and is expected to bounce again.
We have a trend towards consolidation above the 100-period moving average, as we are moving close to it, which supports the upward movement.
Entry price: 3.18
First target: 3.25
Second target: 3.37
Third target: 3.51
Don't forget a simple principle: money management.
Place your stop-loss below the support zone in green.
For any questions, please leave a comment.
Thank you.

#ICP/USDT The price is moving in a descending channel#ICP
The price is moving in a descending channel on the 1-hour timeframe. It has reached the lower boundary and is heading towards breaking above it, with a retest of the upper boundary expected.
We have a downtrend on the RSI indicator, which has reached near the lower boundary, and an upward rebound is expected.
There is a key support zone in green at 3.25. The price has bounced from this zone multiple times and is expected to bounce again.
We have a trend towards consolidation above the 100-period moving average, as we are moving close to it, which supports the upward movement.
Entry price: 3.30
First target: 3.35
Second target: 3.43
Third target: 3.50
Don't forget a simple principle: money management.
Place your stop-loss below the support zone in green.
For any questions, please leave a comment.
Thank you.

#ICP/USDT The price is moving in a descending channel#ICP
The price is moving in a descending channel on the 1-hour timeframe. It has reached the lower boundary and is heading towards breaking above it, with a retest of the upper boundary expected.
We have a downtrend on the RSI indicator, which has reached near the lower boundary, and an upward rebound is expected.
There is a key support zone in green at 2.80. The price has bounced from this zone multiple times and is expected to bounce again.
We have a trend towards consolidation above the 100-period moving average, as we are moving close to it, which supports the upward movement.
Entry price: 2.88
First target: 2.92
Second target: 2.98
Third target: 3.06
Don't forget a simple principle: money management.
Place your stop-loss below the support zone in green.
For any questions, please leave a comment.
Thank you.

#ICP/USDT #ICP The price is moving in a descending channel #ICP
The price is moving in a descending channel on the 1-hour timeframe. It has reached the lower boundary and is heading towards breaking above it, with a retest of the upper boundary expected.
We have a downtrend on the RSI indicator, which has reached near the lower boundary, and an upward rebound is expected.
There is a key support zone in green at 3.40. The price has bounced from this zone multiple times and is expected to bounce again.
We have a trend towards consolidation above the 100-period moving average, as we are moving close to it, which supports the upward move.
Entry price: 3.43
First target: 3.48
Second target: 3.55
Third target: 3.63
Don't forget a simple principle: money management.
Place your stop-loss below the green support zone.
For any questions, please leave a comment.
Thank you.
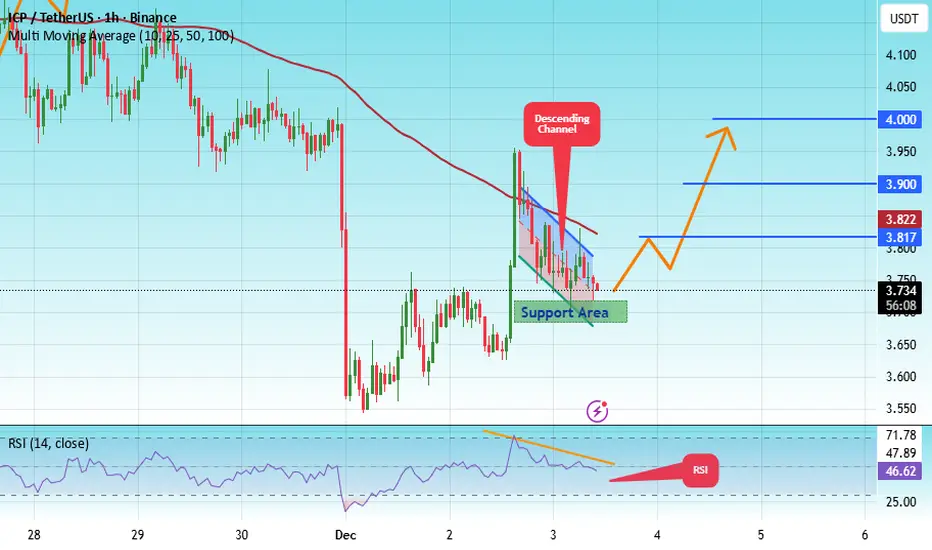
#ICP/USDT Ready for a Breakout — Double Digits Possible#ICP
The price is moving in a descending channel on the 1-hour timeframe. It has reached the lower boundary and is heading towards breaking above it, with a retest of the upper boundary expected.
We have a downtrend on the RSI indicator, which has reached near the lower boundary, and an upward rebound is expected.
There is a key support zone in green at 3.70. The price has bounced from this zone multiple times and is expected to bounce again.
We have a trend towards stability above the 100-period moving average, as we are moving close to it, which supports the upward movement.
Entry price: 3.74
First target: 3.82
Second target: 3.90
Third target: 4.00
Don't forget a simple principle: money management.
Place your stop-loss below the green support zone.
For any questions, please leave a comment.
Thank you.
ICP local trade for DecemberAfter the October 10 drop, ICP has recovered quite nicely! Showing growth from below $2 all the way up to nearly $10! BINANCE:ICPUSDT
Friendly reminder: Taking 50% profits (i.e., withdrawing your initial investment from the market) to leave the rest as "free" coins has never been a mistake!
Always calculate your risks and any possible outcomes after a rally!
We pulled back pretty quickly, and the buy line of the take-profit indicator is now sitting right at the marked levels! That same level lines up with the monthly open and could serve as a solid accumulation zone for the asset at the start of December!
The take-profit line from the same indicator is marked on the chart!
I'm expecting the direction to push back up toward a test of the yearly open!
In case of another dip, I'll be eyeing the 50% wick overlap level for adding spot positions! Everything else is pure speculation on futures plays!
Thanks for support

#ICP/USDT Ready for a Breakout — Double Digits Possible#ICP
The price is moving in a descending channel on the 1-hour timeframe. It has reached the lower boundary and is heading towards breaking above it, with a retest of the upper boundary expected.
We have a downtrend on the RSI indicator, which has reached near the lower boundary, and an upward rebound is expected.
There is a key support zone in green at 4.04. The price has bounced from this zone multiple times and is expected to bounce again.
We have a trend towards consolidation above the 100-period moving average, as we are moving close to it, which supports the upward movement.
Entry price: 4.12
First target: 4.22
Second target: 4.37
Third target: 4.55
Don't forget a simple money management rule:
Place your stop-loss order below the green support zone.
Once you reach the first target, save some money and then change your stop-loss order to an entry order.
For any questions, please leave a comment.
Thank you.

ICP - UPDATECRYPTOCAP:ICP - price analysis:
DAILY DOJI = NEUTRAL.
WEEKLY = NEUTRAL
Let's keep it simple, prices is currently consolidating above the exact 50% FIB level from the previous 240%+ bull wave!
If it consolidate above 3.850$ that could be a a good bottom before to see another bull rally 📈
If it fail: Lower big supports:
3.720 - 3.350 - 3.150 - 2.900$
My opinion:
Structure looks bullish on the H2 TF (wedge).
It looks like market manipulation, before to see another big move. LIkely bullish if it break the trend & structure 📈
At the moment, nothing is sure under the wedge trend.
Where do you think price will bottom? 👀

#ICP/USDT Ready for a Breakout — Double Digits Possible#ICP
The price is moving within an ascending channel on the 1-hour timeframe and is adhering to it well. It is poised to break out strongly and retest the channel.
We have a downtrend line on the RSI indicator that is about to break and retest, which supports the upward move.
There is a key support zone in green at the 4.90 price, representing a strong support point.
We have a trend of consolidation above the 100-period moving average.
Entry price: 5.05
First target: 5.20
Second target: 5.42
Third target: 5.70
Don't forget a simple money management tip:
Place your stop-loss order below the green support zone.
Once you reach the first target, save some money and then change your stop-loss order to an entry order.
For any questions, please leave a comment.
Thank you.

ICP Update🚨📊 ICP Update
ICP has also formed a new resistance zone in red 🔴.
This level is now acting as a strong ceiling,
and price must break out above this red resistance
to show any real bullish momentum again.
Until that breakout happens,
sellers remain in control and upside stays limited.
👉 Get real-time trade alerts:

ICP turn around? It's a bit early, but resistance became support after a brief consolidation between $5.15 - $5.30. Are we heading back to $5.80+? Time will tell.
