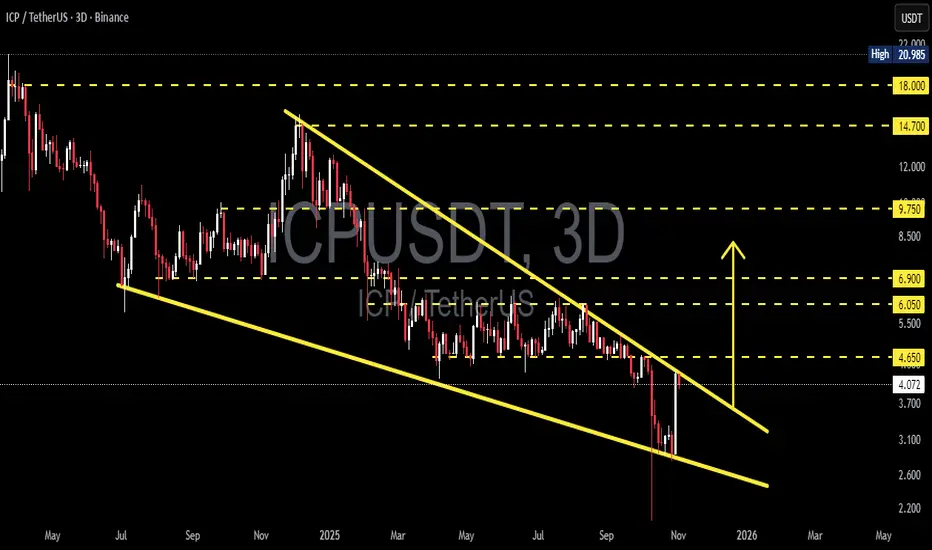
ICPUSDT – Major Reversal Setup Forming! Ready for Breakout Move?The ICP/USDT chart is currently displaying a highly critical structure as price continues to compress within a Falling Wedge pattern that has been developing since early 2025.
This formation is often seen as a bullish reversal signal — typically marking the end of a prolonged downtrend and the start of an accumulation or reversal phase.
At the current price level around $4.09, selling pressure has started to weaken, while buying pressure is gradually building up. Price is reacting positively from the lower wedge boundary and is now challenging the upper trendline resistance.
A confirmed breakout above this zone, especially with strong volume, could spark a major bullish momentum — opening the door for a move toward the next resistance targets at $4.65, $6.05, and $6.90.
However, if the price faces rejection once again from the upper wedge boundary, consolidation or another retest of the $3.10–$2.60 support zone remains possible.
This area marks a decisive moment for ICP’s mid-term direction.
---
Pattern Description
A clear Falling Wedge (Bullish Reversal Pattern) is visible through two downward-sloping and converging trendlines.
Key characteristics: lower lows are slowing down, highs continue to descend, and trading volume decreases over time.
Technical implication: selling pressure is fading, and accumulation is likely occurring before a potential reversal.
---
Bullish Scenario
A confirmed bullish breakout would occur once the price closes decisively above the upper wedge line and the $4.65 resistance on the 3-day timeframe, accompanied by a surge in trading volume.
If validated, upside targets could include:
Target 1: $6.05 (initial resistance and profit-taking area)
Target 2: $6.90 (mid-range wedge resistance)
Target 3: $9.75 (major resistance zone and possible momentum expansion)**
Breakouts from large falling wedges on higher timeframes often trigger strong mid- to long-term reversals, particularly when supported by high volume.
---
Bearish Scenario
If the breakout attempt fails and price gets rejected around the $4.65–$4.80 region, selling pressure could drag ICP back down toward the $3.10 – $2.60 support zone.
A breakdown below this area would invalidate the bullish setup and likely resume the macro bearish trend.
The $3.10 level is the key structural support — losing it would confirm renewed weakness.
---
Overall Outlook
ICP is currently at a make-or-break level, where a confirmed breakout could shift market sentiment from bearish to neutral–bullish.
The technical structure favors a potential trend reversal, but confirmation is crucial before positioning aggressively.
False breakouts remain possible, so risk management and patience are essential.
Psychologically, reclaiming $4.65 would be the first sign of a sentiment shift, potentially leading to renewed investor confidence in ICP’s mid-term recovery.
---
Summary
Pattern: Falling Wedge (Bullish Reversal Pattern)
Status: Approaching breakout area
Bullish Trigger Zone: Above $4.65
Bullish Targets: $6.05 → $6.90 → $9.75
Critical Support Zone: $3.10 – $2.60
Dominant Bias: Neutral turning bullish upon breakout confirmation
---
#ICP #ICPUSDT #ICPTether #CryptoAnalysis #TechnicalAnalysis #FallingWedge #ReversalPattern #BreakoutSetup #SwingTrade #CryptoChart #AltcoinWatch #MarketStructure
Icpusdc
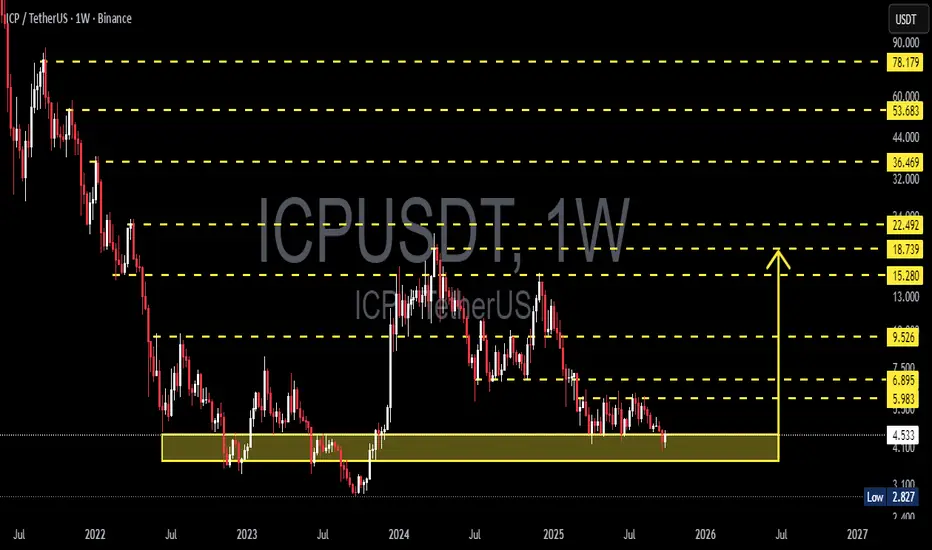
ICPUSDT — Retesting Demand Zone: Capitulation or Major Reversal?Weekly Overview
Internet Computer (ICP) is now entering a critical test phase at its long-standing historical demand zone between 2.80 and 4.53 USDT — an area that has repeatedly acted as the last line of defense for buyers since mid-2022.
This zone is not just another technical level. It represents a multi-year accumulation range where institutional money has historically shown interest, triggering two major reversals in the past (early 2023 and early 2024).
Now, the market is testing it for the third time, and the outcome of this retest may decide ICP’s direction for the next several months — or even years.
---
Structure and Pattern Context
Since its peak in 2021, ICP has been in a long-term structural downtrend, forming a sequence of consistent lower highs.
However, it’s also built a horizontal accumulation base below 5 USDT.
The 2.80–4.53 zone acts as a compressed demand layer, where selling pressure weakens every time this range is revisited.
On the weekly timeframe, recent candles show:
Smaller body sizes,
Long lower wicks,
And declining bearish volume — clear signs of seller exhaustion.
In short, the market stands at a crossroads between “the final breakdown” and “the birth of a long-term reversal.”
---
Bullish Scenario — Potential Reversal Phase
If this demand zone holds once again, ICP could enter a medium-term reversal cycle.
Here’s what would confirm a bullish structure shift:
1. Bullish Reversal Candle — a weekly engulfing, hammer, or morning star pattern appearing inside 2.80–4.53.
2. Volume Confirmation — a noticeable increase in bullish volume, signaling smart money accumulation.
3. Structure Break — a successful weekly close above 5.98 USDT, forming a new higher high.
If these confirmations occur, ICP could initiate a gradual expansion phase toward key resistance targets:
Target 1: 5.98 USDT – structure validation
Target 2: 6.90 USDT – breakout confirmation
Target 3: 9.53 USDT – major swing resistance
Mid-term target: 15.28–18.73 USDT if momentum persists
Each step upward will depend on overall crypto sentiment and volume strength across the market.
---
Bearish Scenario — Breakdown & Capitulation Risk
If bearish pressure continues and ICP closes a weekly candle below 2.80, the accumulation base built over the last two years would become invalidated.
Such a breakdown could trigger final capitulation, characterized by panic selling and heavy volume.
Below 2.80, there’s no major historical support, meaning the price could enter a free-fall zone toward 2.00 or lower before stabilizing.
Ironically, such capitulation events often mark the true bottom of a cycle — a classic pattern seen before every major crypto bull run.
---
Structural Perspective — End of the Downtrend?
Some longer-term signals suggest ICP may be approaching trend exhaustion:
Weekly RSI has remained in oversold territory for a prolonged time, while price fails to make new lows — indicating bullish divergence.
Major distribution phases occurred between 2022–2023, implying most selling pressure is likely done.
Price action resembles a late-stage accumulation phase, where smart money prepares for long-term positions (12–24 months ahead).
If this demand holds, the 2.80–4.53 range could become ICP’s legendary bottom, much like ETH’s 2020 base or ADA’s 2020–2021 accumulation.
---
Conclusion
ICP stands at a make-or-break point — the most decisive level it has seen in two years.
Holding 2.80–4.53 → opens the door for a potential major reversal.
Breaking below 2.80 → signals a final capitulation phase before a new cycle emerges.
Until proven otherwise, the reaction and weekly close inside this demand zone remain the key factor to watch.
As long as 2.80 holds, the bullish probability still exists.
#ICP #ICPUSDT #InternetComputer #Crypto #TechnicalAnalysis #PriceAction #DemandZone #SwingTrade #CryptoMarket #WeeklyChart #ReversalSetup #CryptoTA #Accumulation
ICP/USDT — Major Demand Zone Retest: Rebound or Breakdown Ahead?At the moment, ICP is standing at a very critical crossroads. The weekly chart shows the price retesting the historical demand zone around $4.10 – $4.79. This area has repeatedly acted as a strong accumulation base in the past, triggering significant rallies. However, the more often this zone gets tested without a breakout to the upside, the higher the risk of a breakdown.
---
🔎 Key Technical Structure
1. Long-Term Trend: ICP remains in a broad downtrend since launch, with failed mid-term rallies along the way.
2. Demand Zone $4.1 – $4.8: A psychological and historical support area, holding the price since 2022.
3. Layered Resistances: Key levels to watch are $5.98, $6.90, $9.53, followed by $15.28, $18.74, and $22.49. Breaking through these would confirm a larger bullish reversal.
4. Final Support Below: If breakdown occurs, the next major level sits at $2.827 — a historical low.
---
📈 Bullish Scenario
Validation: A strong weekly bullish close within or above $4.1–$4.8, supported by rising volume, would signal potential accumulation.
Short-Term Target: $5.98 – $6.90 → reclaiming this range could push ICP toward $9.53.
Mid-Term Target: If momentum continues, ICP could revisit $15.28 – $18.74, and even $22.49.
Potential Pattern: A double bottom / W pattern would form if price closes above the $6.9 neckline.
---
📉 Bearish Scenario
Breakdown Confirmation: A weekly close below $4.10 = strong bearish continuation signal.
Downside Target: Price may slide toward $2.827 (historical low).
Seller Dominance: A breakdown with rising sell volume would confirm extended bearish control.
Risk Factor: Losing this demand zone would likely extend ICP’s bear cycle significantly.
---
📊 Price Action & Patterns
Sideways Range in Demand Zone: Currently, price is moving sideways within demand → this is a classic setup for accumulation or distribution.
Breakout Above: Signals accumulation → start of a potential uptrend.
Breakdown Below: Signals distribution → likely deeper decline.
---
⚖️ Conclusion
ICP is at a make-or-break zone:
Holding above $4.1–$4.8 could spark a strong reversal rally back toward $6.9 – $9.5, with higher targets possible.
A breakdown below $4.1 would expose ICP to a retest of the $2.8 low, keeping the long-term bearish structure intact.
📌 For traders, this is the time to wait for weekly candle confirmation & volume before committing.
📌 For long-term investors, this zone offers a high-risk but high-reward accumulation area — strict stop losses are essential.
---
#ICP #ICPUSDT #CryptoAnalysis #WeeklyChart #SupportResistance #TechnicalAnalysis #SwingTrading #Altcoins #CryptoStrategy


#icpusdtI can’t say anything.it’s soo beautiful :)
I think it’s very good signal
Don’t forget stop loss

Internet Computer (ICP) formed Gartley for upto 46.50% moveHi dear friends, hope you are well and welcome to the new trade setup of Internet Computer (ICP) with US Dollar pair.
Our last successful trade of ICP was as below:
Now on a daily time frame, ICP has formed a bullish Gartley pattern for the next price reversal.
Note: Above idea is for educational purpose only. It is advised to diversify and strictly follow the stop loss, and don't get stuck with trade

ICP inverted H&S*log scale
Internet Computer is approaching the major downtrendline which dominated for almost a year. Price forming Inverted Head and Shoulders 🤷 so it looks like price may be bottoming but still too early to say! IF price breaks the Neckline @ 9.8 and the major downtrendline then I think there is chance for run to 14.9 and even higher. Check how the iH&S target coincides with important market structure (yellow).
ENTRY : Neckline break @ 9.8
STOPLOSS (SL) : Left Shoulder @ 6.75
TARGET (TP) : Inverted H&S target projection @ 14.9 (view reg scale to do the projection Head-Neckline = Neckline-Target)
REWARD RISK RATIO (RRR) : 1.5
INVALIDATION : when SL level hit (Left Shoulder @ 6.75)
Check my other stuff in related ideas.
Please boost🚀, comment🗣️, follow me✒️, enjoy📺!
⚠️Disclaimer: I'm not financial advisor. This is not a financial advice. Do your own due dilingence.

ICPUSDT Ready To Take OffICPUSDT (Day Chart) Technical analysis update
ICP/USDT currently trading at $35.00
Descending channel formation
Buy level: $35.00- $38.00
if price breaks above the resistance level , we can expect big up move.
TP 1: $55.00
TP 2: $75.00
TP 3: $100.00
TP 4: $125.00
Stop loss:$22.00
Max Leverage: 1x or buy it on spot market.

ICPUSDT, Our buy zone activated Hello everybody
According to our previous analysis of ICP we shown on chart that the price should drop more and it can come to our buy zone area and activated that and wait until the target reach
You can buy now at this buy zone area in 2 and 3 step and then wait until reach to the target
Dont forget use stop loss , This is spot trading but because of the condition of market and condition of the ICP use stop loss
Previous analysis :
Good Luck
Abtin

ICPUSDT, We are near of buy zone areaHello everybody
According to the chart you can see from the added in exchanges the price is falling down until here, everyone say its scam project or ... but its not scam, the point is the team is not working correctly and they promise to do exactly the road map
In here according to the chart , we are in downard trend and we should becareful for any buy
If you have any question send us your messages
Good Luck
Abtin

LongHi guys, it looks like we are moving in a price channel where the reactions to the floor and ceiling are quite obvious, and based on this, the position can be opened by stopping the closing of the candle below $ 37 per day. The goals are also clear.

ICP BULLISH INTERNET COMPUTER ICPBTC ICPUSD ICPUSDT ICPUSDCICP BULLISH INTERNET COMPUTER ICPBTC ICPUSD ICPUSDT ICPUSDC
